Market Overview
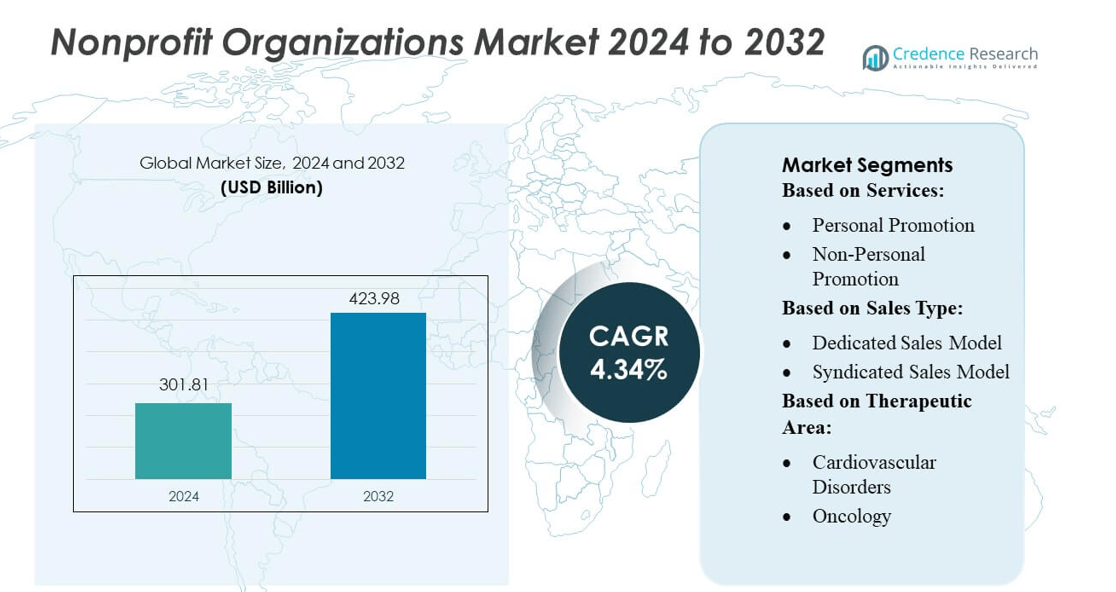
Nonprofit Organizations Market size was valued USD 301.81 billion in 2024 and is anticipated to reach USD 423.98 billion by 2032, at a CAGR of 4.34% during the forecast period.
| REPORT ATTRIBUTE |
DETAILS |
| Historical Period |
2020-2023 |
| Base Year |
2024 |
| Forecast Period |
2025-2032 |
| Nonprofit Organizations Market Size 2024 |
USD 301.81 billion |
| Nonprofit Organizations Market, CAGR |
4.34% |
| Nonprofit Organizations Market Size 2032 |
USD 423.98 billion |
The nonprofit organizations market features a mix of large global foundations, national charitable institutions, and specialized mission-driven organizations that compete by strengthening donor engagement, expanding digital capabilities, and demonstrating measurable impact. Leading players focus on multi-channel fundraising, data-driven program management, and strategic partnerships to enhance efficiency and visibility. North America remains the leading region, holding an exact market share of 37%, supported by strong philanthropic culture, high individual giving rates, and robust regulatory frameworks that promote transparency and institutional funding. Its mature digital infrastructure and diversified donor base further reinforce its dominant position in the global nonprofit landscape.
Market Insights
- The Nonprofit Organizations Market was valued at USD 301.81 billion in 2024 and is projected to reach USD 423.98 billion by 2032, expanding at a CAGR of 4.34%, driven by rising global demand for social welfare, digital fundraising, and structured donor engagement.
- Market drivers include increasing philanthropic participation, stronger CSR commitments, and rapid adoption of tech-enabled fundraising platforms that enhance donor communication and operational efficiency.
- Key market trends highlight the growing use of AI-based analytics, digital impact measurement tools, and hybrid fundraising models that blend virtual and in-person outreach to boost donor retention.
- Competitive analysis shows a fragmented landscape where organizations differentiate through transparency, data-driven reporting, and partnerships; the services segment leads with a 50%+ share due to high adoption of personalized fundraising strategies.
- Regional analysis identifies North America as the dominant region with 37% share, supported by advanced digital infrastructure, diversified funding sources, and strong regulatory frameworks.
Access crucial information at unmatched prices!
Request your sample report today & start making informed decisions powered by Credence Research Inc.!
Download Sample
Market Segmentation Analysis:
By Services
The services segment in the nonprofit organizations market is dominated by Personal Promotion, capturing an estimated 48–52% share due to its strong focus on donor engagement, targeted fundraising outreach, and tailored communication strategies. Nonprofits increasingly prioritize personalized donor journeys, leveraging data-driven outreach, one-to-one messaging, and customized campaigns to improve conversion and retention. Growth is driven by rising investment in CRM platforms, segmentation tools, and behavior-based engagement models that enhance donor lifetime value. Personal Promotion outperforms Non-Personal Promotion and Others because it consistently delivers higher response rates and stronger long-term donor relationships.
- For instance, Gerresheimer is a well-established systems and solutions provider to the pharma, biotech, and cosmetics industries. Over 40 Production Sites in 16 Countries.
By Sales Type
The Dedicated Sales Model leads this segment with a 55–60% market share, propelled by nonprofits’ preference for specialized teams that focus exclusively on fundraising, donor acquisition, and stakeholder partnerships. Organizations rely on dedicated sales structures to implement targeted outreach, manage high-value donor portfolios, and execute mission-aligned fundraising strategies with greater accountability. This model offers stronger relationship management, higher donor trust, and improved conversion efficiency compared to the Syndicated Sales Model. Demand continues increasing as nonprofits expand structured fundraising operations and adopt performance-driven sales processes to strengthen recurring revenue streams.
- For instance, Promoveo Health has custom-built more than 100 dedicated sales teams since 1997, and can deploy a fully W2-representative field sales force in as little as three weeks.
By Therapeutic Area
Within therapeutic-area-based nonprofit initiatives, Oncology is the dominant sub-segment, accounting for 40–45% of market share due to the high global disease burden, strong donor interest, and substantial funding allocated to cancer research, awareness, and patient-support programs. Oncology nonprofits benefit from continuous innovation pipelines, high-impact advocacy campaigns, and strong partnerships with research institutions. Rising cancer incidence and growing public awareness campaigns further stimulate funding and program expansion. Cardiovascular, Metabolic, Neurology, and Other disorders follow, but oncology remains the largest due to its broad societal impact and consistent multi-source funding streams.
Key Growth Drivers
Rising Demand for Social Impact and Community Development
Growing awareness of social inequalities and global humanitarian needs continues to strengthen demand for nonprofit services. Individuals, corporations, and governments increasingly channel resources toward community development, education, healthcare access, and environmental sustainability. This surge in mission-driven participation fuels higher program funding, volunteer engagement, and cross-sector collaborations. Additionally, expanding CSR mandates and stakeholder expectations push organizations to support measurable social impact initiatives, enabling nonprofits to broaden service portfolios and scale operations. The shift toward ethical consumerism and philanthropy further accelerates nonprofit growth across emerging and developed economies.
- For instance, 3M AURA 1870+ respirator is a NIOSH-approved N95 healthcare particulate respirator that uses a three-panel, non-woven filtration media designed to capture at least 95% of airborne particles.
Expansion of Digital Fundraising and Engagement Platforms
Digital transformation significantly enhances nonprofit outreach, enabling organizations to adopt advanced fundraising tools, AI-driven donor analytics, and omnichannel engagement strategies. Online donation platforms, social media campaigns, and virtual events offer scalable and cost-effective fundraising mechanisms that expand donor pools globally. Mobile giving and automated recurring donation systems improve donor convenience and retention, while CRM platforms support personalized communication and targeted appeals. As nonprofits increasingly invest in data-driven platforms and cloud-based workflows, their operational efficiency, donor transparency, and fundraising success strengthen, driving sector-wide growth.
- For instance, Kraton’s CirKular+™ engineered to enable the incorporation of up to 50% or more reclaimed asphalt content in surface-layer mixes while improving processability and maintaining or enhancing mixture performance.
Increased Government Grants and Policy Support
Governments worldwide continue to expand grant programs, tax incentives, and regulatory frameworks that support nonprofit activities in healthcare, education, poverty alleviation, and environmental protection. These favorable policies enhance financial stability and enable nonprofits to undertake long-term developmental projects. Public–private partnerships also grow stronger, with government agencies relying on nonprofit expertise to address community needs and deliver social welfare programs. Enhanced transparency requirements and accountability standards further elevate nonprofit credibility, attracting more institutional funding and strengthening the sector’s growth trajectory.
Key Trends & Opportunities
Adoption of Data Analytics and Impact Measurement Tools
Nonprofits increasingly incorporate data analytics, impact dashboards, and performance measurement frameworks to demonstrate program effectiveness and secure long-term funding. Donors and stakeholders now expect quantifiable results, prompting organizations to adopt outcome-based reporting, real-time monitoring systems, and evidence-driven decision-making. This trend creates opportunities for technology integration, skill development, and strategic consulting partnerships. Enhanced impact measurement not only strengthens credibility but also supports targeted resource allocation and improved beneficiary outcomes, positioning data-enabled nonprofits as preferred partners for funding agencies and global development organizations.
- For instance, Sasol’s SASOBIT additive enables the production of Warm Mix Asphalt (WMA), allowing paving temperatures to be reduced by up to 30°C compared to conventional hot-mix asphalt.
Growth of Corporate–Nonprofit Collaborations
Strategic partnerships between corporations and nonprofits are expanding rapidly, opening new funding avenues and knowledge-sharing opportunities. Businesses increasingly engage nonprofits to execute CSR programs, promote sustainability initiatives, and support community-focused projects. These collaborations enable nonprofits to leverage corporate expertise, digital infrastructure, and employee volunteer programs, while corporations benefit from enhanced brand reputation and alignment with social impact goals. The growing emphasis on ESG frameworks further accelerates corporate–nonprofit alliances, creating long-term opportunities for co-created initiatives, innovation pilots, and joint impact campaigns.
- For instance, Dow Inc.’s Elvaloy® 4170 Reactive Elastomeric Terpolymer (RET) is used in asphalt at dosages as low as 0.5% by weight of the binder, enhancing compatibility and storage stability. The density of standard asphalt binder typically ranges from 1.01 to 1.06 g/cm³ (which is equivalent to 1.01 to 1.06 kg/L).
Expansion of Global Philanthropy Networks
International philanthropy networks are expanding, offering nonprofits access to global donors, cross-border funding, and collaborative impact platforms. High-net-worth donors, global foundations, and diaspora communities actively participate in mission-driven giving, increasing international funding flows. This trend enables nonprofits to scale programs, diversify revenue sources, and engage in multi-country initiatives. Digital platforms also streamline global donations, lowering barriers for international supporters. The growth of global philanthropic ecosystems fosters knowledge sharing, innovation adoption, and partnerships, creating significant opportunities for nonprofits aiming to expand their geographical and thematic reach.
Key Challenges
Funding Volatility and Competitive Donor Landscape
Nonprofits face significant funding instability due to fluctuations in donor contributions, economic uncertainties, and increasing competition for limited grants. With thousands of organizations competing for similar donor segments, securing consistent financial support becomes challenging. Dependence on seasonal donations and project-based grants further amplifies volatility. Economic downturns can reduce philanthropic spending, forcing nonprofits to scale back programs or restructure operations. To sustain long-term growth, organizations must diversify revenue streams, strengthen donor retention strategies, and adopt innovative fundraising technologies to mitigate financial risks.
Regulatory Compliance and Governance Pressures
Nonprofits operate under complex regulatory frameworks involving reporting requirements, transparency mandates, and compliance audits. Meeting these standards demands significant administrative resources, skilled staff, and robust governance systems—areas where many small and mid-sized nonprofits struggle. Non-compliance risks penalty, reputation loss, and funding withdrawal. Additionally, rising expectations for ethical fundraising, data security, and financial accountability add operational strain. Strengthening governance, investing in compliance tools, and building internal capacities remain crucial challenges for nonprofits aiming to maintain credibility and secure long-term funding.
Regional Analysis
North America
North America dominates the nonprofit organizations market with an estimated 35–38% market share, supported by a mature philanthropic culture, high individual giving rates, and well-established institutional foundations. Strong regulatory frameworks, robust CSR commitments, and widespread adoption of digital fundraising platforms further strengthen market expansion. U.S. nonprofits benefit from substantial federal and state grants, enabling large-scale programs in healthcare, education, and community welfare. Canada also contributes significantly through structured charitable tax incentives and rising corporate–nonprofit collaborations. High donor engagement, advanced digital infrastructure, and diversified revenue channels sustain North America’s leadership position.
Europe
Europe holds approximately 27–30% of the market share, driven by strong government support, social welfare policies, and cross-border philanthropic initiatives. Nonprofits in the region benefit from EU funding programs, strict governance standards, and a well-developed volunteer culture. Growth accelerates as organizations expand digital outreach, adopt impact measurement tools, and engage in environmental and humanitarian programs aligned with EU sustainability objectives. Countries such as Germany, the UK, and the Netherlands lead the sector due to high donor trust, transparent reporting structures, and extensive corporate engagement. Europe continues advancing collaborative, policy-driven nonprofit development.
Asia-Pacific
Asia-Pacific accounts for around 22–25% market share, emerging as the fastest-growing region due to rising economic development, expanding middle-class donor populations, and increasing awareness of social issues. Governments in India, China, Japan, and Southeast Asia actively support nonprofit activities through grants, public–private partnerships, and policy reforms. Digital fundraising adoption accelerates rapidly, especially through mobile giving and social media campaigns. Regional nonprofits prioritize education, healthcare access, poverty alleviation, and climate resilience. Despite regulatory complexities, Asia-Pacific’s growing philanthropic networks and expanding corporate contributions position it for strong long-term market growth.
Latin America
Latin America captures 7–9% of the market share, supported by increasing focus on community development, poverty reduction, and environmental protection. Countries such as Brazil, Mexico, and Chile lead nonprofit activities, driven by rising civic engagement and growing collaborations with international NGOs. Despite economic volatility, digital fundraising platforms and grassroots volunteer networks strengthen organizational resilience. Nonprofits increasingly address social justice, disaster response, and youth-focused programs, leveraging partnerships with global donors. Governance challenges persist, but expanding regional philanthropy and enhanced regulatory clarity continue supporting moderate growth in the nonprofit landscape.
Middle East & Africa
The Middle East & Africa region holds 5–7% market share, with growth driven by humanitarian assistance programs, social welfare initiatives, and expanding international donor involvement. Gulf countries support strong philanthropic traditions, aligning nonprofit activities with national development agendas and large-scale charitable foundations. In Africa, nonprofits play a critical role in healthcare access, education, and poverty alleviation, often backed by global funding agencies. Digital donation platforms and youth engagement campaigns are gradually reshaping outreach strategies. Although resource constraints and regulatory fragmentation pose challenges, increasing cross-border collaborations foster steady market expansion.
Market Segmentations:
By Services:
- Personal Promotion
- Non-Personal Promotion
By Sales Type:
- Dedicated Sales Model
- Syndicated Sales Model
By Therapeutic Area:
- Cardiovascular Disorders
- Oncology
By Geography
- North America
- Europe
- Germany
- France
- U.K.
- Italy
- Spain
- Rest of Europe
- Asia Pacific
- China
- Japan
- India
- South Korea
- South-east Asia
- Rest of Asia Pacific
- Latin America
- Brazil
- Argentina
- Rest of Latin America
- Middle East & Africa
- GCC Countries
- South Africa
- Rest of the Middle East and Africa
Competitive Landscape
The nonprofit organizations market players such as MaBico, Promoveo Health, Mednext Pharma Pvt. Ltd., Axxelus, Syneous Health, Peak Pharma Solutions Inc., QFR Solutions, IQVIA, Inc., CMIC Holdings Co., Ltd., and EPS Corp. The nonprofit organizations market remains highly fragmented, with organizations differentiating themselves through digital transformation, impact-driven program models, and transparent governance practices. Competition increasingly centers on the ability to attract sustained donor funding, leverage technology-enabled engagement tools, and demonstrate measurable social outcomes. Nonprofits invest in data analytics, CRM platforms, and multi-channel fundraising strategies to improve donor acquisition and retention. Partnerships with governments, corporations, and global development agencies further strengthen competitive positioning. As expectations for accountability, efficiency, and innovation rise, organizations with strong operational capacity, diversified revenue streams, and scalable program frameworks gain a distinct advantage in this evolving market.
Shape Your Report to Specific Countries or Regions & Enjoy 30% Off!
Key Player Analysis
- MaBico
- Promoveo Health
- Mednext Pharma Pvt. Ltd.
- Axxelus
- Syneous Health
- Peak Pharma Solutions Inc.
- QFR Solutions
- IQVIA, Inc.
- CMIC Holdings Co., Ltd.
- EPS Corp.
Recent Developments
- In August 2025, In Pune, India following community complaints about mud and debris on the roads near Hinjewadi’s Megapolis Township, the Maharashtra Industrial Development corporation(MIDC) launched a clean-up drive targeting construction site pollution.
- In December 2024, Novo Holdings completed a acquisition of Catalent, expanding its scope in the manufacturing and commercial services sector end-to-end outsourcing scope across manufacturing and commercial services.
- In March 2024, EPNextS Group and Frontage Laboratories began a collaboration to address Japan’s “drug lag” and “drug loss” by streamlining early-phase clinical trials in the U.S.. This initiative aims to speed up new drug approvals and enhance commercialization for pharmaceutical Contract Sales Organizations (CSOs)
Report Coverage
The research report offers an in-depth analysis based on Services, Sales Type, Therapeutic Area and Geography. It details leading market players, providing an overview of their business, product offerings, investments, revenue streams, and key applications. Additionally, the report includes insights into the competitive environment, SWOT analysis, current market trends, as well as the primary drivers and constraints. Furthermore, it discusses various factors that have driven market expansion in recent years. The report also explores market dynamics, regulatory scenarios, and technological advancements that are shaping the industry. It assesses the impact of external factors and global economic changes on market growth. Lastly, it provides strategic recommendations for new entrants and established companies to navigate the complexities of the market.
Future Outlook
- The market will increasingly rely on digital fundraising platforms and data-driven donor engagement to sustain long-term growth.
- Nonprofits will adopt advanced impact measurement tools to improve transparency and strengthen stakeholder trust.
- Cross-sector collaborations with governments, corporations, and global development agencies will expand significantly.
- Technology integration, including AI-enabled analytics and automation, will enhance operational efficiency and program delivery.
- Donor expectations for accountability and measurable social outcomes will intensify across all regions.
- Global philanthropy networks will grow, enabling nonprofits to diversify funding sources and expand geographic reach.
- Hybrid fundraising models combining virtual, in-person, and community-driven initiatives will become standard practice.
- Regulatory oversight will continue to increase, pushing nonprofits to strengthen governance and compliance capabilities.
- Talent development and leadership training will gain importance as organizations scale complex mission-driven programs.
- Environmental, social, and humanitarian initiatives will remain central, driving continued demand for nonprofit services worldwide.


