On-Demand Transportation Market Overview:
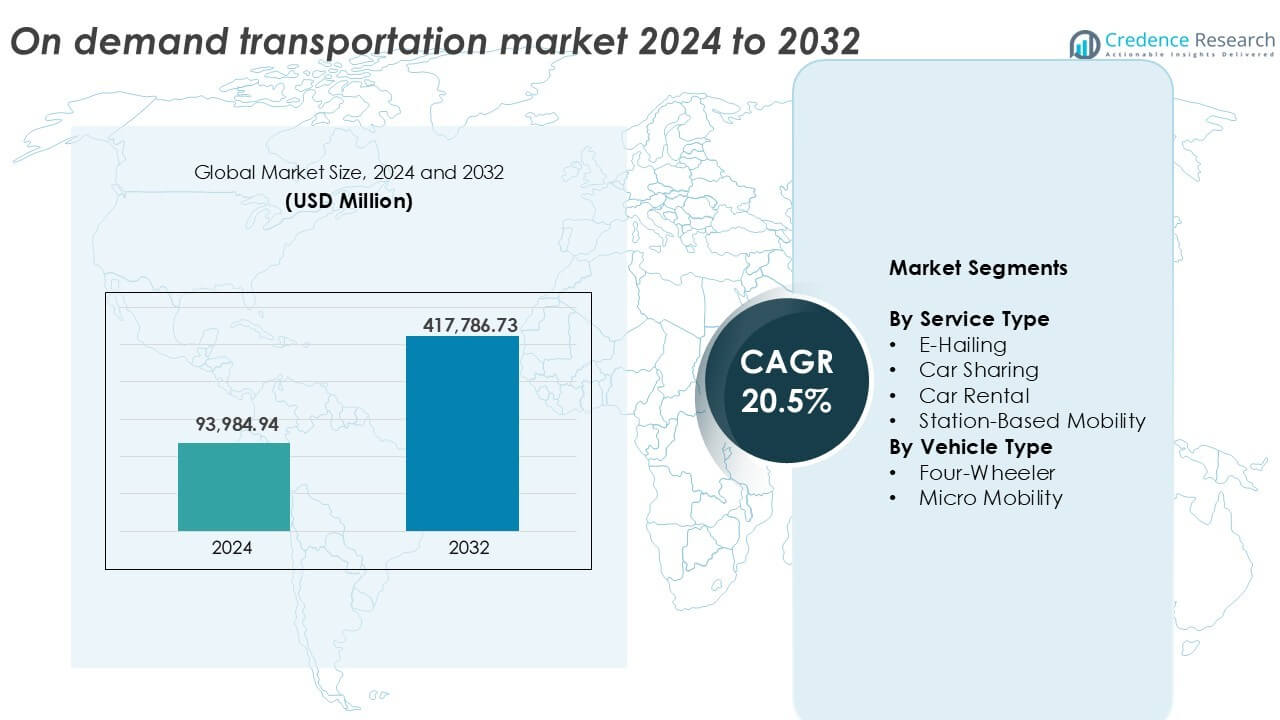
The On-Demand Transportation Market size was valued at USD 93,984.94 million in 2024 and is anticipated to reach USD 417,786.73 million by 2032, at a CAGR of 20.5% during the forecast period.
| REPORT ATTRIBUTE |
DETAILS |
| Historical Period |
2020-2023 |
| Base Year |
2024 |
| Forecast Period |
2025-2032 |
| On-Demand Transportation Market Size 2024 |
USD 93,984.94 million |
| On-Demand Transportation Market, CAGR |
20.5% |
| On-Demand Transportation Market Size 2032 |
USD 417,786.73 million |
Top players in the on-demand transportation market include Uber Technologies Inc., Lyft Inc., Grab, Careem and NI Technologies Pvt. Ltd. (Ola), alongside automakers like BMW Group, Daimler Group, Ford Motor Company and General Motors Co., which are expanding into mobility services. Tech companies such as IBM and Robert Bosch GmbH support backend innovations, while regional operators like Gett, Taxify OÜ, BlaBlaCar and Wingz Inc. provide niche solutions. Asia-Pacific led the market in 2024, commanding over 35% market share, driven by high smartphone usage, dense urban populations and strong regional players. North America followed with 30%, supported by established platforms and electric vehicle integration.
On-Demand Transportation Market Insights
- The on-demand transportation market was valued at USD93.98 billion in 2024 and is projected to reach USD417.79 billion by 2032, growing at a CAGR of 20.5%.
- Market growth is fueled by rising smartphone penetration, real-time GPS access and demand for flexible, low-cost urban mobility solutions.
- Key trends include expansion of electric and autonomous vehicle fleets, AI-powered route optimization and rising preference for subscription-based and micro-mobility services.
- Competition remains strong, with leading players such as Uber, Lyft, Grab, Ola and Careem investing in regional expansion, fleet upgrades and partnerships; traditional automakers are also entering the space with digital mobility offerings.
- Asia-Pacific leads the market with a 35% share, followed by North America at 30% and Europe at 25%; e-hailing dominates by service type with over 60% share, while four-wheelers lead the vehicle type segment with over 85% share globally.
Access crucial information at unmatched prices!
Request your sample report today & start making informed decisions powered by Credence Research Inc.!
Download Sample
On-Demand Transportation Market Segmentation Analysis
By service type
E-hailing dominated the on-demand transportation market, accounting for over 60% of total market share in 2024. Its dominance stems from wide smartphone adoption, app-based platforms and urban consumer preference for real-time ride availability. The convenience of digital payments, GPS integration and driver ratings further strengthens user engagement. Car sharing holds the second-largest share due to its appeal among environmentally conscious urban users seeking cost-effective short trips. Station-based mobility and car rental continue to grow but at a slower pace, limited by fixed infrastructure needs and less flexible service delivery.
- Uber completed more than 9.4 billion trips globally in 2023. The platform supports operations across more than 70 countries. Uber’s app processes millions of ride requests per hour at peak demand.
By vehicle type
Four-wheelers led the market with over 85% share in 2024, driven by their widespread availability, comfort and ability to support ride-hailing and rentals for long and mid-range distances. Growing urbanization and rising disposable incomes also fuel demand for four-wheeler services across cities. Micro-mobility, though a smaller segment, is rapidly expanding due to increasing adoption of electric scooters and bikes for short intra-city commutes. Rising congestion and low operational costs support micro-mobility growth, especially in densely populated urban zones.
- Lime operates approximately 250,000 shared electric scooters and bikes across roughly 280 cities in about 30 countries. As of Oct. 2025, Lime has completed over one billion rides globally.
Key growth drivers
Smartphone penetration and app-based mobility
Widespread smartphone use and high-speed mobile internet have significantly transformed personal mobility habits. App-based ride-hailing services such as Uber, Lyft and Ola have become mainstream due to ease of access, real-time tracking and digital payment integration. This mobile-first convenience has lowered entry barriers for users while increasing engagement frequency. Service providers benefit from scalable platforms, personalized offers and location-based marketing. Urban dwellers, especially in Tier 1 and Tier 2 cities, prefer app-driven models for daily commuting. As smartphone penetration reaches rural and semi-urban areas, the market scope expands further, driving steady growth across emerging regions.
- Uber reported over 131 million monthly active platform users globally in 2023. The Uber app processes millions of GPS location updates every second to optimize matching.
Growing urbanization and traffic congestion
Rapid urbanization has increased population density in cities, leading to rising congestion and limited parking infrastructure. On-demand transportation offers an efficient solution by reducing private car ownership and optimizing road usage through shared mobility. E-hailing and micro-mobility options help manage urban flow while reducing the environmental footprint. City governments also promote ride-sharing and EV-based fleets to reduce vehicle count and emissions. Tech-driven dispatch systems ensure faster routing, while predictive analytics improve fleet distribution. As cities adopt smart infrastructure, integration with multimodal transport systems will further enhance the value of on-demand services.
- Ola operates in over 250 Indian cities with app-based ride services. The platform manages millions of daily ride requests during peak hours.
Shifting consumer preferences toward flexible mobility
Consumers today prioritize flexibility, convenience and cost-efficiency over traditional ownership. This behavioral shift, driven by millennials and Gen Z, fuels demand for on-demand transportation models. Car ownership is declining in many urban centers due to high maintenance costs, limited parking and environmental awareness. Users prefer to pay per use, enabling spontaneous travel without long-term commitments. Micro-mobility, subscription-based rentals and pay-as-you-go models align well with this mindset. Demand for flexible solutions during peak hours, weekends and events also drives innovation in fleet management and dynamic pricing strategies.
Key trends and opportunities
Rising integration of electric and autonomous vehicles
The integration of electric vehicles into on-demand fleets is accelerating due to government incentives and sustainability mandates. EV-based ride-sharing reduces operating costs and aligns with environmental, social and governance goals. Companies are also testing autonomous vehicles for safer, more efficient urban mobility. Autonomous fleets can cut labor costs and enhance around-the-clock availability. Integration with AI-powered platforms enables predictive maintenance, route optimization and energy management. Cities supporting smart mobility pilots provide growth opportunities for EV and autonomous vehicle providers in the transportation-as-a-service space.
- Uber has over 200,000 electric vehicles active on its platform globally. Uber drivers completed over 136 million zero-emission trips globally in Q3 2025.
Increasing adoption of subscription and corporate mobility solutions
Corporate clients are adopting tailored on-demand mobility solutions for employee transport and logistics needs. Subscription-based models offer predictable pricing and operational ease for enterprises. Large organizations prefer centralized billing, fleet tracking and service-level agreements for safety and compliance. Startups and small and midsize businesses benefit from scalable mobility plans without long-term leasing. Vendors offer bundled services including dedicated vehicles, off-peak discounts and real-time support. With hybrid work models and flexible office hours, demand for customized mobility continues to grow, especially in metros and tech hubs.
Key challenges
Data privacy and regulatory compliance
Stringent regulations around data privacy, safety and labor rights create operational complexity. Governments mandate GPS tracking, background checks and insurance for service providers. Compliance adds cost burdens for startups and small aggregators. Data protection laws also affect how ride-hailing platforms collect and process user data. Non-compliance can result in fines, service bans or legal disputes. Labor classification of drivers as contractors or employees remains contentious in many markets. Some regions require minimum wage, social benefits and unionization rights for gig workers, which increases fixed costs.
Infrastructure limitations and uneven connectivity
On-demand transportation relies on stable mobile networks, road quality and charging and fueling infrastructure. In many developing regions, poor road conditions, traffic bottlenecks and weak digital connectivity hinder service reliability. Micro-mobility adoption is constrained by a lack of safe lanes and dedicated parking zones. EV adoption suffers in areas with limited charging stations. Remote or peri-urban areas face availability issues due to low driver density and poor return on investment for service providers. Addressing these deficits requires long-term public-private collaboration and infrastructure upgrades.
Regional analysis
North America
North America held a market share of over 30% in 2024, making it a leading region in the on-demand transportation market. The U.S. drives most demand, backed by early adoption of ride-hailing apps, a large urban population and a strong digital ecosystem. High smartphone penetration, cashless payments and regulatory frameworks support steady growth. Uber and Lyft dominate with wide coverage across cities and suburbs. Expansion of EV fleets and government support for shared mobility further strengthen North America’s market position.
Europe
Europe accounted for around 25% market share in 2024, with strong presence in Germany, the United Kingdom and France. Strict environmental regulations and urban mobility policies have pushed demand for shared and electric vehicles. Consumers increasingly prefer ride-sharing and micro-mobility solutions in dense urban centers. The presence of firms like Bolt, Free Now and BlaBlaCar adds to market diversity. Integration with public transport systems supports intermodal use cases. Labor law constraints and regulatory complexities in some countries continue to affect operational flexibility.
Asia-Pacific
Asia-Pacific captured over 35% of global market share in 2024, leading the on-demand transportation space. China and India are major contributors, driven by population density, smartphone proliferation and government support for app-based mobility. Ride-hailing companies Didi, Grab and Ola dominate large urban areas. Strong demand comes from both metro and Tier 2 cities due to traffic congestion and limited parking infrastructure. The region also sees rapid growth in EV-based fleets and AI-enabled logistics platforms.
Latin America
Latin America held approximately 5% market share in 2024, with Brazil and Mexico emerging as key growth markets. High urbanization rates and traffic congestion fuel adoption of on-demand transportation services. Apps like Cabify and 99 have gained strong traction in major cities. Inconsistent infrastructure and weak regulatory enforcement pose challenges. Localized pricing models and cash payment options help improve user adoption. Growing investor interest and digital inclusion programs indicate significant future potential.
Middle East and Africa
The Middle East and Africa region contributed around 3% to global market share in 2024, with the UAE, Saudi Arabia and South Africa leading in adoption. Urban development and smart city projects like NEOM and Dubai Smart City fuel growth in ride-hailing and EV-ready fleets. Careem, now part of Uber, leads regional operations. Despite infrastructure limitations in some African nations, mobile penetration and app usage are growing steadily. The region shows long-term promise, especially in affluent urban zones and high-tourism areas.
On-Demand Transportation Market Segmentations:
By Service Type
- E-Hailing
- Car Sharing
- Car Rental
- Station-Based Mobility
By Vehicle Type
- Four-Wheeler
- Micro Mobility
By Geography
- North America
- Europe
- Germany
- France
- U.K.
- Italy
- Spain
- Rest of Europe
- Asia Pacific
- China
- Japan
- India
- South Korea
- South-east Asia
- Rest of Asia Pacific
- Latin America
- Brazil
- Argentina
- Rest of Latin America
- Middle East & Africa
- GCC Countries
- South Africa
- Rest of the Middle East and Africa
Competitive Landscape
The on-demand transportation market features intense competition among global ride-hailing companies, automakers and mobility tech firms. Uber, Lyft, Grab and Ola dominate ride-hailing services through widespread app-based platforms and strong regional presence. Traditional automakers such as Ford, BMW, Daimler and General Motors are investing in mobility subsidiaries and EV-based services to enter the digital mobility space. Startups like BlaBlaCar, Careem and Gett focus on niche offerings such as carpooling, corporate travel and regional ride-hailing. Tech providers including IBM and Robert Bosch GmbH support backend infrastructure, data analytics and fleet management systems. Market players are expanding through partnerships, acquisitions and geographic diversification to capture new user bases. Competition also intensifies around AI integration, electric vehicle deployment and dynamic pricing models. With growing regulatory oversight and evolving customer expectations, companies must balance scalability, compliance and innovation to sustain leadership.
Shape Your Report to Specific Countries or Regions & Enjoy 30% Off!
Key Player Analysis
- Lyft Inc.
- Ford Motor Company
- NI Technologies Pvt. Ltd. (Ola)
- Careem
- Wingz Inc.
- Robert Bosch GmbH
- BMW Group
- Uber Technologies Inc.
- Grab
- Daimler Group
- General Motors Co.
- Curb Mobility
- Taxify OÜ
- International Business Machines Corporation (IBM)
- Gett Inc.
- BlaBlaCar
Recent developments
- In Dec. 2024, Longmont launched RIDE Longmont, a new on-demand transit service focused on improving local transportation. The service offers rides at $2 per trip with accessible vehicle options. The city aims to reduce traffic congestion and improve resident mobility.
- In Nov. 2024, San Francisco launched an on-demand shuttle service in the Bayview-Hunters Point neighborhood. The electric van fleet includes specially designed wheelchair accessibility.
- In Sept. 2024, Waymo and Uber announced an expansion of their partnership to introduce autonomous ride-hailing services in Atlanta and Austin. The collaboration integrates Waymo’s self-driving technology into Uber’s platform, enhancing autonomous ride availability in both cities.
Report coverage
The research report offers an in-depth analysis based on service type, vehicle type and geography. It details leading market players, providing an overview of their business, product offerings, investments, revenue streams and key applications. The report also includes insights into the competitive environment, SWOT analysis, current market trends, and primary drivers and constraints. It examines market dynamics, regulatory scenarios and technological advancements shaping the industry, and provides strategic recommendations for new entrants and established companies.
Future outlook
- The market will continue to expand rapidly with growing urban populations and digital mobility adoption.
- E-hailing services will dominate due to their ease of use and real-time availability.
- Electric vehicles will become a core part of ride-hailing fleets to meet emission targets.
- Integration of autonomous vehicles will reshape service models and lower operational costs.
- AI and data analytics will enhance fleet efficiency and customer experience.
- Micro-mobility solutions will gain share in dense urban zones with short-trip demand.
- Subscription-based and corporate mobility services will see increased uptake.
- Emerging markets in Asia-Pacific and Latin America will drive new user growth.
- Regulatory reforms will affect driver classification, safety standards and data privacy.
- Partnerships between automakers, tech firms and service providers will shape future competitiveness.


