Table of Content
CHAPTER NO. 1 : INTRODUCTION……………………………………………………………….. 53
1.1.1. Report Description ………………………………………………………………………………………….. 53
Purpose of the Report………………………………………………………………………………………. 53
USP & Key Offerings…………………………………………………………………………………………. 53
1.1.2. Key Benefits for Stakeholders……………………………………………………………………………. 53
1.1.3. Target Audience ……………………………………………………………………………………………… 54
1.1.4. Report Scope 54
1.1.5. Regional Scope ……………………………………………………………………………………………….. 55
CHAPTER NO. 2 : EXECUTIVE SUMMARY………………………………………………………. 56
2.1. Oral Iron Supplements Market Snapshot ……………………………………………………………. 56
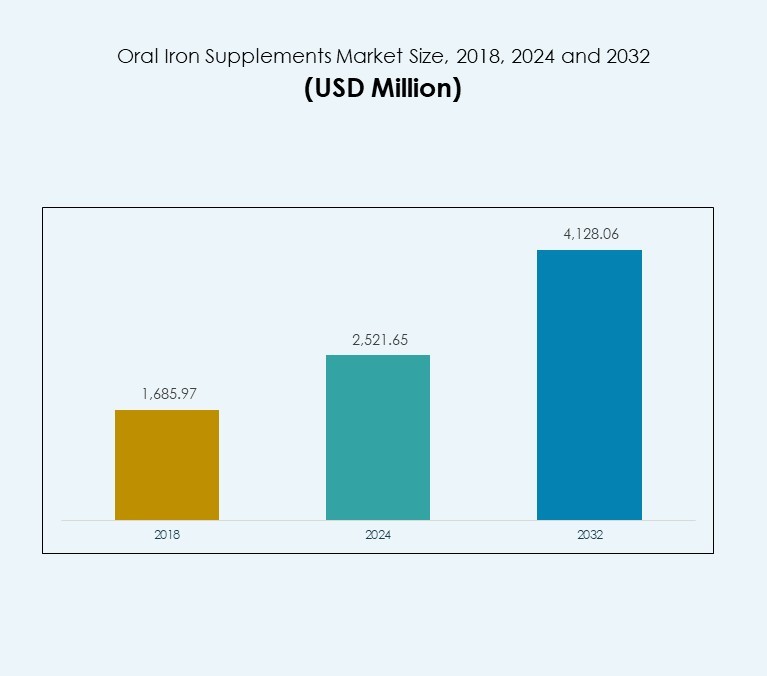
2.1.1. Global Oral Iron Supplements Market, 2018 – 2032 (USD Million)…………………………… 58
CHAPTER NO. 3 : GEOPOLITICAL CRISIS IMPACT ANALYSIS………………………………. 59
3.1. Russia-Ukraine and Israel-Palestine War Impacts…………………………………………………. 59
CHAPTER NO. 4 : ORAL IRON SUPPLEMENTS MARKET – INDUSTRY ANALYSIS …….. 61
4.1. Introduction 61
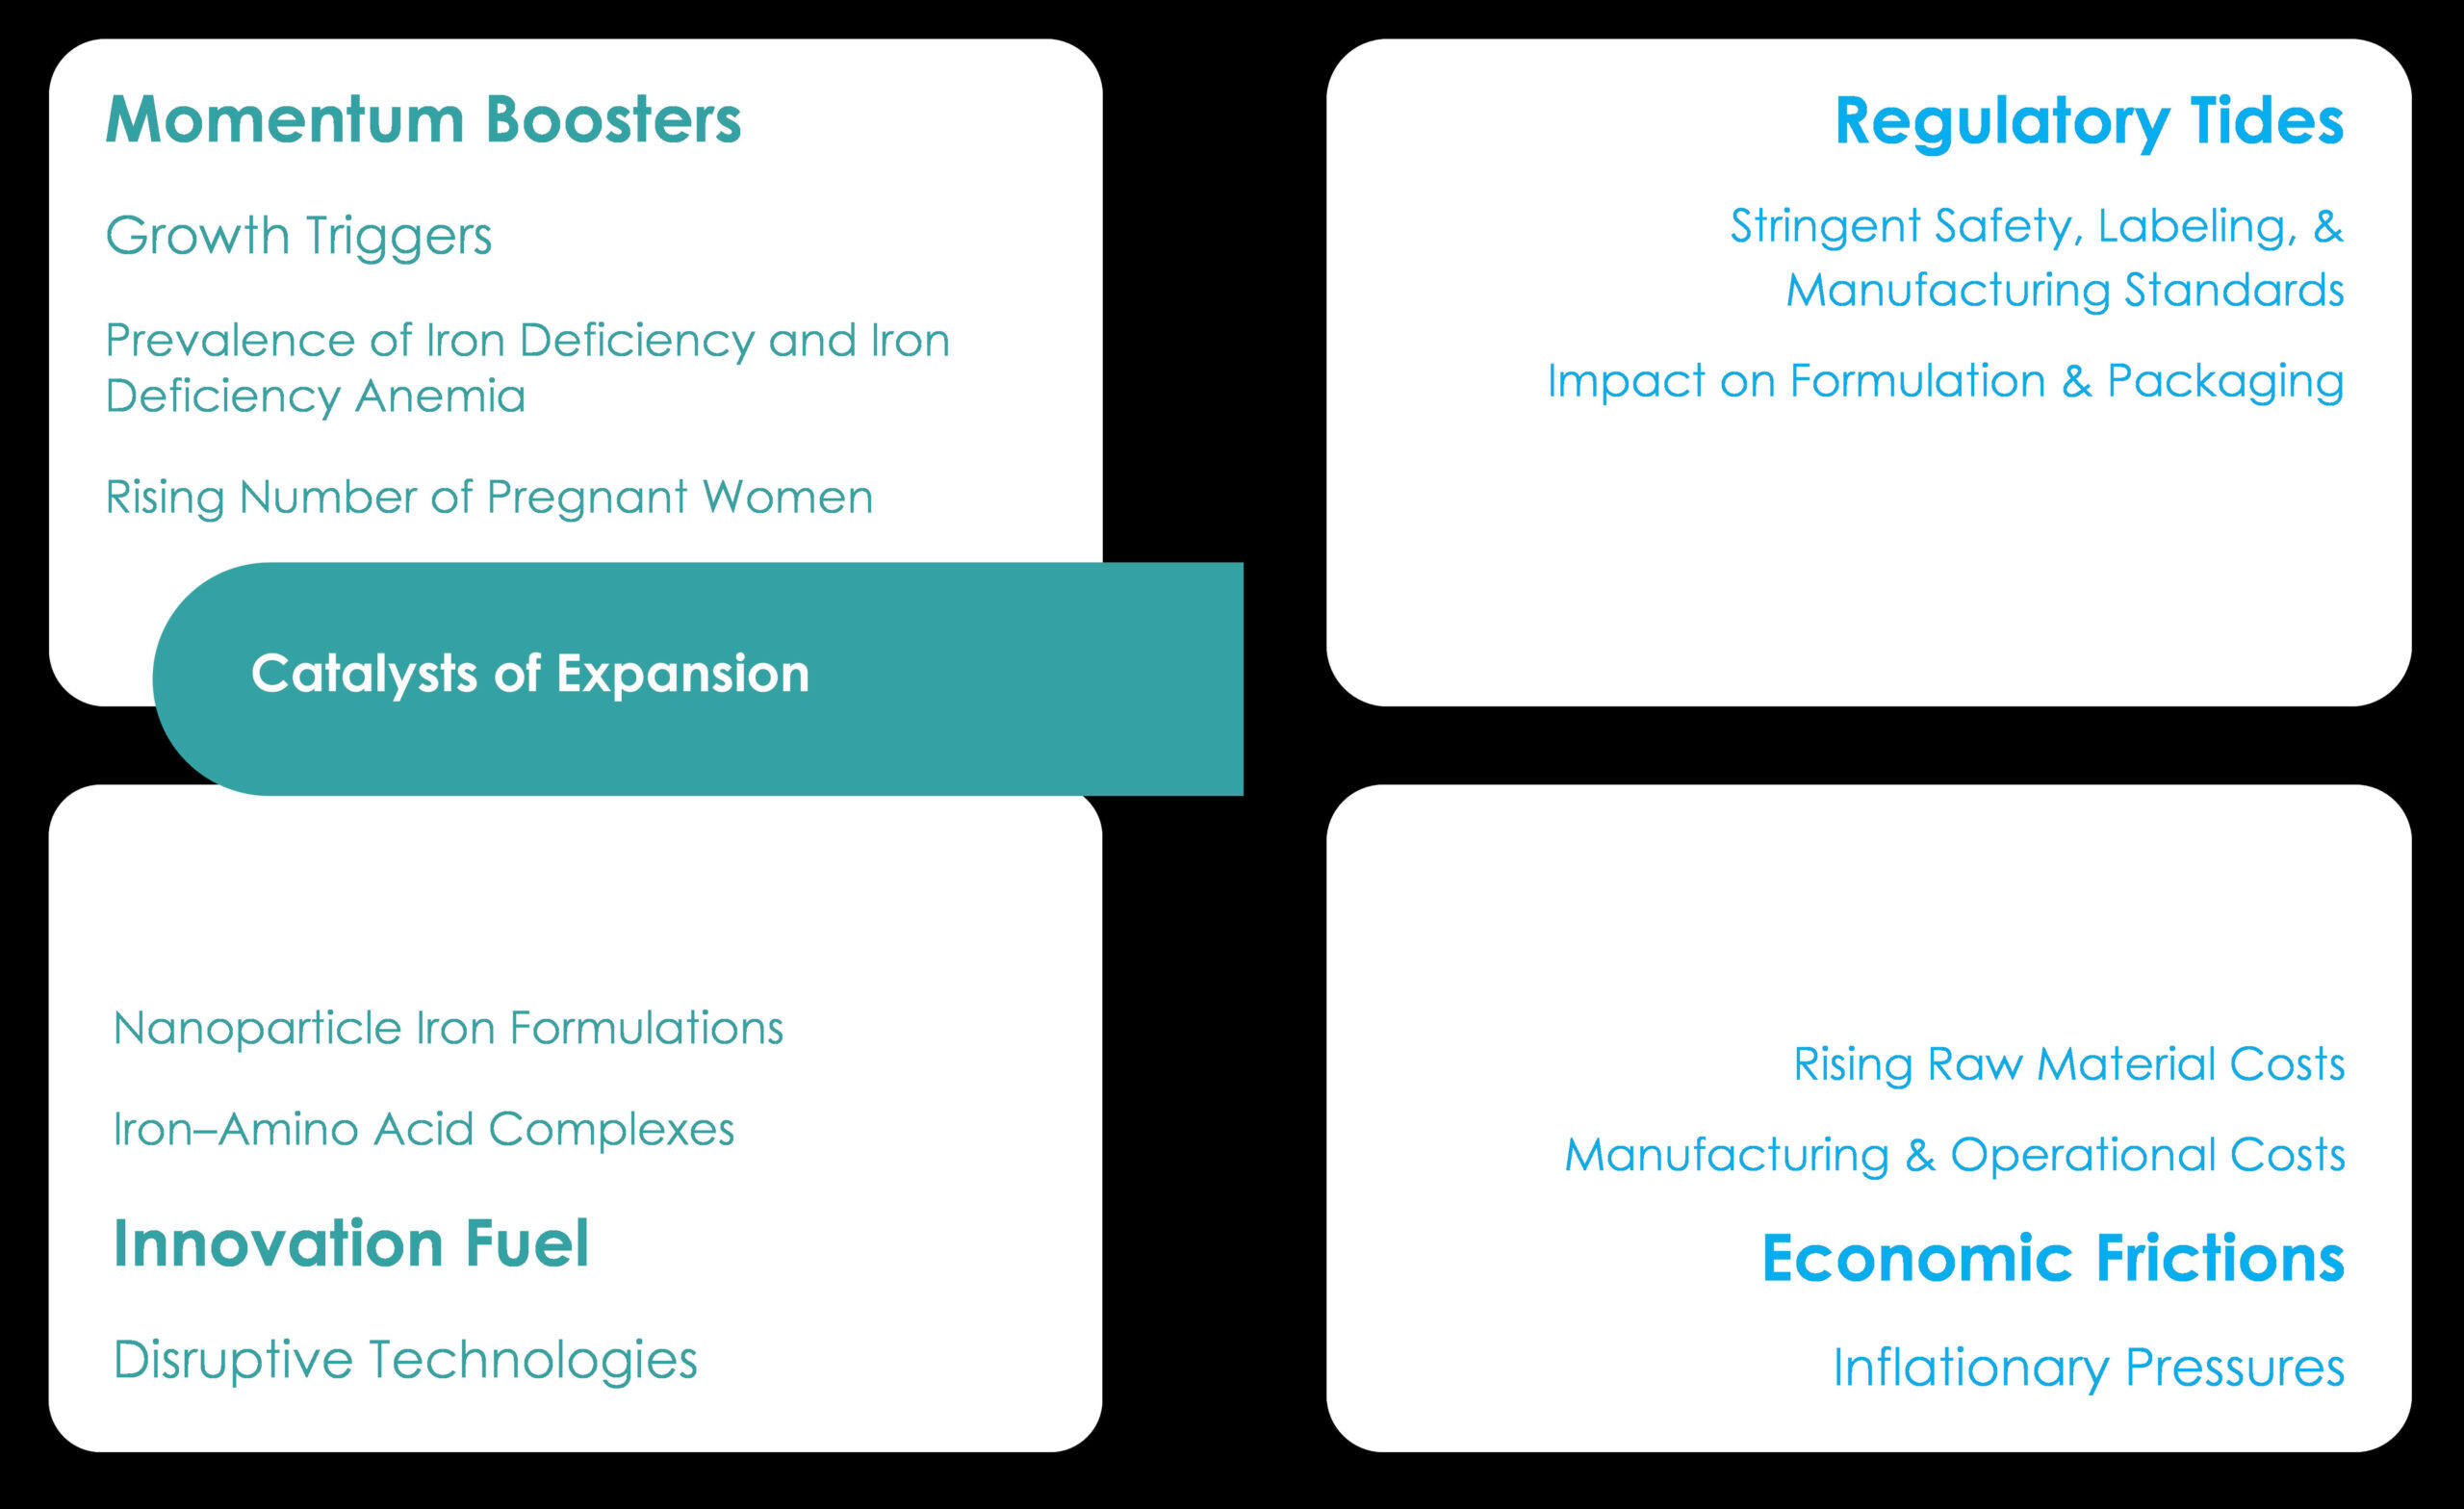
4.2. Market Drivers……………………………………………………………………………………………….. 63
4.2.1. Prevalence of Iron Deficiency and Iron Deficiency Anemia…………………………………….. 63
4.2.2. Rising Number of Pregnant Women …………………………………………………………………… 64
4.2.3. Growing Awareness and Government Initiatives …………………………………………………. 66
4.3. Market Restraints……………………………………………………………………………………………. 68
4.3.1. Competition from Alternative Iron Sources…………………………………………………………. 68
4.3.2. Regulatory and Pricing Challenges……………………………………………………………………… 69
4.3.3. Low Bioavailability and Absorption Issues…………………………………………………………… 70
4.4. Market Opportunities………………………………………………………………………………………. 72
4.4.1. Market Opportunity Analysis ……………………………………………………………………………. 72
4.5. Porter’s Five Forces Analysis……………………………………………………………………………… 74
CHAPTER NO. 5 : ANALYSIS COMPETITIVE LANDSCAPE …………………………………… 75
5.1. Company Market Share Analysis – 2024……………………………………………………………… 75
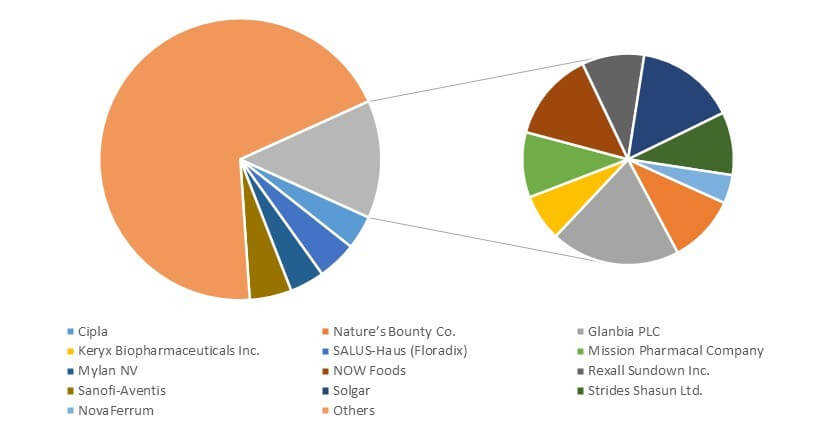
5.1.1. Global Oral Iron Supplements Market: Company Market Share, by Revenue, 2024…… 75
11 | P a g e
GLOBAL ORAL IRON SUPPLEMENTS MARKET, 2018 – 2032
5.1.2. Global Oral Iron Supplements Market: Top 6 Company Market Share, by Revenue, 2024
76
5.1.3. Global Oral Iron Supplements Market: Top 3 Company Market Share, by Revenue, 2024
77
5.2. U.S. Company Market Share Analysis – 2024……………………………………………………….. 78
5.2.1. U.S. Oral Iron Supplements Market: Company Market Share, by Revenue, 2024………. 78
5.2.1. U.S. Oral Iron Supplements Market: Company Market Share, by Revenue, 2024………. 79
5.3. Canada Company Market Share Analysis – 2024………………………………………………….. 80
5.3.1. Canada Oral Iron Supplements Market: Company Market Share, by Revenue, 2024 …. 80
5.3.2. Canada Oral Iron Supplements Market: Company Market Share, by Revenue, 2024 …. 81
5.4. UK Company Market Share Analysis – 2024 ………………………………………………………… 82
5.4.1. UK Oral Iron Supplements Market: Company Market Share, by Revenue, 2024 ……….. 82
5.4.2. UK Oral Iron Supplements Market: Company Market Share, by Revenue, 2024 ……….. 83
5.5. France Company Market Share Analysis – 2024 …………………………………………………… 84
5.5.1. France Oral Iron Supplements Market: Company Market Share, by Revenue, 2024 ….. 84
5.5.2. France Oral Iron Supplements Market: Company Market Share, by Revenue, 2024 ….. 85
5.6. Germany Company Market Share Analysis – 2024 ……………………………………………….. 86
5.6.1. Germany Oral Iron Supplements Market: Company Market Share, by Revenue, 2024 . 86
5.6.2. Germany Oral Iron Supplements Market: Company Market Share, by Revenue, 2024 . 87
5.7. Italy Company Market Share Analysis – 2024………………………………………………………. 88
5.7.1. Italy Oral Iron Supplements Market: Company Market Share, by Revenue, 2024……… 88
5.7.2. Italy Oral Iron Supplements Market: Company Market Share, by Revenue, 2024……… 89
5.8. Spain Company Market Share Analysis – 2024 …………………………………………………….. 90
5.8.1. Spain Oral Iron Supplements Market: Company Market Share, by Revenue, 2024 ……. 90
5.8.2. Spain Oral Iron Supplements Market: Company Market Share, by Revenue, 2024 ……. 91
5.9. China Company Market Share Analysis – 2024…………………………………………………….. 92
5.9.1. China Oral Iron Supplements Market: Company Market Share, by Revenue, 2024……. 92
5.9.2. U.S. Oral Iron Supplements Market: Company Market Share, by Revenue, 2024………. 93
5.10. Japan Company Market Share Analysis – 2024…………………………………………………….. 94
5.10.1.Japan Oral Iron Supplements Market: Company Market Share, by Revenue, 2024……. 94
5.10.2.Japan Oral Iron Supplements Market: Company Market Share, by Revenue, 2024……. 95
5.11. India Company Market Share Analysis – 2024……………………………………………………… 96
5.11.1.India Oral Iron Supplements Market: Company Market Share, by Revenue, 2024 …….. 96
5.11.2.India Oral Iron Supplements Market: Company Market Share, by Revenue, 2024…….. 97
5.12. Global Oral Iron Supplements Market Company Revenue Market Share, 2024 ………… 98
5.13. Strategic Developments…………………………………………………………………………………… 99
12 | P a g e
GLOBAL ORAL IRON SUPPLEMENTS MARKET, 2018 – 2032
5.14. Key Players Product Matrix …………………………………………………………………………….. 101
CHAPTER NO. 6 : PESTEL ANALYSIS……………………………………………………………. 105
6.1. PESTEL 105
6.1.1. Political Factors…………………………………………………………………………………………….. 105
6.1.2. Economic Factors…………………………………………………………………………………………… 105
6.1.3. Social Factors 105
6.1.4. Technological Factors…………………………………………………………………………………….. 106
6.1.5. Environmental Factors……………………………………………………………………………………. 106
6.1.6. Legal Factors 106
CHAPTER NO. 7 : ORAL IRON SUPPLEMENTS MARKET – BY TYPE SEGMENT ANALYSIS
…………………………………………………………………………………… 107
7.1. Oral Iron Supplements Market Overview, by Type Segment………………………………… 107
7.1.1. Oral Iron Supplements Market Revenue Share, By Type, 2023 & 2032 ………………….. 108
7.1.2. Oral Iron Supplements Market Attractiveness Analysis, By Type ………………………….. 109
7.1.3. Incremental Revenue Growth Opportunity, by Type, 2024 – 2032…………………………. 110
7.1.4. Oral Iron Supplements Market Revenue, By Type, 2018, 2023, 2027 & 2032 ………….. 111
7.2. Ferrous Sulfate ……………………………………………………………………………………………… 112
7.3. Ferrous Gluconate …………………………………………………………………………………………. 113
7.4. Ferric Pyrophosphate …………………………………………………………………………………….. 114
7.5. Ferrous Fumarate ………………………………………………………………………………………….. 115
7.6. Others 116
CHAPTER NO. 8 : ORAL IRON SUPPLEMENTS MARKET – BY FORM SEGMENT
ANALYSIS ……………………………………………………………………… 117
8.1. Oral Iron Supplements Market Overview, by Form Segment ……………………………….. 117
8.1.1. Oral Iron Supplements Market Revenue Share, By Form, 2023 & 2032………………….. 118
8.1.2. Oral Iron Supplements Market Attractiveness Analysis, By Form………………………….. 119
8.1.3. Incremental Revenue Growth Opportunity, by Form, 2024 – 2032………………………… 120
8.1.4. Oral Iron Supplements Market Revenue, By Form, 2018, 2023, 2027 & 2032………….. 121
8.2. Tablet 122
8.3. Liquid 123
8.4. Capsules 124
8.5. Powders 125
8.6. Others 126
13 | P a g e
GLOBAL ORAL IRON SUPPLEMENTS MARKET, 2018 – 2032
CHAPTER NO. 9 : ORAL IRON SUPPLEMENTS MARKET – BY APPLICATION SEGMENT
ANALYSIS ……………………………………………………………………… 127
9.1. Oral Iron Supplements Market Overview, by Application Segment……………………….. 127
9.1.1. Oral Iron Supplements Market Revenue Share, By Application, 2023 & 2032…………. 128
9.1.2. Oral Iron Supplements Market Attractiveness Analysis, By Application…………………. 129
9.1.3. Incremental Revenue Growth Opportunity, by Application, 2024 – 2032 ……………….. 130
9.1.4. Oral Iron Supplements Market Revenue, By Application, 2018, 2023, 2027 & 2032…. 131
9.2. Anaemia Treatment……………………………………………………………………………………….. 132
9.3. Iron Deficiency Prevention ……………………………………………………………………………… 133
9.4. Sports Nutrition…………………………………………………………………………………………….. 134
9.5. Pregnancy Supplements…………………………………………………………………………………. 135
9.6. Others 136
CHAPTER NO. 10 : ORAL IRON SUPPLEMENTS MARKET – BY SALES CHANNEL
SEGMENT ANALYSIS ……………………………………………………….. 137
10.1. Oral Iron Supplements Market Overview, by Sales Channel Segment……………………. 137
10.1.1.Oral Iron Supplements Market Revenue Share, By Sales Channel, 2023 & 2032 ……… 138
10.1.2.Oral Iron Supplements Market Attractiveness Analysis, By Sales Channel ……………… 139
10.1.3.Incremental Revenue Growth Opportunity, by Sales Channel, 2024 – 2032 ……………. 140
10.1.4.Oral Iron Supplements Market Revenue, By Sales Channel, 2018, 2023, 2027 & 2032 141
10.2. Pharmacies and Drugstores…………………………………………………………………………….. 142
10.3. Supermarkets and Hypermarkets…………………………………………………………………….. 143
10.4. Online Retailers…………………………………………………………………………………………….. 144
10.5. Others 145
CHAPTER NO. 11 : ORAL IRON SUPPLEMENTS MARKET – BY AGE GROUP SEGMENT
ANALYSIS ……………………………………………………………………… 146
11.1. Oral Iron Supplements Market Overview, by Age Group Segment………………………… 146
11.1.1.Oral Iron Supplements Market Revenue Share, By Age Group, 2023 & 2032 ………….. 147
11.1.2.Oral Iron Supplements Market Attractiveness Analysis, By Age Group ………………….. 148
11.1.3.Incremental Revenue Growth Opportunity, by Age Group, 2024 – 2032 ………………… 149
11.1.4.Oral Iron Supplements Market Revenue, By Age Group, 2018, 2023, 2027 & 2032….. 150
11.2. Infants: 0 to 12 months………………………………………………………………………………….. 151
11.3. Toddlers: 1 to 3 years…………………………………………………………………………………….. 152
11.4. Children: 4 to 8 years……………………………………………………………………………………… 153
11.5. Pre-adolescents: 9 to 12 years…………………………………………………………………………. 154
14 | P a g e
GLOBAL ORAL IRON SUPPLEMENTS MARKET, 2018 – 2032
11.6. Adolescents: 13 to 18 years…………………………………………………………………………….. 155
11.7. Young Adults: 19 to 30 years…………………………………………………………………………… 156
11.8. Adults: 31 to 45 years…………………………………………………………………………………….. 157
11.9. Middle-Aged Adults: 46 to 64 years………………………………………………………………….. 158
11.10. Elderly / Seniors: 65 years and older………………………………………………………………… 159
CHAPTER NO. 12 : ORAL IRON SUPPLEMENTS MARKET – REGIONAL ANALYSIS …… 160
12.1. Oral Iron Supplements Market Overview, by Regional Segments …………………………. 160
12.2. Region 162
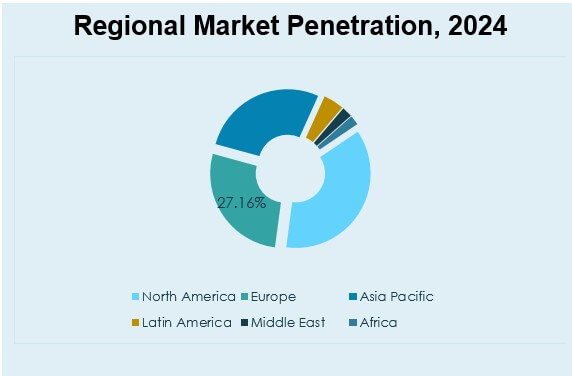
12.2.1.Global Oral Iron Supplements Market Revenue Share, By Region, 2023 & 2032 ……… 162
12.2.2.Oral Iron Supplements Market Attractiveness Analysis, By Region……………………….. 163
12.2.3.Incremental Revenue Growth Opportunity, by Region, 2024 – 2032 ……………………… 164
12.2.4.Oral Iron Supplements Market Revenue, By Region, 2018, 2023, 2027 & 2032……….. 165
12.2.5.Global Oral Iron Supplements Market Revenue, By Region, 2018 – 2023 (USD Million)166
12.2.6.Global Oral Iron Supplements Market Revenue, By Region, 2024 – 2032 (USD Million)166
12.3. Type 167
12.3.1.Global Oral Iron Supplements Market Revenue, By Type, 2018 – 2024 (USD Million).. 167
12.3.2.Global Oral Iron Supplements Market Revenue, By Type, 2025 – 2032 (USD Million).. 167
12.4. Application 168
12.4.1.Global Oral Iron Supplements Market Revenue, By Application, 2018 – 2024 (USD
Million) 168
12.4.2.Global Oral Iron Supplements Market Revenue, By Application, 2025 – 2032 (USD
Million) 168
12.5. Form 169
12.5.1.Global Oral Iron Supplements Market Revenue, By Form, 2018 – 2024 (USD Million). 169
12.5.2.Global Oral Iron Supplements Market Revenue, By Form, 2025 – 2032 (USD Million). 169
12.6. Age Group 170
12.6.1.Global Oral Iron Supplements Market Revenue, By Age Group, 2018 – 2024 (USD Million)
170
12.6.2.Global Oral Iron Supplements Market Revenue, By Age Group, 2025 – 2032 (USD Million)
171
12.7. Sales Channel 172
12.7.1.Global Oral Iron Supplements Market Revenue, By Sales Channel, 2018 – 2024 (USD
Million) 172
12.7.2.Global Oral Iron Supplements Market Revenue, By Sales Channel, 2025 – 2032 (USD
Million) 172
CHAPTER NO. 13 : ORAL IRON SUPPLEMENTS MARKET – NORTH AMERICA ……….. 173
15 | P a g e
GLOBAL ORAL IRON SUPPLEMENTS MARKET, 2018 – 2032
13.1. North America173
13.1.1.Key Highlights 173
13.1.2.North America Oral Iron Supplements Market Revenue, By Country, 2018 – 2024 (USD
Million) 174
13.1.3.North America Oral Iron Supplements Market Revenue, By Type, 2018 – 2024 (USD
Million) 175
13.1.4.North America Oral Iron Supplements Market Revenue, By Application, 2018 – 2024
(USD Million) 176
13.1.5.North America Oral Iron Supplements Market Revenue, By Form, 2018 – 2024 (USD
Million) 177
13.1.6.North America Oral Iron Supplements Market Revenue, By Age Group, 2018 – 2024 (USD
Million) 178
13.1.7.North America Oral Iron Supplements Market Revenue, By Sales Channel, 2018 – 2024
(USD Million) 180
13.2. U.S. 181
13.2.1.U.S. Oral Iron Supplements Market Revenue, By Type, 2018 – 2024 (USD Million)…… 181
13.2.2.U.S. Oral Iron Supplements Market Revenue, By Application, 2018 – 2024 (USD Million)
182
13.2.3.U.S. Oral Iron Supplements Market Revenue, By Form, 2018 – 2024 (USD Million)….. 183
13.2.4.U.S. Oral Iron Supplements Market Revenue, By Age Group, 2018 – 2024 (USD Million)
184
13.2.5.U.S. Oral Iron Supplements Market Revenue, By Sales Channel, 2018 – 2024 (USD
Million) 186
13.3. Canada 187
13.3.1.Canada Oral Iron Supplements Market Revenue, By Type, 2018 – 2024 (USD Million) 187
13.3.2.Canada Oral Iron Supplements Market Revenue, By Application, 2018 – 2024 (USD
Million) 188
13.3.3.Canada Oral Iron Supplements Market Revenue, By Form, 2018 – 2024 (USD Million) 189
13.3.4.Canada Oral Iron Supplements Market Revenue, By Age Group, 2018 – 2024 (USD
Million) 190
13.3.5.Canada Oral Iron Supplements Market Revenue, By Sales Channel, 2018 – 2024 (USD
Million) 192
13.4. Mexico 193
13.4.1.Mexico Oral Iron Supplements Market Revenue, By Type, 2018 – 2024 (USD Million) 193
13.4.2.Mexico Oral Iron Supplements Market Revenue, By Application, 2018 – 2024 (USD
Million) 194
13.4.3.Mexico Oral Iron Supplements Market Revenue, By Form, 2018 – 2024 (USD Million) 195
13.4.4.Mexico Oral Iron Supplements Market Revenue, By Age Group, 2018 – 2024 (USD
Million) 196
16 | P a g e
GLOBAL ORAL IRON SUPPLEMENTS MARKET, 2018 – 2032
13.4.5.Mexico Oral Iron Supplements Market Revenue, By Sales Channel, 2018 – 2024 (USD
Million) 198
CHAPTER NO. 14 : ORAL IRON SUPPLEMENTS MARKET – EUROPE ……………………. 199
14.1. Europe 199
14.1.1.Key Highlights 199
14.1.2.Europe Oral Iron Supplements Market Revenue, By Country, 2018 – 2024 (USD Million)
200
14.1.3.Europe Oral Iron Supplements Market Revenue, By Type, 2018 – 2024 (USD Million). 201
14.1.4.Europe Oral Iron Supplements Market Revenue, By Application, 2018 – 2024 (USD
Million) 202
14.1.5.Europe Oral Iron Supplements Market Revenue, By Form, 2018 – 2024 (USD Million) 203
14.1.6.Europe Oral Iron Supplements Market Revenue, By Age Group, 2018 – 2024 (USD
Million) 204
14.1.7.Europe Oral Iron Supplements Market Revenue, By Sales Channel, 2018 – 2024 (USD
Million) 206
14.2. UK 207
14.2.1.UK Oral Iron Supplements Market Revenue, By Type, 2018 – 2024 (USD Million) ……. 207
14.2.2.UK Oral Iron Supplements Market Revenue, By Application, 2018 – 2024 (USD Million)
208
14.2.3.UK Oral Iron Supplements Market Revenue, By Form, 2018 – 2024 (USD Million)……. 209
14.2.4.UK Oral Iron Supplements Market Revenue, By Age Group, 2018 – 2024 (USD Million)210
14.2.5.UK Oral Iron Supplements Market Revenue, By Sales Channel, 2018 – 2024 (USD Million)
212
14.3. France 213
14.3.1.France Oral Iron Supplements Market Revenue, By Type, 2018 – 2024 (USD Million) . 213
14.3.2.France Oral Iron Supplements Market Revenue, By Application, 2018 – 2024 (USD
Million) 214
14.3.3.France Oral Iron Supplements Market Revenue, By Form, 2018 – 2024 (USD Million). 215
14.3.4.France Oral Iron Supplements Market Revenue, By Age Group, 2018 – 2024 (USD Million)
216
14.3.5.France Oral Iron Supplements Market Revenue, By Sales Channel, 2018 – 2024 (USD
Million) 218
14.4. Germany 219
14.4.1.Germany Oral Iron Supplements Market Revenue, By Type, 2018 – 2024 (USD Million)
219
14.4.2.Germany Oral Iron Supplements Market Revenue, By Application, 2018 – 2024 (USD
Million) 220
14.4.3.Germany Oral Iron Supplements Market Revenue, By Form, 2018 – 2024 (USD Million)
221
17 | P a g e
GLOBAL ORAL IRON SUPPLEMENTS MARKET, 2018 – 2032
14.4.4.Germany Oral Iron Supplements Market Revenue, By Age Group, 2018 – 2024 (USD
Million) 222
14.4.5.Germany Oral Iron Supplements Market Revenue, By Sales Channel, 2018 – 2024 (USD
Million) 224
14.5. Italy 225
14.5.1.Italy Oral Iron Supplements Market Revenue, By Type, 2018 – 2024 (USD Million)….. 225
14.5.2.Italy Oral Iron Supplements Market Revenue, By Application, 2018 – 2024 (USD Million)
226
14.5.3.Italy Oral Iron Supplements Market Revenue, By Form, 2018 – 2024 (USD Million) …. 227
14.5.4.Italy Oral Iron Supplements Market Revenue, By Age Group, 2018 – 2024 (USD Million)
228
14.5.5.Italy Oral Iron Supplements Market Revenue, By Sales Channel, 2018 – 2024 (USD
Million) 230
14.6. Spain 231
14.6.1.Spain Oral Iron Supplements Market Revenue, By Type, 2018 – 2024 (USD Million) … 231
14.6.2.Spain Oral Iron Supplements Market Revenue, By Application, 2018 – 2024 (USD Million)
232
14.6.3.Spain Oral Iron Supplements Market Revenue, By Form, 2018 – 2024 (USD Million)… 233
14.6.4.Spain Oral Iron Supplements Market Revenue, By Age Group, 2018 – 2024 (USD Million)
234
14.6.5.Spain Oral Iron Supplements Market Revenue, By Sales Channel, 2018 – 2024 (USD
Million) 236
14.7. Russia 237
14.7.1.Russia Oral Iron Supplements Market Revenue, By Type, 2018 – 2024 (USD Million).. 237
14.7.2.Russia Oral Iron Supplements Market Revenue, By Application, 2018 – 2024 (USD
Million) 238
14.7.3.Russia Oral Iron Supplements Market Revenue, By Form, 2018 – 2024 (USD Million) . 239
14.7.4.Russia Oral Iron Supplements Market Revenue, By Age Group, 2018 – 2024 (USD Million)
240
14.7.5.Russia Oral Iron Supplements Market Revenue, By Sales Channel, 2018 – 2024 (USD
Million) 242
14.8. Belgium 243
14.8.1.Belgium Oral Iron Supplements Market Revenue, By Type, 2018 – 2024 (USD Million)243
14.8.2.Belgium Oral Iron Supplements Market Revenue, By Application, 2018 – 2024 (USD
Million) 244
14.8.3.Belgium Oral Iron Supplements Market Revenue, By Form, 2018 – 2024 (USD Million)245
14.8.4.Belgium Oral Iron Supplements Market Revenue, By Age Group, 2018 – 2024 (USD
Million) 246
14.8.5.Belgium Oral Iron Supplements Market Revenue, By Sales Channel, 2018 – 2024 (USD
Million) 248
18 | P a g e
GLOBAL ORAL IRON SUPPLEMENTS MARKET, 2018 – 2032
14.9. Netherland 249
14.9.1.Netherland Oral Iron Supplements Market Revenue, By Type, 2018 – 2024 (USD Million)
249
14.9.2.Netherland Oral Iron Supplements Market Revenue, By Application, 2018 – 2024 (USD
Million) 250
14.9.3.Netherland Oral Iron Supplements Market Revenue, By Form, 2018 – 2024 (USD Million)
251
14.9.4.Netherland Oral Iron Supplements Market Revenue, By Age Group, 2018 – 2024 (USD
Million) 252
14.9.5.Netherland Oral Iron Supplements Market Revenue, By Sales Channel, 2018 – 2024 (USD
Million) 254
14.10. Austria 255
14.10.1. Austria Oral Iron Supplements Market Revenue, By Type, 2018 – 2024
(USD Million) 255
14.10.2. Austria Oral Iron Supplements Market Revenue, By Application, 2018 –
2024 (USD Million)…………………………………………………………………………………………. 256
14.10.3. Austria Oral Iron Supplements Market Revenue, By Form, 2018 – 2024
(USD Million) 257
14.10.4. Austria Oral Iron Supplements Market Revenue, By Age Group, 2018 –
2024 (USD Million)…………………………………………………………………………………………. 258
14.10.5. Austria Oral Iron Supplements Market Revenue, By Sales Channel, 2018 –
2024 (USD Million)…………………………………………………………………………………………. 260
14.11. Sweden 261
14.11.1. Sweden Oral Iron Supplements Market Revenue, By Type, 2018 – 2024
(USD Million) 261
14.11.2. Sweden Oral Iron Supplements Market Revenue, By Application, 2018 –
2024 (USD Million)…………………………………………………………………………………………. 262
14.11.3. Sweden Oral Iron Supplements Market Revenue, By Form, 2018 – 2024
(USD Million) 263
14.11.4. Sweden Oral Iron Supplements Market Revenue, By Age Group, 2018 –
2024 (USD Million)…………………………………………………………………………………………. 264
14.11.5. Sweden Oral Iron Supplements Market Revenue, By Sales Channel, 2018 –
2024 (USD Million)…………………………………………………………………………………………. 266
14.12. Poland 267
14.12.1. Poland Oral Iron Supplements Market Revenue, By Type, 2018 – 2024
(USD Million) 267
14.12.2. Poland Oral Iron Supplements Market Revenue, By Application, 2018 –
2024 (USD Million)…………………………………………………………………………………………. 268
14.12.3. Poland Oral Iron Supplements Market Revenue, By Form, 2018 – 2024
(USD Million) 269
14.12.4. Poland Oral Iron Supplements Market Revenue, By Age Group, 2018 –
2024 (USD Million)…………………………………………………………………………………………. 270
19 | P a g e
GLOBAL ORAL IRON SUPPLEMENTS MARKET, 2018 – 2032
14.12.5. Poland Oral Iron Supplements Market Revenue, By Sales Channel, 2018 –
2024 (USD Million)…………………………………………………………………………………………. 272
14.13. Denmark 273
14.13.1. Denmark Oral Iron Supplements Market Revenue, By Type, 2018 – 2024
(USD Million) 273
14.13.2. Denmark Oral Iron Supplements Market Revenue, By Application, 2018 –
2024 (USD Million)…………………………………………………………………………………………. 274
14.13.3. Denmark Oral Iron Supplements Market Revenue, By Form, 2018 – 2024
(USD Million) 275
14.13.4. Denmark Oral Iron Supplements Market Revenue, By Age Group, 2018 –
2024 (USD Million)…………………………………………………………………………………………. 276
14.13.5. Denmark Oral Iron Supplements Market Revenue, By Sales Channel, 2018
– 2024 (USD Million)……………………………………………………………………………………….. 278
14.14. Switzerland 279
14.14.1. Switzerland Oral Iron Supplements Market Revenue, By Type, 2018 – 2024
(USD Million) 279
14.14.2. Switzerland Oral Iron Supplements Market Revenue, By Application, 2018
– 2024 (USD Million)……………………………………………………………………………………….. 280
14.14.3. Switzerland Oral Iron Supplements Market Revenue, By Form, 2018 –
2024 (USD Million)…………………………………………………………………………………………. 281
14.14.4. Switzerland Oral Iron Supplements Market Revenue, By Age Group, 2018
– 2024 (USD Million)……………………………………………………………………………………….. 282
14.14.5. Switzerland Oral Iron Supplements Market Revenue, By Sales Channel,
2018 – 2024 (USD Million)……………………………………………………………………………….. 284
14.15. Rest of Europe285
14.15.1. Rest of Europe Oral Iron Supplements Market Revenue, By Type, 2018 –
2024 (USD Million)…………………………………………………………………………………………. 285
14.15.2. Rest of Europe Oral Iron Supplements Market Revenue, By Application,
2018 – 2024 (USD Million)……………………………………………………………………………….. 286
14.15.3. Rest of Europe Oral Iron Supplements Market Revenue, By Form, 2018 –
2024 (USD Million)…………………………………………………………………………………………. 287
14.15.4. Rest of Europe Oral Iron Supplements Market Revenue, By Age Group,
2018 – 2024 (USD Million)……………………………………………………………………………….. 288
14.15.5. Rest of Europe Oral Iron Supplements Market Revenue, By Sales Channel,
2018 – 2024 (USD Million)……………………………………………………………………………….. 290
CHAPTER NO. 15 : ORAL IRON SUPPLEMENTS MARKET – ASIA PACIFIC ……………… 291
15.1. Asia Pacific 291
15.1.1.Key Highlights 291
15.1.2.Asia Pacific Oral Iron Supplements Market Revenue, By Country, 2018 – 2024 (USD
Million) 292
20 | P a g e
GLOBAL ORAL IRON SUPPLEMENTS MARKET, 2018 – 2032
15.1.3.Asia Pacific Oral Iron Supplements Market Revenue, By Type, 2018 – 2024 (USD Million)
293
15.1.4.Asia Pacific Oral Iron Supplements Market Revenue, By Application, 2018 – 2024 (USD
Million) 294
15.1.5.Asia Pacific Oral Iron Supplements Market Revenue, By Form, 2018 – 2024 (USD Million)
295
15.1.6.Asia Pacific Oral Iron Supplements Market Revenue, By Age Group, 2018 – 2024 (USD
Million) 296
15.1.7.Asia Pacific Oral Iron Supplements Market Revenue, By Sales Channel, 2018 – 2024 (USD
Million) 298
15.2. China 299
15.2.1.China Oral Iron Supplements Market Revenue, By Type, 2018 – 2024 (USD Million)… 299
15.2.2.China Oral Iron Supplements Market Revenue, By Application, 2018 – 2024 (USD Million)
300
15.2.3.China Oral Iron Supplements Market Revenue, By Form, 2018 – 2024 (USD Million) .. 301
15.2.4.China Oral Iron Supplements Market Revenue, By Age Group, 2018 – 2024 (USD Million)
302
15.2.5.China Oral Iron Supplements Market Revenue, By Sales Channel, 2018 – 2024 (USD
Million) 304
15.3. Japan 305
15.3.1.Japan Oral Iron Supplements Market Revenue, By Type, 2018 – 2024 (USD Million)… 305
15.3.2.Japan Oral Iron Supplements Market Revenue, By Application, 2018 – 2024 (USD Million)
306
15.3.3.Japan Oral Iron Supplements Market Revenue, By Form, 2018 – 2024 (USD Million).. 307
15.3.4.Japan Oral Iron Supplements Market Revenue, By Age Group, 2018 – 2024 (USD Million)
308
15.3.5.Japan Oral Iron Supplements Market Revenue, By Sales Channel, 2018 – 2024 (USD
Million) 310
15.4. South Korea 311
15.4.1.South Korea Oral Iron Supplements Market Revenue, By Type, 2018 – 2024 (USD Million)
311
15.4.2.South Korea Oral Iron Supplements Market Revenue, By Application, 2018 – 2024 (USD
Million) 312
15.4.3.South Korea Oral Iron Supplements Market Revenue, By Form, 2018 – 2024 (USD Million)
313
15.4.4.South Korea Oral Iron Supplements Market Revenue, By Age Group, 2018 – 2024 (USD
Million) 314
15.4.5.South Korea Oral Iron Supplements Market Revenue, By Sales Channel, 2018 – 2024
(USD Million) 316
15.5. India 317
15.5.1.India Oral Iron Supplements Market Revenue, By Type, 2018 – 2024 (USD Million)…. 317
21 | P a g e
GLOBAL ORAL IRON SUPPLEMENTS MARKET, 2018 – 2032
15.5.2.India Oral Iron Supplements Market Revenue, By Application, 2018 – 2024 (USD Million)
318
15.5.3.India Oral Iron Supplements Market Revenue, By Form, 2018 – 2024 (USD Million) … 319
15.5.4.India Oral Iron Supplements Market Revenue, By Age Group, 2018 – 2024 (USD Million)
320
15.5.5.India Oral Iron Supplements Market Revenue, By Sales Channel, 2018 – 2024 (USD
Million) 322
15.6. Australia 323
15.6.1.Australia Oral Iron Supplements Market Revenue, By Type, 2018 – 2024 (USD Million)323
15.6.2.Australia Oral Iron Supplements Market Revenue, By Application, 2018 – 2024 (USD
Million) 324
15.6.3.Australia Oral Iron Supplements Market Revenue, By Form, 2018 – 2024 (USD Million)
325
15.6.4.Australia Oral Iron Supplements Market Revenue, By Age Group, 2018 – 2024 (USD
Million) 326
15.6.5.Australia Oral Iron Supplements Market Revenue, By Sales Channel, 2018 – 2024 (USD
Million) 328
15.7. Thailand 329
15.7.1.Thailand Oral Iron Supplements Market Revenue, By Type, 2018 – 2024 (USD Million)329
15.7.2.Thailand Oral Iron Supplements Market Revenue, By Application, 2018 – 2024 (USD
Million) 330
15.7.3.Thailand Oral Iron Supplements Market Revenue, By Form, 2018 – 2024 (USD Million)331
15.7.4.Thailand Oral Iron Supplements Market Revenue, By Age Group, 2018 – 2024 (USD
Million) 332
15.7.5.Thailand Oral Iron Supplements Market Revenue, By Sales Channel, 2018 – 2024 (USD
Million) 334
15.8. Indonesia 335
15.8.1.Indonesia Oral Iron Supplements Market Revenue, By Type, 2018 – 2024 (USD Million)
335
15.8.2.Indonesia Oral Iron Supplements Market Revenue, By Application, 2018 – 2024 (USD
Million) 336
15.8.3.Indonesia Oral Iron Supplements Market Revenue, By Form, 2018 – 2024 (USD Million)
337
15.8.4.Indonesia Oral Iron Supplements Market Revenue, By Age Group, 2018 – 2024 (USD
Million) 338
15.8.5.Indonesia Oral Iron Supplements Market Revenue, By Sales Channel, 2018 – 2024 (USD
Million) 340
15.9. Vietnam 341
15.9.1.Vietnam Oral Iron Supplements Market Revenue, By Type, 2018 – 2024 (USD Million)341
15.9.2.Vietnam Oral Iron Supplements Market Revenue, By Application, 2018 – 2024 (USD
Million) 342
22 | P a g e
GLOBAL ORAL IRON SUPPLEMENTS MARKET, 2018 – 2032
15.9.3.Vietnam Oral Iron Supplements Market Revenue, By Form, 2018 – 2024 (USD Million)343
15.9.4.Vietnam Oral Iron Supplements Market Revenue, By Age Group, 2018 – 2024 (USD
Million) 344
15.9.5.Vietnam Oral Iron Supplements Market Revenue, By Sales Channel, 2018 – 2024 (USD
Million) 346
15.10. Malaysia 347
15.10.1. Malaysia Oral Iron Supplements Market Revenue, By Type, 2018 – 2024
(USD Million) 347
15.10.2. Malaysia Oral Iron Supplements Market Revenue, By Application, 2018 –
2024 (USD Million)…………………………………………………………………………………………. 348
15.10.3. Malaysia Oral Iron Supplements Market Revenue, By Form, 2018 – 2024
(USD Million) 349
15.10.4. Malaysia Oral Iron Supplements Market Revenue, By Age Group, 2018 –
2024 (USD Million)…………………………………………………………………………………………. 350
15.10.5. Malaysia Oral Iron Supplements Market Revenue, By Sales Channel, 2018
– 2024 (USD Million)……………………………………………………………………………………….. 352
15.11. Philippines 353
15.11.1. Philippines Oral Iron Supplements Market Revenue, By Type, 2018 – 2024
(USD Million) 353
15.11.2. Philippines Oral Iron Supplements Market Revenue, By Application, 2018
– 2024 (USD Million)……………………………………………………………………………………….. 354
15.11.3. Philippines Oral Iron Supplements Market Revenue, By Form, 2018 – 2024
(USD Million) 355
15.11.4. Philippines Oral Iron Supplements Market Revenue, By Age Group, 2018 –
2024 (USD Million)…………………………………………………………………………………………. 356
15.11.5. Philippines Oral Iron Supplements Market Revenue, By Sales Channel,
2018 – 2024 (USD Million)……………………………………………………………………………….. 358
15.12. Taiwan 359
15.12.1. Taiwan Oral Iron Supplements Market Revenue, By Type, 2018 – 2024
(USD Million) 359
15.12.2. Taiwan Oral Iron Supplements Market Revenue, By Application, 2018 –
2024 (USD Million)…………………………………………………………………………………………. 360
15.12.3. Taiwan Oral Iron Supplements Market Revenue, By Form, 2018 – 2024
(USD Million) 361
15.12.4. Taiwan Oral Iron Supplements Market Revenue, By Age Group, 2018 –
2024 (USD Million)…………………………………………………………………………………………. 362
15.12.5. Taiwan Oral Iron Supplements Market Revenue, By Sales Channel, 2018 –
2024 (USD Million)…………………………………………………………………………………………. 364
15.13. Rest of Asia Pacific…………………………………………………………………………………………. 365
15.13.1. Rest of Asia Pacific Oral Iron Supplements Market Revenue, By Type,
2018 – 2024 (USD Million)……………………………………………………………………………….. 365
23 | P a g e
GLOBAL ORAL IRON SUPPLEMENTS MARKET, 2018 – 2032
15.13.2. Rest of Asia Pacific Oral Iron Supplements Market Revenue, By
Application, 2018 – 2024 (USD Million)……………………………………………………………… 366
15.13.3. Rest of Asia Pacific Oral Iron Supplements Market Revenue, By Form,
2018 – 2024 (USD Million)……………………………………………………………………………….. 367
15.13.4. Rest of Asia Pacific Oral Iron Supplements Market Revenue, By Age
Group, 2018 – 2024 (USD Million)…………………………………………………………………….. 368
15.13.5. Rest of Asia Pacific Oral Iron Supplements Market Revenue, By Sales
Channel, 2018 – 2024 (USD Million)………………………………………………………………….. 370
CHAPTER NO. 16 : ORAL IRON SUPPLEMENTS MARKET – LATIN AMERICA………….. 371
16.1. Latin America 371
16.1.1.Key Highlights 371
16.1.2.Latin America Oral Iron Supplements Market Revenue, By Country, 2018 – 2024 (USD
Million) 372
16.1.3.Latin America Oral Iron Supplements Market Revenue, By Type, 2018 – 2024 (USD
Million) 373
16.1.4.Latin America Oral Iron Supplements Market Revenue, By Application, 2018 – 2024 (USD
Million) 374
16.1.5.Latin America Oral Iron Supplements Market Revenue, By Form, 2018 – 2024 (USD
Million) 375
16.1.6.Latin America Oral Iron Supplements Market Revenue, By Age Group, 2018 – 2024 (USD
Million) 376
16.1.7.Latin America Oral Iron Supplements Market Revenue, By Sales Channel, 2018 – 2024
(USD Million) 378
16.2. Brazil 379
16.2.1.Brazil Oral Iron Supplements Market Revenue, By Type, 2018 – 2024 (USD Million) … 379
16.2.2.Brazil Oral Iron Supplements Market Revenue, By Application, 2018 – 2024 (USD Million)
380
16.2.3.Brazil Oral Iron Supplements Market Revenue, By Form, 2018 – 2024 (USD Million)… 381
16.2.4.Brazil Oral Iron Supplements Market Revenue, By Age Group, 2018 – 2024 (USD Million)
382
16.2.5.Brazil Oral Iron Supplements Market Revenue, By Sales Channel, 2018 – 2024 (USD
Million) 384
16.3. Argentina 385
16.3.1.Argentina Oral Iron Supplements Market Revenue, By Type, 2018 – 2024 (USD Million)
385
16.3.2.Argentina Oral Iron Supplements Market Revenue, By Application, 2018 – 2024 (USD
Million) 386
16.3.3.Argentina Oral Iron Supplements Market Revenue, By Form, 2018 – 2024 (USD Million)
387
24 | P a g e
GLOBAL ORAL IRON SUPPLEMENTS MARKET, 2018 – 2032
16.3.4.Argentina Oral Iron Supplements Market Revenue, By Age Group, 2018 – 2024 (USD
Million) 388
16.3.5.Argentina Oral Iron Supplements Market Revenue, By Sales Channel, 2018 – 2024 (USD
Million) 390
16.4. Peru 391
16.4.1.Peru Oral Iron Supplements Market Revenue, By Type, 2018 – 2024 (USD Million)….. 391
16.4.2.Peru Oral Iron Supplements Market Revenue, By Application, 2018 – 2024 (USD Million)
392
16.4.3.Peru Oral Iron Supplements Market Revenue, By Form, 2018 – 2024 (USD Million)…. 393
16.4.4.Peru Oral Iron Supplements Market Revenue, By Age Group, 2018 – 2024 (USD Million)
394
16.4.5.Peru Oral Iron Supplements Market Revenue, By Sales Channel, 2018 – 2024 (USD
Million) 396
16.5. Chile 397
16.5.1.Chile Oral Iron Supplements Market Revenue, By Type, 2018 – 2024 (USD Million)…. 397
16.5.2.Chile Oral Iron Supplements Market Revenue, By Application, 2018 – 2024 (USD Million)
398
16.5.3.Chile Oral Iron Supplements Market Revenue, By Form, 2018 – 2024 (USD Million) … 399
16.5.4.Chile Oral Iron Supplements Market Revenue, By Age Group, 2018 – 2024 (USD Million)
400
16.5.5.Chile Oral Iron Supplements Market Revenue, By Sales Channel, 2018 – 2024 (USD
Million) 402
16.6. Colombia 403
16.6.1.Colombia Oral Iron Supplements Market Revenue, By Type, 2018 – 2024 (USD Million)
403
16.6.2.Colombia Oral Iron Supplements Market Revenue, By Application, 2018 – 2024 (USD
Million) 404
16.6.3.Colombia Oral Iron Supplements Market Revenue, By Form, 2018 – 2024 (USD Million)
405
16.6.4.Colombia Oral Iron Supplements Market Revenue, By Age Group, 2018 – 2024 (USD
Million) 406
16.6.5.Colombia Oral Iron Supplements Market Revenue, By Sales Channel, 2018 – 2024 (USD
Million) 408
16.7. Rest of Latin America……………………………………………………………………………………… 409
16.7.1.Rest of Latin America Oral Iron Supplements Market Revenue, By Type, 2018 – 2024
(USD Million) 409
16.7.2.Rest of Latin America Oral Iron Supplements Market Revenue, By Application, 2018 –
2024 (USD Million)…………………………………………………………………………………………. 410
16.7.3.Rest of Latin America Oral Iron Supplements Market Revenue, By Form, 2018 – 2024
(USD Million) 411
25 | P a g e
GLOBAL ORAL IRON SUPPLEMENTS MARKET, 2018 – 2032
16.7.4.Rest of Latin America Oral Iron Supplements Market Revenue, By Age Group, 2018 –
2024 (USD Million)…………………………………………………………………………………………. 412
16.7.5.Rest of Latin America Oral Iron Supplements Market Revenue, By Sales Channel, 2018 –
2024 (USD Million)…………………………………………………………………………………………. 414
CHAPTER NO. 17 : ORAL IRON SUPPLEMENTS MARKET – MIDDLE EAST …………….. 415
17.1. Middle East 415
17.1.1.Key Highlights 415
17.1.2.Middle East Oral Iron Supplements Market Revenue, By Country, 2018 – 2024 (USD
Million) 416
17.1.3.Middle East Oral Iron Supplements Market Revenue, By Type, 2018 – 2024 (USD Million)
417
17.1.4.Middle East Oral Iron Supplements Market Revenue, By Application, 2018 – 2024 (USD
Million) 418
17.1.5.Middle East Oral Iron Supplements Market Revenue, By Form, 2018 – 2024 (USD Million)
419
17.1.6.Middle East Oral Iron Supplements Market Revenue, By Age Group, 2018 – 2024 (USD
Million) 420
17.1.7.Middle East Oral Iron Supplements Market Revenue, By Sales Channel, 2018 – 2024 (USD
Million) 422
17.2. UAE 423
17.2.1.UAE Oral Iron Supplements Market Revenue, By Type, 2018 – 2024 (USD Million) ….. 423
17.2.2.UAE Oral Iron Supplements Market Revenue, By Application, 2018 – 2024 (USD Million)
424
17.2.3.UAE Oral Iron Supplements Market Revenue, By Form, 2018 – 2024 (USD Million)….. 425
17.2.4.UAE Oral Iron Supplements Market Revenue, By Age Group, 2018 – 2024 (USD Million)
426
17.2.5.UAE Oral Iron Supplements Market Revenue, By Sales Channel, 2018 – 2024 (USD
Million) 428
17.3. KSA 429
17.3.1.KSA Oral Iron Supplements Market Revenue, By Type, 2018 – 2024 (USD Million)…… 429
17.3.2.KSA Oral Iron Supplements Market Revenue, By Application, 2018 – 2024 (USD Million)
430
17.3.3.KSA Oral Iron Supplements Market Revenue, By Form, 2018 – 2024 (USD Million)….. 431
17.3.4.KSA Oral Iron Supplements Market Revenue, By Age Group, 2018 – 2024 (USD Million)
432
17.3.5.KSA Oral Iron Supplements Market Revenue, By Sales Channel, 2018 – 2024 (USD
Million) 434
17.4. Israel 435
17.4.1.Israel Oral Iron Supplements Market Revenue, By Type, 2018 – 2024 (USD Million) … 435
26 | P a g e
GLOBAL ORAL IRON SUPPLEMENTS MARKET, 2018 – 2032
17.4.2.Israel Oral Iron Supplements Market Revenue, By Application, 2018 – 2024 (USD Million)
436
17.4.3.Israel Oral Iron Supplements Market Revenue, By Form, 2018 – 2024 (USD Million)… 437
17.4.4.Israel Oral Iron Supplements Market Revenue, By Age Group, 2018 – 2024 (USD Million)
438
17.4.5.Israel Oral Iron Supplements Market Revenue, By Sales Channel, 2018 – 2024 (USD
Million) 440
17.5. Turkey 441
17.5.1.Turkey Oral Iron Supplements Market Revenue, By Type, 2018 – 2024 (USD Million). 441
17.5.2.Turkey Oral Iron Supplements Market Revenue, By Application, 2018 – 2024 (USD
Million) 442
17.5.3.Turkey Oral Iron Supplements Market Revenue, By Form, 2018 – 2024 (USD Million). 443
17.5.4.Turkey Oral Iron Supplements Market Revenue, By Age Group, 2018 – 2024 (USD Million)
444
17.5.5.Turkey Oral Iron Supplements Market Revenue, By Sales Channel, 2018 – 2024 (USD
Million) 446
17.6. Iran 447
17.6.1.Iran Oral Iron Supplements Market Revenue, By Type, 2018 – 2024 (USD Million)…… 447
17.6.2.Iran Oral Iron Supplements Market Revenue, By Application, 2018 – 2024 (USD Million)
448
17.6.3.Iran Oral Iron Supplements Market Revenue, By Form, 2018 – 2024 (USD Million)….. 449
17.6.4.Iran Oral Iron Supplements Market Revenue, By Age Group, 2018 – 2024 (USD Million)
450
17.6.5.Iran Oral Iron Supplements Market Revenue, By Sales Channel, 2018 – 2024 (USD
Million) 452
17.7. Rest of Middle East………………………………………………………………………………………… 453
17.7.1.Rest of Middle East Oral Iron Supplements Market Revenue, By Type, 2018 – 2024 (USD
Million) 453
17.7.2.Rest of Middle East Oral Iron Supplements Market Revenue, By Application, 2018 – 2024
(USD Million) 454
17.7.3.Rest of Middle East Oral Iron Supplements Market Revenue, By Form, 2018 – 2024 (USD
Million) 455
17.7.4.Rest of Middle East Oral Iron Supplements Market Revenue, By Age Group, 2018 – 2024
(USD Million) 456
17.7.5.Rest of Middle East Oral Iron Supplements Market Revenue, By Sales Channel, 2018 –
2024 (USD Million)…………………………………………………………………………………………. 458
CHAPTER NO. 18 : ORAL IRON SUPPLEMENTS MARKET – AFRICA……………………… 459
18.1. Africa 459
18.1.1.Key Highlights 459
27 | P a g e
GLOBAL ORAL IRON SUPPLEMENTS MARKET, 2018 – 2032
18.1.2.Africa Oral Iron Supplements Market Revenue, By Country, 2018 – 2024 (USD Million)460
18.1.3.Africa Oral Iron Supplements Market Revenue, By Type, 2018 – 2024 (USD Million)… 461
18.1.4.Africa Oral Iron Supplements Market Revenue, By Application, 2018 – 2024 (USD Million)
462
18.1.5.Africa Oral Iron Supplements Market Revenue, By Form, 2018 – 2024 (USD Million).. 463
18.1.6.Africa Oral Iron Supplements Market Revenue, By Age Group, 2018 – 2024 (USD Million)
464
18.1.7.Africa Oral Iron Supplements Market Revenue, By Sales Channel, 2018 – 2024 (USD
Million) 466
18.2. South Africa 467
18.2.1.South Africa Oral Iron Supplements Market Revenue, By Type, 2018 – 2024 (USD Million)
467
18.2.2.South Africa Oral Iron Supplements Market Revenue, By Application, 2018 – 2024 (USD
Million) 468
18.2.3.South Africa Oral Iron Supplements Market Revenue, By Form, 2018 – 2024 (USD Million)
469
18.2.4.South Africa Oral Iron Supplements Market Revenue, By Age Group, 2018 – 2024 (USD
Million) 470
18.2.5.South Africa Oral Iron Supplements Market Revenue, By Sales Channel, 2018 – 2024
(USD Million) 472
18.3. Egypt 473
18.3.1.Egypt Oral Iron Supplements Market Revenue, By Type, 2018 – 2024 (USD Million)… 473
18.3.2.Egypt Oral Iron Supplements Market Revenue, By Application, 2018 – 2024 (USD Million)
474
18.3.3.Egypt Oral Iron Supplements Market Revenue, By Form, 2018 – 2024 (USD Million)… 475
18.3.4.Egypt Oral Iron Supplements Market Revenue, By Age Group, 2018 – 2024 (USD Million)
476
18.3.5.Egypt Oral Iron Supplements Market Revenue, By Sales Channel, 2018 – 2024 (USD
Million) 478
18.4. Nigeria 479
18.4.1.Nigeria Oral Iron Supplements Market Revenue, By Type, 2018 – 2024 (USD Million). 479
18.4.2.Nigeria Oral Iron Supplements Market Revenue, By Application, 2018 – 2024 (USD
Million) 480
18.4.3.Nigeria Oral Iron Supplements Market Revenue, By Form, 2018 – 2024 (USD Million) 481
18.4.4.Nigeria Oral Iron Supplements Market Revenue, By Age Group, 2018 – 2024 (USD
Million) 482
18.4.5.Nigeria Oral Iron Supplements Market Revenue, By Sales Channel, 2018 – 2024 (USD
Million) 484
18.5. Algeria 485
18.5.1.Algeria Oral Iron Supplements Market Revenue, By Type, 2018 – 2024 (USD Million). 485
28 | P a g e
GLOBAL ORAL IRON SUPPLEMENTS MARKET, 2018 – 2032
18.5.2.Algeria Oral Iron Supplements Market Revenue, By Application, 2018 – 2024 (USD
Million) 486
18.5.3.Algeria Oral Iron Supplements Market Revenue, By Form, 2018 – 2024 (USD Million) 487
18.5.4.Algeria Oral Iron Supplements Market Revenue, By Age Group, 2018 – 2024 (USD
Million) 488
18.5.5.Algeria Oral Iron Supplements Market Revenue, By Sales Channel, 2018 – 2024 (USD
Million) 490
18.6. Morocco 491
18.6.1.Morocco Oral Iron Supplements Market Revenue, By Type, 2018 – 2024 (USD Million)491
18.6.2.Morocco Oral Iron Supplements Market Revenue, By Application, 2018 – 2024 (USD
Million) 492
18.6.3.Morocco Oral Iron Supplements Market Revenue, By Form, 2018 – 2024 (USD Million)
493
18.6.4.Morocco Oral Iron Supplements Market Revenue, By Age Group, 2018 – 2024 (USD
Million) 494
18.6.5.Morocco Oral Iron Supplements Market Revenue, By Sales Channel, 2018 – 2024 (USD
Million) 496
18.7. Rest of Africa 497
18.7.1.Rest of Africa Oral Iron Supplements Market Revenue, By Type, 2018 – 2024 (USD
Million) 497
18.7.2.Rest of Africa Oral Iron Supplements Market Revenue, By Application, 2018 – 2024 (USD
Million) 498
18.7.3.Rest of Africa Oral Iron Supplements Market Revenue, By Form, 2018 – 2024 (USD
Million) 499
18.7.4.Rest of Africa Oral Iron Supplements Market Revenue, By Age Group, 2018 – 2024 (USD
Million) 500
18.7.5.Rest of Africa Oral Iron Supplements Market Revenue, By Sales Channel, 2018 – 2024
(USD Million) 502
CHAPTER NO. 19 : COMPANY PROFILES……………………………………………………….. 503
19.1. Cipla 503
19.1.1.Company Overview ……………………………………………………………………………………….. 503
19.1.2.Product Portfolio…………………………………………………………………………………………… 504
19.1.3.Financial Overview………………………………………………………………………………………… 504
19.2. Nature’s Bounty Co………………………………………………………………………………………… 505
19.2.1.Company Overview ……………………………………………………………………………………….. 505
19.2.2.Product Portfolio…………………………………………………………………………………………… 506
19.2.3.Financial Overview………………………………………………………………………………………… 506
19.3. Glanbia PLC 507
19.3.1.Company Overview ……………………………………………………………………………………….. 507
29 | P a g e
GLOBAL ORAL IRON SUPPLEMENTS MARKET, 2018 – 2032
19.3.2.Product Portfolio…………………………………………………………………………………………… 508
19.3.3.Financial Overview………………………………………………………………………………………… 508
19.4. Keryx Biopharmaceuticals Inc………………………………………………………………………….. 509
19.4.1.Company Overview ……………………………………………………………………………………….. 509
19.4.2.Product Portfolio…………………………………………………………………………………………… 510
19.4.3.Financial Overview………………………………………………………………………………………… 510
19.5. SALUS-Haus 511
19.5.1.Company Overview ……………………………………………………………………………………….. 511
19.5.2.Product Portfolio…………………………………………………………………………………………… 512
19.5.3.Financial Overview………………………………………………………………………………………… 512
19.6. Sanofi S.A. 513
19.6.1.Company Overview ……………………………………………………………………………………….. 513
19.6.2.Product Portfolio…………………………………………………………………………………………… 514
19.6.3.Financial Overview………………………………………………………………………………………… 514
19.7. Solgar Inc. 515
19.7.1.Company Overview ……………………………………………………………………………………….. 515
19.7.2.Product Portfolio…………………………………………………………………………………………… 516
19.7.3.Financial Overview………………………………………………………………………………………… 516
19.8. Mission Pharmacal Company…………………………………………………………………………… 517
19.8.1.Company Overview ……………………………………………………………………………………….. 517
19.8.2.Product Portfolio…………………………………………………………………………………………… 518
19.8.3.Financial Overview………………………………………………………………………………………… 518
19.9. Mylan NV 519
19.9.1.Company Overview ……………………………………………………………………………………….. 519
19.9.2.Product Portfolio…………………………………………………………………………………………… 520
19.9.3.Financial Overview………………………………………………………………………………………… 520
19.10. NOW Foods 521
19.10.1. Company Overview…………………………………………………………………… 521
19.10.2. Product Portfolio………………………………………………………………………. 522
19.10.3. Financial Overview……………………………………………………………………. 522
19.11. Rexall Sundown Inc. ………………………………………………………………………………………. 523
19.11.1. Company Overview…………………………………………………………………… 523
19.11.2. Product Portfolio………………………………………………………………………. 524
19.11.3. Financial Overview……………………………………………………………………. 524
19.12. Strides Shasun Ltd. ………………………………………………………………………………………… 525
19.12.1. Company Overview…………………………………………………………………… 525
30 | P a g e
GLOBAL ORAL IRON SUPPLEMENTS MARKET, 2018 – 2032
19.12.2. Product Portfolio………………………………………………………………………. 526
19.12.3. Financial Overview……………………………………………………………………. 526
31 | P a g e
GLOBAL ORAL IRON SUPPLEMENTS MARKET, 2018 – 2032
List of Figures
FIG NO. 1. Global Oral Iron Supplements Market Revenue, 2018 – 2032 (USD Million)………………………58
FIG NO. 2. Porter’s Five Forces Analysis for Global Oral Iron Supplements Market ……………………………74
FIG NO. 3. Company Share Analysis, 2024 ……………………………………………………………………………………75
FIG NO. 4. Company Share Analysis, 2024 ……………………………………………………………………………………76
FIG NO. 5. Company Share Analysis, 2024 ……………………………………………………………………………………77
FIG NO. 6. Company Share Analysis, 2024 ……………………………………………………………………………………78
FIG NO. 7. Company Share Analysis, 2024 ……………………………………………………………………………………80
FIG NO. 8. Company Share Analysis, 2024 ……………………………………………………………………………………82
FIG NO. 9. Company Share Analysis, 2024 ……………………………………………………………………………………84
FIG NO. 10. Company Share Analysis, 2024 ……………………………………………………………………………………86
FIG NO. 11. Company Share Analysis, 2024 ……………………………………………………………………………………88
FIG NO. 12. Company Share Analysis, 2024 ……………………………………………………………………………………90
FIG NO. 13. Company Share Analysis, 2024 ……………………………………………………………………………………92
FIG NO. 14. Company Share Analysis, 2024 ……………………………………………………………………………………94
FIG NO. 15. Company Share Analysis, 2024 ……………………………………………………………………………………96
FIG NO. 16. Oral Iron Supplements Market – Company Revenue Market Share, 2024…………………………98
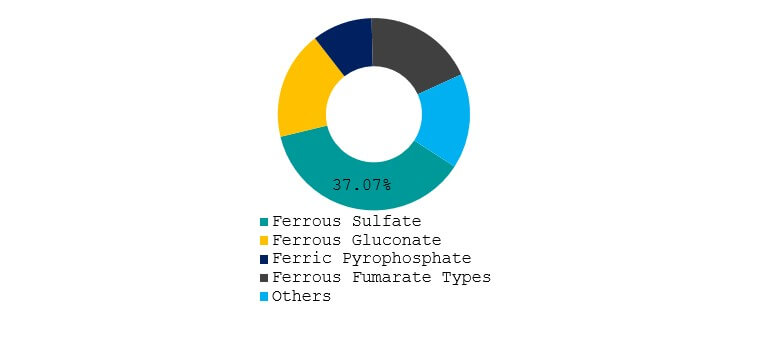
FIG NO. 17. Oral Iron Supplements Market Revenue Share, By Type, 2023 & 2032……………………………108
FIG NO. 18. Market Attractiveness Analysis, By Type …………………………………………………………………….109
FIG NO. 19. Incremental Revenue Growth Opportunity by Type, 2024 – 2032…………………………………..110
FIG NO. 20. Oral Iron Supplements Market Revenue, By Type, 2018, 2023, 2027 & 2032…………………..111
FIG NO. 21. Oral Iron Supplements Market for Ferrous Sulfate, Revenue (USD Million) 2018 – 2032 …..112
FIG NO. 22. Oral Iron Supplements Market for Ferrous Gluconate, Revenue (USD Million) 2018 – 2032 113
FIG NO. 23. Oral Iron Supplements Market for Ferric Pyrophosphate, Revenue (USD Million) 2018 –
2032 ………………………………………………………………………………………………………………………114
FIG NO. 24. Oral Iron Supplements Market for Ferrous Fumarate, Revenue (USD Million) 2018 – 2032 .115
FIG NO. 25. Oral Iron Supplements Market for Others, Revenue (USD Million) 2018 – 2032 ……………….116
FIG NO. 26. Oral Iron Supplements Market Revenue Share, By Form, 2023 & 2032…………………………..118
FIG NO. 27. Market Attractiveness Analysis, By Form…………………………………………………………………….119
FIG NO. 28. Incremental Revenue Growth Opportunity by Form, 2024 – 2032………………………………….120
FIG NO. 29. Oral Iron Supplements Market Revenue, By Form, 2018, 2023, 2027 & 2032 ………………….121
FIG NO. 30. Oral Iron Supplements Market for Tablet, Revenue (USD Million) 2018 – 2032………………..122
FIG NO. 31. Oral Iron Supplements Market for Liquid, Revenue (USD Million) 2018 – 2032 ………………..123
FIG NO. 32. Oral Iron Supplements Market for Capsules, Revenue (USD Million) 2018 – 2032…………….124
FIG NO. 33. Oral Iron Supplements Market for Powders, Revenue (USD Million) 2018 – 2032…………….125
FIG NO. 34. Oral Iron Supplements Market for Others, Revenue (USD Million) 2018 – 2032 ……………….126
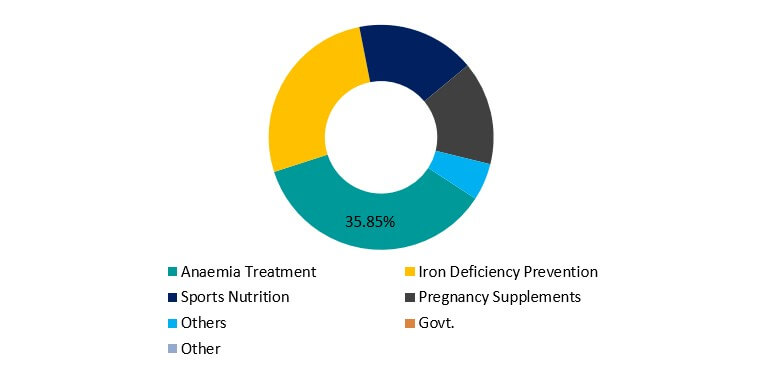
FIG NO. 35. Oral Iron Supplements Market Revenue Share, By Application, 2023 & 2032 ………………….128
FIG NO. 36. Market Attractiveness Analysis, By Application……………………………………………………………129
FIG NO. 37. Incremental Revenue Growth Opportunity by Application, 2024 – 2032 …………………………130
FIG NO. 38. Oral Iron Supplements Market Revenue, By Application, 2018, 2023, 2027 & 2032 …………131
FIG NO. 39. Oral Iron Supplements Market for Anemia Treatment, Revenue (USD Million) 2018 – 2032132
FIG NO. 40. Oral Iron Supplements Market for Iron Deficiency Prevention, Revenue (USD Million)
2018 – 2032 …………………………………………………………………………………………………………….133
32 | P a g e
GLOBAL ORAL IRON SUPPLEMENTS MARKET, 2018 – 2032
FIG NO. 41. Oral Iron Supplements Market for Sports Nutrition, Revenue (USD Million) 2018 – 2032 ….134
FIG NO. 42. Oral Iron Supplements Market for Pregnancy Supplements, Revenue (USD Million) 2018 –
2032 ………………………………………………………………………………………………………………………135
FIG NO. 43. Oral Iron Supplements Market for Others, Revenue (USD Million) 2018 – 2032 ……………….136
FIG NO. 44. Oral Iron Supplements Market Revenue Share, By Sales Channel, 2023 & 2032 ………………138
FIG NO. 45. Market Attractiveness Analysis, By Sales Channel………………………………………………………..139
FIG NO. 46. Incremental Revenue Growth Opportunity by Sales Channel, 2024 – 2032 ……………………..140
FIG NO. 47. Oral Iron Supplements Market Revenue, By Sales Channel, 2018, 2023, 2027 & 2032 ……..141
FIG NO. 48. Oral Iron Supplements Market for Pharmacies and Drugstores, Revenue (USD Million)
2018 – 2032 …………………………………………………………………………………………………………….142
FIG NO. 49. Oral Iron Supplements Market for Supermarkets and Hypermarkets, Revenue (USD
Million) 2018 – 2032 …………………………………………………………………………………………………143
FIG NO. 50. Oral Iron Supplements Market for Online Retailers, Revenue (USD Million) 2018 – 2032 ….144
FIG NO. 51. Oral Iron Supplements Market for Others, Revenue (USD Million) 2018 – 2032 ……………….145
FIG NO. 52. Oral Iron Supplements Market Revenue Share, By Age Group, 2023 & 2032 …………………..147
FIG NO. 53. Market Attractiveness Analysis, By Age Group…………………………………………………………….148
FIG NO. 54. Incremental Revenue Growth Opportunity by Age Group, 2024 – 2032 ………………………….149
FIG NO. 55. Oral Iron Supplements Market Revenue, By Age Group, 2018, 2023, 2027 & 2032 ………….150
FIG NO. 56. Oral Iron Supplements Market for Infants: 0 to 12 months, Revenue (USD Million) 2018 –
2032 ………………………………………………………………………………………………………………………151
FIG NO. 57. Oral Iron Supplements Market for Toddlers: 1 to 3 years, Revenue (USD Million) 2018 –
2032 ………………………………………………………………………………………………………………………152
FIG NO. 58. Oral Iron Supplements Market for Toddlers: Children: 4 to 8 years, Revenue (USD Million)
2018 – 2032 …………………………………………………………………………………………………………….153
FIG NO. 59. Oral Iron Supplements Market for Toddlers: Pre-adolescents: 9 to 12 years, Revenue
(USD Million) 2018 – 2032 …………………………………………………………………………………………154
FIG NO. 60. Oral Iron Supplements Market for Toddlers: Adolescents: 13 to 18 years Revenue (USD
Million) 2018 – 2032 …………………………………………………………………………………………………155
FIG NO. 61. Oral Iron Supplements Market for Toddlers: Young Adults: 19 to 30 years Revenue (USD
Million) 2018 – 2032 …………………………………………………………………………………………………156
FIG NO. 62. Oral Iron Supplements Market for Toddlers: Adults: 31 to 45 years Revenue (USD Million)
2018 – 2032 …………………………………………………………………………………………………………….157
FIG NO. 63. Oral Iron Supplements Market for Toddlers: Middle-Aged Adults: 46 to 64 years Revenue
(USD Million) 2018 – 2032 …………………………………………………………………………………………158
FIG NO. 64. Oral Iron Supplements Market for Toddlers: Elderly / Seniors: 65 years and older Revenue
(USD Million) 2018 – 2032 …………………………………………………………………………………………159
FIG NO. 65. Global Oral Iron Supplements Market Revenue Share, By Region, 2023 & 2032 ………………162
FIG NO. 66. Market Attractiveness Analysis, By Region………………………………………………………………….163
FIG NO. 67. Incremental Revenue Growth Opportunity by Region, 2024 – 2032 ……………………………….164
FIG NO. 68. Oral Iron Supplements Market Revenue, By Region, 2018, 2023, 2027 & 2032 ……………….165
FIG NO. 69. North America Oral Iron Supplements Market Revenue, 2018 – 2032 (USD Million)………..173
FIG NO. 70. Europe Oral Iron Supplements Market Revenue, 2018 – 2032 (USD Million) …………………..199
FIG NO. 71. Asia Pacific Oral Iron Supplements Market Revenue, 2018 – 2032 (USD Million)……………..291
FIG NO. 72. Latin America Oral Iron Supplements Market Revenue, 2018 – 2032 (USD Million)………….371
FIG NO. 73. Middle East Oral Iron Supplements Market Revenue, 2018 – 2032 (USD Million)…………….415
33 | P a g e
GLOBAL ORAL IRON SUPPLEMENTS MARKET, 2018 – 2032
FIG NO. 74. Africa Oral Iron Supplements Market Revenue, 2018 – 2032 (USD Million) …………………….459
34 | P a g e
GLOBAL ORAL IRON SUPPLEMENTS MARKET, 2018 – 2032
List of Tables
TABLE NO. 1. : Global Oral Iron Supplements Market: Snapshot…………………………………………………………..56
TABLE NO. 2. : Drivers for the Oral Iron Supplements Market: Impact Analysis ………………………………………63
TABLE NO. 3. : Restraints for the Oral Iron Supplements Market: Impact Analysis…………………………………..68
TABLE NO. 4. : Per Capita Expenditure on Iron Supplements, by Region, 2024 ……………………………………….72
TABLE NO. 5. : U.S. Oral Iron Supplements Market: Company Market Share, by Revenue, 2024……………….79
TABLE NO. 6. : Canada Oral Iron Supplements Market: Company Market Share, by Revenue, 2024 ………….81
TABLE NO. 7. : UK Oral Iron Supplements Market: Company Market Share, by Revenue, 2024 ………………..83
TABLE NO. 8. : France Oral Iron Supplements Market: Company Market Share, by Revenue, 2024 …………..85
TABLE NO. 9. : Germany Oral Iron Supplements Market: Company Market Share, by Revenue, 2024 ……….87
TABLE NO. 10. : Italy Oral Iron Supplements Market: Company Market Share, by Revenue, 2024 ………………89
TABLE NO. 11. : Spain Oral Iron Supplements Market: Company Market Share, by Revenue, 2024 …………….91
TABLE NO. 12. : U.S. Oral Iron Supplements Market: Company Market Share, by Revenue, 2024……………….93
TABLE NO. 13. : Japan Oral Iron Supplements Market: Company Market Share, by Revenue, 2024…………….95
TABLE NO. 14. : India Oral Iron Supplements Market: Company Market Share, by Revenue, 2024 ……………..97
TABLE NO. 15. : Global Oral Iron Supplements Market Revenue, By Region, 2018 – 2023 (USD Million) …….166
TABLE NO. 16. : Global Oral Iron Supplements Market Revenue, By Region, 2024 – 2032 (USD Million) …….166
TABLE NO. 17. : Global Oral Iron Supplements Market Revenue, By Type, 2018 – 2024 (USD Million)………..167
TABLE NO. 18. : Global Oral Iron Supplements Market Revenue, By Type, 2025 – 2032 (USD Million)………..167
TABLE NO. 19. : Global Oral Iron Supplements Market Revenue, By Application, 2018 – 2024 (USD Million) 168
TABLE NO. 20. : Global Oral Iron Supplements Market Revenue, By Application, 2025 – 2032 (USD Million) 168
TABLE NO. 21. : Global Oral Iron Supplements Market Revenue, By Form, 2018 – 2024 (USD Million)……….169
TABLE NO. 22. : Global Oral Iron Supplements Market Revenue, By Form, 2025 – 2032 (USD Million)……….169
TABLE NO. 23. : Global Oral Iron Supplements Market Revenue, By Age Group, 2018 – 2024 (USD Million) .170
TABLE NO. 24. : Global Oral Iron Supplements Market Revenue, By Age Group, 2025 – 2032 (USD Million) .171
TABLE NO. 25. : Global Oral Iron Supplements Market Revenue, By Sales Channel, 2018 – 2024 (USD
Million)…………………………………………………………………………………………………………………..172
TABLE NO. 26. : Global Oral Iron Supplements Market Revenue, By Sales Channel, 2024 – 2032 (USD
Million)…………………………………………………………………………………………………………………..172
TABLE NO. 27. : North America Oral Iron Supplements Market Revenue, By Country, 2018 – 2024 (USD
Million)…………………………………………………………………………………………………………………..174
TABLE NO. 28. : North America Oral Iron Supplements Market Revenue, By Country, 2025 – 2032 (USD
Million)…………………………………………………………………………………………………………………..174
TABLE NO. 29. : North America Oral Iron Supplements Market Revenue, By Type, 2018 – 2024 (USD
Million)…………………………………………………………………………………………………………………..175
TABLE NO. 30. : North America Oral Iron Supplements Market Revenue, By Type, 2025 – 2032 (USD
Million)…………………………………………………………………………………………………………………..175
TABLE NO. 31. : North America Oral Iron Supplements Market Revenue, By Application, 2018 – 2024 (USD
Million)…………………………………………………………………………………………………………………..176
TABLE NO. 32. : North America Oral Iron Supplements Market Revenue, By Application, 2025 – 2032 (USD
Million)…………………………………………………………………………………………………………………..176
TABLE NO. 33. : North America Oral Iron Supplements Market Revenue, By Form, 2018 – 2024 (USD
Million)…………………………………………………………………………………………………………………..177
35 | P a g e
GLOBAL ORAL IRON SUPPLEMENTS MARKET, 2018 – 2032
TABLE NO. 34. : North America Oral Iron Supplements Market Revenue, By Form, 2025 – 2032 (USD
Million)…………………………………………………………………………………………………………………..177
TABLE NO. 35. : North America Oral Iron Supplements Market Revenue, By Age Group, 2018 – 2024 (USD
Million)…………………………………………………………………………………………………………………..178
TABLE NO. 36. : North America Oral Iron Supplements Market Revenue, By Age Group, 2025 – 2032 (USD
Million)…………………………………………………………………………………………………………………..179
TABLE NO. 37. : North America Oral Iron Supplements Market Revenue, By Sales Channel, 2018 – 2024
(USD Million)…………………………………………………………………………………………………………..180
TABLE NO. 38. : North America Oral Iron Supplements Market Revenue, By Sales Channel, 2025 – 2032
(USD Million)…………………………………………………………………………………………………………..180
TABLE NO. 39. : U.S. Oral Iron Supplements Market Revenue, By Type, 2018 – 2024 (USD Million)……………181
TABLE NO. 40. : U.S. Oral Iron Supplements Market Revenue, By Type, 2025 – 2032 (USD Million)……………181
TABLE NO. 41. : U.S. Oral Iron Supplements Market Revenue, By Application, 2018 – 2024 (USD Million)….182
TABLE NO. 42. : U.S. Oral Iron Supplements Market Revenue, By Application, 2025 – 2032 (USD Million)….182
TABLE NO. 43. : U.S. Oral Iron Supplements Market Revenue, By Form, 2018 – 2024 (USD Million)…………..183
TABLE NO. 44. : U.S. Oral Iron Supplements Market Revenue, By Form, 2025 – 2032 (USD Million)…………..183
TABLE NO. 45. : U.S. Oral Iron Supplements Market Revenue, By Age Group, 2018 – 2024 (USD Million) …..184
TABLE NO. 46. : U.S. Oral Iron Supplements Market Revenue, By Age Group, 2025 – 2032 (USD Million) …..185
TABLE NO. 47. : U.S. Oral Iron Supplements Market Revenue, By Sales Channel, 2018 – 2024 (USD Million) 186
TABLE NO. 48. : U.S. Oral Iron Supplements Market Revenue, By Sales Channel, 2025 – 2032 (USD Million) 186
TABLE NO. 49. : Canada Oral Iron Supplements Market Revenue, By Type, 2018 – 2024 (USD Million)………187
TABLE NO. 50. : Canada Oral Iron Supplements Market Revenue, By Type, 2025 – 2032 (USD Million)………187
TABLE NO. 51. : Canada Oral Iron Supplements Market Revenue, By Application, 2018 – 2024 (USD
Million)…………………………………………………………………………………………………………………..188
TABLE NO. 52. : Canada Oral Iron Supplements Market Revenue, By Application, 2025 – 2032 (USD
Million)…………………………………………………………………………………………………………………..188
TABLE NO. 53. : Canada Oral Iron Supplements Market Revenue, By Form, 2018 – 2024 (USD Million) ……..189
TABLE NO. 54. : Canada Oral Iron Supplements Market Revenue, By Form, 2025 – 2032 (USD Million) ……..189
TABLE NO. 55. : Canada Oral Iron Supplements Market Revenue, By Age Group, 2018 – 2024 (USD Million)190
TABLE NO. 56. : Canada Oral Iron Supplements Market Revenue, By Age Group, 2025 – 2032 (USD Million)191
TABLE NO. 57. : Canada Oral Iron Supplements Market Revenue, By Sales Channel, 2018 – 2024 (USD
Million)…………………………………………………………………………………………………………………..192
TABLE NO. 58. : Canada Oral Iron Supplements Market Revenue, By Sales Channel, 2025 – 2032 (USD
Million)…………………………………………………………………………………………………………………..192
TABLE NO. 59. : Mexico Oral Iron Supplements Market Revenue, By Type, 2018 – 2024 (USD Million) ………193
TABLE NO. 60. : Mexico Oral Iron Supplements Market Revenue, By Type, 2025 – 2032 (USD Million) ………193
TABLE NO. 61. : Mexico Oral Iron Supplements Market Revenue, By Application, 2018 – 2024 (USD
Million)…………………………………………………………………………………………………………………..194
TABLE NO. 62. : Mexico Oral Iron Supplements Market Revenue, By Application, 2025 – 2032 (USD
Million)…………………………………………………………………………………………………………………..194
TABLE NO. 63. : Mexico Oral Iron Supplements Market Revenue, By Form, 2018 – 2024 (USD Million) ……..195
TABLE NO. 64. : Mexico Oral Iron Supplements Market Revenue, By Form, 2025 – 2032 (USD Million) ……..195
TABLE NO. 65. : Mexico Oral Iron Supplements Market Revenue, By Age Group, 2018 – 2024 (USD Million)196
TABLE NO. 66. : Mexico Oral Iron Supplements Market Revenue, By Age Group, 2025 – 2032 (USD Million)197
36 | P a g e
GLOBAL ORAL IRON SUPPLEMENTS MARKET, 2018 – 2032
TABLE NO. 67. : Mexico Oral Iron Supplements Market Revenue, By Sales Channel, 2018 – 2024 (USD
Million)…………………………………………………………………………………………………………………..198
TABLE NO. 68. : Mexico Oral Iron Supplements Market Revenue, By Sales Channel, 2025 – 2032 (USD
Million)…………………………………………………………………………………………………………………..198
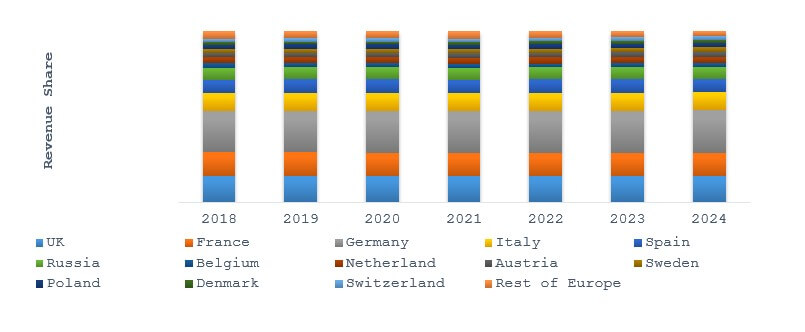
TABLE NO. 69. : Europe Oral Iron Supplements Market Revenue, By Country, 2018 – 2024 (USD Million) ….200
TABLE NO. 70. : Europe Oral Iron Supplements Market Revenue, By Country, 2025 – 2032 (USD Million) ….200
TABLE NO. 71. : Europe Oral Iron Supplements Market Revenue, By Type, 2018 – 2024 (USD Million) ………201
TABLE NO. 72. : Europe Oral Iron Supplements Market Revenue, By Type, 2025 – 2032 (USD Million) ………201
TABLE NO. 73. : Europe Oral Iron Supplements Market Revenue, By Application, 2018 – 2024 (USD Million)202
TABLE NO. 74. : Europe Oral Iron Supplements Market Revenue, By Application, 2025 – 2032 (USD Million)202
TABLE NO. 75. : Europe Oral Iron Supplements Market Revenue, By Form, 2018 – 2024 (USD Million)………203
TABLE NO. 76. : Europe Oral Iron Supplements Market Revenue, By Form, 2025 – 2032 (USD Million)………203
TABLE NO. 77. : Europe Oral Iron Supplements Market Revenue, By Age Group, 2018 – 2024 (USD Million) 204
TABLE NO. 78. : Europe Oral Iron Supplements Market Revenue, By Age Group, 2025 – 2032 (USD Million) 205
TABLE NO. 79. : Europe Oral Iron Supplements Market Revenue, By Sales Channel, 2018 – 2024 (USD
Million)…………………………………………………………………………………………………………………..206
TABLE NO. 80. : Europe Oral Iron Supplements Market Revenue, By Sales Channel, 2025 – 2032 (USD
Million)…………………………………………………………………………………………………………………..206
TABLE NO. 81. : UK Oral Iron Supplements Market Revenue, By Type, 2018 – 2024 (USD Million) …………….207
TABLE NO. 82. : UK Oral Iron Supplements Market Revenue, By Type, 2025 – 2032 (USD Million) …………….207
TABLE NO. 83. : UK Oral Iron Supplements Market Revenue, By Application, 2018 – 2024 (USD Million)……208
TABLE NO. 84. : UK Oral Iron Supplements Market Revenue, By Application, 2025 – 2032 (USD Million)……208
TABLE NO. 85. : UK Oral Iron Supplements Market Revenue, By Form, 2018 – 2024 (USD Million)…………….209
TABLE NO. 86. : UK Oral Iron Supplements Market Revenue, By Form, 2025 – 2032 (USD Million)…………….209
TABLE NO. 87. : UK Oral Iron Supplements Market Revenue, By Age Group, 2018 – 2024 (USD Million)…….210
TABLE NO. 88. : UK Oral Iron Supplements Market Revenue, By Age Group, 2025 – 2032 (USD Million)…….211
TABLE NO. 89. : UK Oral Iron Supplements Market Revenue, By Sales Channel, 2018 – 2024 (USD Million)..212
TABLE NO. 90. : UK Oral Iron Supplements Market Revenue, By Sales Channel, 2025 – 2032 (USD Million)..212
TABLE NO. 91. : France Oral Iron Supplements Market Revenue, By Type, 2018 – 2024 (USD Million)……….213
TABLE NO. 92. : France Oral Iron Supplements Market Revenue, By Type, 2025 – 2032 (USD Million)……….213
TABLE NO. 93. : France Oral Iron Supplements Market Revenue, By Application, 2018 – 2024 (USD Million)214
TABLE NO. 94. : France Oral Iron Supplements Market Revenue, By Application, 2025 – 2032 (USD Million)214
TABLE NO. 95. : France Oral Iron Supplements Market Revenue, By Form, 2018 – 2024 (USD Million) ………215
TABLE NO. 96. : France Oral Iron Supplements Market Revenue, By Form, 2025 – 2032 (USD Million) ………215
TABLE NO. 97. : France Oral Iron Supplements Market Revenue, By Age Group, 2018 – 2024 (USD Million).216
TABLE NO. 98. : France Oral Iron Supplements Market Revenue, By Age Group, 2025 – 2032 (USD Million).217
TABLE NO. 99. : France Oral Iron Supplements Market Revenue, By Sales Channel, 2018 – 2024 (USD
Million)…………………………………………………………………………………………………………………..218
TABLE NO. 100. : France Oral Iron Supplements Market Revenue, By Sales Channel, 2025 – 2032 (USD
Million)…………………………………………………………………………………………………………………..218
TABLE NO. 101. : Germany Oral Iron Supplements Market Revenue, By Type, 2018 – 2024 (USD Million) ……219
TABLE NO. 102. : Germany Oral Iron Supplements Market Revenue, By Type, 2025 – 2032 (USD Million) ……219
TABLE NO. 103. : Germany Oral Iron Supplements Market Revenue, By Application, 2018 – 2024 (USD
Million)…………………………………………………………………………………………………………………..220
37 | P a g e
GLOBAL ORAL IRON SUPPLEMENTS MARKET, 2018 – 2032
TABLE NO. 104. : Germany Oral Iron Supplements Market Revenue, By Application, 2025 – 2032 (USD
Million)…………………………………………………………………………………………………………………..220
TABLE NO. 105. : Germany Oral Iron Supplements Market Revenue, By Form, 2018 – 2024 (USD Million) …..221
TABLE NO. 106. : Germany Oral Iron Supplements Market Revenue, By Form, 2025 – 2032 (USD Million) …..221
TABLE NO. 107. : Germany Oral Iron Supplements Market Revenue, By Age Group, 2018 – 2024 (USD
Million)…………………………………………………………………………………………………………………..222
TABLE NO. 108. : Germany Oral Iron Supplements Market Revenue, By Age Group, 2025 – 2032 (USD
Million)…………………………………………………………………………………………………………………..223
TABLE NO. 109. : Germany Oral Iron Supplements Market Revenue, By Sales Channel, 2018 – 2024 (USD
Million)…………………………………………………………………………………………………………………..224
TABLE NO. 110. : Germany Oral Iron Supplements Market Revenue, By Sales Channel, 2025 – 2032 (USD
Million)…………………………………………………………………………………………………………………..224
TABLE NO. 111. : Italy Oral Iron Supplements Market Revenue, By Type, 2018 – 2024 (USD Million)…………..225
TABLE NO. 112. : Italy Oral Iron Supplements Market Revenue, By Type, 2025 – 2032 (USD Million)…………..225
TABLE NO. 113. : Italy Oral Iron Supplements Market Revenue, By Application, 2018 – 2024 (USD Million)….226
TABLE NO. 114. : Italy Oral Iron Supplements Market Revenue, By Application, 2025 – 2032 (USD Million)….226
TABLE NO. 115. : Italy Oral Iron Supplements Market Revenue, By Form, 2018 – 2024 (USD Million) ………….227
TABLE NO. 116. : Italy Oral Iron Supplements Market Revenue, By Form, 2025 – 2032 (USD Million) ………….227
TABLE NO. 117. : Italy Oral Iron Supplements Market Revenue, By Age Group, 2018 – 2024 (USD Million)…..228
TABLE NO. 118. : Italy Oral Iron Supplements Market Revenue, By Age Group, 2025 – 2032 (USD Million)…..229
TABLE NO. 119. : Italy Oral Iron Supplements Market Revenue, By Sales Channel, 2018 – 2024 (USD Million)230
TABLE NO. 120. : Italy Oral Iron Supplements Market Revenue, By Sales Channel, 2025 – 2032 (USD Million)230
TABLE NO. 121. : Spain Oral Iron Supplements Market Revenue, By Type, 2018 – 2024 (USD Million) …………231
TABLE NO. 122. : Spain Oral Iron Supplements Market Revenue, By Type, 2025 – 2032 (USD Million) …………231
TABLE NO. 123. : Spain Oral Iron Supplements Market Revenue, By Application, 2018 – 2024 (USD Million)..232
TABLE NO. 124. : Spain Oral Iron Supplements Market Revenue, By Application, 2025 – 2032 (USD Million)..232
TABLE NO. 125. : Spain Oral Iron Supplements Market Revenue, By Form, 2018 – 2024 (USD Million) ………..233
TABLE NO. 126. : Spain Oral Iron Supplements Market Revenue, By Form, 2025 – 2032 (USD Million) ………..233
TABLE NO. 127. : Spain Oral Iron Supplements Market Revenue, By Age Group, 2018 – 2024 (USD Million)…234
TABLE NO. 128. : Spain Oral Iron Supplements Market Revenue, By Age Group, 2025 – 2032 (USD Million)…235
TABLE NO. 129. : Spain Oral Iron Supplements Market Revenue, By Sales Channel, 2018 – 2024 (USD
Million)…………………………………………………………………………………………………………………..236
TABLE NO. 130. : Spain Oral Iron Supplements Market Revenue, By Sales Channel, 2025 – 2032 (USD
Million)…………………………………………………………………………………………………………………..236
TABLE NO. 131. : Russia Oral Iron Supplements Market Revenue, By Type, 2018 – 2024 (USD Million)………..237
TABLE NO. 132. : Russia Oral Iron Supplements Market Revenue, By Type, 2025 – 2032 (USD Million)………..237
TABLE NO. 133. : Russia Oral Iron Supplements Market Revenue, By Application, 2018 – 2024 (USD Million) 238
TABLE NO. 134. : Russia Oral Iron Supplements Market Revenue, By Application, 2025 – 2032 (USD Million) 238
TABLE NO. 135. : Russia Oral Iron Supplements Market Revenue, By Form, 2018 – 2024 (USD Million)……….239
TABLE NO. 136. : Russia Oral Iron Supplements Market Revenue, By Form, 2025 – 2032 (USD Million)……….239
TABLE NO. 137. : Russia Oral Iron Supplements Market Revenue, By Age Group, 2018 – 2024 (USD Million) .240
TABLE NO. 138. : Russia Oral Iron Supplements Market Revenue, By Age Group, 2025 – 2032 (USD Million) .241
TABLE NO. 139. : Russia Oral Iron Supplements Market Revenue, By Sales Channel, 2018 – 2024 (USD
Million)…………………………………………………………………………………………………………………..242
38 | P a g e
GLOBAL ORAL IRON SUPPLEMENTS MARKET, 2018 – 2032
TABLE NO. 140. : Russia Oral Iron Supplements Market Revenue, By Sales Channel, 2025 – 2032 (USD
Million)…………………………………………………………………………………………………………………..242
TABLE NO. 141. : Belgium Oral Iron Supplements Market Revenue, By Type, 2018 – 2024 (USD Million)……..243
TABLE NO. 142. : Belgium Oral Iron Supplements Market Revenue, By Type, 2025 – 2032 (USD Million)……..243
TABLE NO. 143. : Belgium Oral Iron Supplements Market Revenue, By Application, 2018 – 2024 (USD
Million)…………………………………………………………………………………………………………………..244
TABLE NO. 144. : Belgium Oral Iron Supplements Market Revenue, By Application, 2025 – 2032 (USD
Million)…………………………………………………………………………………………………………………..244
TABLE NO. 145. : Belgium Oral Iron Supplements Market Revenue, By Form, 2018 – 2024 (USD Million) …….245
TABLE NO. 146. : Belgium Oral Iron Supplements Market Revenue, By Form, 2025 – 2032 (USD Million) …….245
TABLE NO. 147. : Belgium Oral Iron Supplements Market Revenue, By Age Group, 2018 – 2024 (USD
Million)…………………………………………………………………………………………………………………..246
TABLE NO. 148. : Belgium Oral Iron Supplements Market Revenue, By Age Group, 2025 – 2032 (USD
Million)…………………………………………………………………………………………………………………..247
TABLE NO. 149. : Belgium Oral Iron Supplements Market Revenue, By Sales Channel, 2018 – 2024 (USD
Million)…………………………………………………………………………………………………………………..248
TABLE NO. 150. : Belgium Oral Iron Supplements Market Revenue, By Sales Channel, 2025 – 2032 (USD
Million)…………………………………………………………………………………………………………………..248
TABLE NO. 151. : Netherland Oral Iron Supplements Market Revenue, By Type, 2018 – 2024 (USD Million)…249
TABLE NO. 152. : Netherland Oral Iron Supplements Market Revenue, By Type, 2025 – 2032 (USD Million)…249
TABLE NO. 153. : Netherland Oral Iron Supplements Market Revenue, By Application, 2018 – 2024 (USD
Million)…………………………………………………………………………………………………………………..250
TABLE NO. 154. : Netherland Oral Iron Supplements Market Revenue, By Application, 2025 – 2032 (USD
Million)…………………………………………………………………………………………………………………..250
TABLE NO. 155. : Netherland Oral Iron Supplements Market Revenue, By Form, 2018 – 2024 (USD Million)..251
TABLE NO. 156. : Netherland Oral Iron Supplements Market Revenue, By Form, 2025 – 2032 (USD Million)..251
TABLE NO. 157. : Netherland Oral Iron Supplements Market Revenue, By Age Group, 2018 – 2024 (USD
Million)…………………………………………………………………………………………………………………..252
TABLE NO. 158. : Netherland Oral Iron Supplements Market Revenue, By Age Group, 2025 – 2032 (USD
Million)…………………………………………………………………………………………………………………..253
TABLE NO. 159. : Netherland Oral Iron Supplements Market Revenue, By Sales Channel, 2018 – 2024 (USD
Million)…………………………………………………………………………………………………………………..254
TABLE NO. 160. : Netherland Oral Iron Supplements Market Revenue, By Sales Channel, 2025 – 2032 (USD
Million)…………………………………………………………………………………………………………………..254
TABLE NO. 161. : Austria Oral Iron Supplements Market Revenue, By Type, 2018 – 2024 (USD Million) ………255
TABLE NO. 162. : Austria Oral Iron Supplements Market Revenue, By Type, 2025 – 2032 (USD Million) ………255
TABLE NO. 163. : Austria Oral Iron Supplements Market Revenue, By Application, 2018 – 2024 (USD Million)256
TABLE NO. 164. : Austria Oral Iron Supplements Market Revenue, By Application, 2025 – 2032 (USD Million)256
TABLE NO. 165. : Austria Oral Iron Supplements Market Revenue, By Form, 2018 – 2024 (USD Million)………257
TABLE NO. 166. : Austria Oral Iron Supplements Market Revenue, By Form, 2025 – 2032 (USD Million)………257
TABLE NO. 167. : Austria Oral Iron Supplements Market Revenue, By Age Group, 2018 – 2024 (USD Million) 258
TABLE NO. 168. : Austria Oral Iron Supplements Market Revenue, By Age Group, 2025 – 2032 (USD Million) 259
TABLE NO. 169. : Austria Oral Iron Supplements Market Revenue, By Sales Channel, 2018 – 2024 (USD
Million)…………………………………………………………………………………………………………………..260
39 | P a g e
GLOBAL ORAL IRON SUPPLEMENTS MARKET, 2018 – 2032
TABLE NO. 170. : Austria Oral Iron Supplements Market Revenue, By Sales Channel, 2025 – 2032 (USD
Million)…………………………………………………………………………………………………………………..260
TABLE NO. 171. : Sweden Oral Iron Supplements Market Revenue, By Type, 2018 – 2024 (USD Million) ……..261
TABLE NO. 172. : Sweden Oral Iron Supplements Market Revenue, By Type, 2025 – 2032 (USD Million) ……..261
TABLE NO. 173. : Sweden Oral Iron Supplements Market Revenue, By Application, 2018 – 2024 (USD
Million)…………………………………………………………………………………………………………………..262
TABLE NO. 174. : Sweden Oral Iron Supplements Market Revenue, By Application, 2025 – 2032 (USD
Million)…………………………………………………………………………………………………………………..262
TABLE NO. 175. : Sweden Oral Iron Supplements Market Revenue, By Form, 2018 – 2024 (USD Million) …….263
TABLE NO. 176. : Sweden Oral Iron Supplements Market Revenue, By Form, 2025 – 2032 (USD Million) …….263
TABLE NO. 177. : Sweden Oral Iron Supplements Market Revenue, By Age Group, 2018 – 2024 (USD
Million)…………………………………………………………………………………………………………………..264
TABLE NO. 178. : Sweden Oral Iron Supplements Market Revenue, By Age Group, 2025 – 2032 (USD
Million)…………………………………………………………………………………………………………………..265
TABLE NO. 179. : Sweden Oral Iron Supplements Market Revenue, By Sales Channel, 2018 – 2024 (USD
Million)…………………………………………………………………………………………………………………..266
TABLE NO. 180. : Sweden Oral Iron Supplements Market Revenue, By Sales Channel, 2025 – 2032 (USD
Million)…………………………………………………………………………………………………………………..266
TABLE NO. 181. : Poland Oral Iron Supplements Market Revenue, By Type, 2018 – 2024 (USD Million)……….267
TABLE NO. 182. : Poland Oral Iron Supplements Market Revenue, By Type, 2025 – 2032 (USD Million)……….267
TABLE NO. 183. : Poland Oral Iron Supplements Market Revenue, By Application, 2018 – 2024 (USD Million)268
TABLE NO. 184. : Poland Oral Iron Supplements Market Revenue, By Application, 2025 – 2032 (USD Million)268
TABLE NO. 185. : Poland Oral Iron Supplements Market Revenue, By Form, 2018 – 2024 (USD Million) ………269
TABLE NO. 186. : Poland Oral Iron Supplements Market Revenue, By Form, 2025 – 2032 (USD Million) ………269
TABLE NO. 187. : Poland Oral Iron Supplements Market Revenue, By Age Group, 2018 – 2024 (USD Million) 270
TABLE NO. 188. : Poland Oral Iron Supplements Market Revenue, By Age Group, 2025 – 2032 (USD Million) 271
TABLE NO. 189. : Poland Oral Iron Supplements Market Revenue, By Sales Channel, 2018 – 2024 (USD
Million)…………………………………………………………………………………………………………………..272
TABLE NO. 190. : Poland Oral Iron Supplements Market Revenue, By Sales Channel, 2025 – 2032 (USD
Million)…………………………………………………………………………………………………………………..272
TABLE NO. 191. : Denmark Oral Iron Supplements Market Revenue, By Type, 2018 – 2024 (USD Million) ……273
TABLE NO. 192. : Denmark Oral Iron Supplements Market Revenue, By Type, 2025 – 2032 (USD Million) ……273
TABLE NO. 193. : Denmark Oral Iron Supplements Market Revenue, By Application, 2018 – 2024 (USD
Million)…………………………………………………………………………………………………………………..274
TABLE NO. 194. : Denmark Oral Iron Supplements Market Revenue, By Application, 2025 – 2032 (USD
Million)…………………………………………………………………………………………………………………..274
TABLE NO. 195. : Denmark Oral Iron Supplements Market Revenue, By Form, 2018 – 2024 (USD Million)……275
TABLE NO. 196. : Denmark Oral Iron Supplements Market Revenue, By Form, 2025 – 2032 (USD Million)……275
TABLE NO. 197. : Denmark Oral Iron Supplements Market Revenue, By Age Group, 2018 – 2024 (USD
Million)…………………………………………………………………………………………………………………..276
TABLE NO. 198. : Denmark Oral Iron Supplements Market Revenue, By Age Group, 2025 – 2032 (USD
Million)…………………………………………………………………………………………………………………..277
TABLE NO. 199. : Denmark Oral Iron Supplements Market Revenue, By Sales Channel, 2018 – 2024 (USD
Million)…………………………………………………………………………………………………………………..278
40 | P a g e
GLOBAL ORAL IRON SUPPLEMENTS MARKET, 2018 – 2032
TABLE NO. 200. : Denmark Oral Iron Supplements Market Revenue, By Sales Channel, 2025 – 2032 (USD
Million)…………………………………………………………………………………………………………………..278
TABLE NO. 201. : Switzerland Oral Iron Supplements Market Revenue, By Type, 2018 – 2024 (USD Million) ..279
TABLE NO. 202. : Switzerland Oral Iron Supplements Market Revenue, By Type, 2025 – 2032 (USD Million) ..279
TABLE NO. 203. : Switzerland Oral Iron Supplements Market Revenue, By Application, 2018 – 2024 (USD
Million)…………………………………………………………………………………………………………………..280
TABLE NO. 204. : Switzerland Oral Iron Supplements Market Revenue, By Application, 2025 – 2032 (USD
Million)…………………………………………………………………………………………………………………..280
TABLE NO. 205. : Switzerland Oral Iron Supplements Market Revenue, By Form, 2018 – 2024 (USD Million) .281
TABLE NO. 206. : Switzerland Oral Iron Supplements Market Revenue, By Form, 2025 – 2032 (USD Million) .281
TABLE NO. 207. : Switzerland Oral Iron Supplements Market Revenue, By Age Group, 2018 – 2024 (USD
Million)…………………………………………………………………………………………………………………..282
TABLE NO. 208. : Switzerland Oral Iron Supplements Market Revenue, By Age Group, 2025 – 2032 (USD
Million)…………………………………………………………………………………………………………………..283
TABLE NO. 209. : Switzerland Oral Iron Supplements Market Revenue, By Sales Channel, 2018 – 2024 (USD
Million)…………………………………………………………………………………………………………………..284
TABLE NO. 210. : Switzerland Oral Iron Supplements Market Revenue, By Sales Channel, 2025 – 2032 (USD
Million)…………………………………………………………………………………………………………………..284
TABLE NO. 211. : Rest of Europe Oral Iron Supplements Market Revenue, By Type, 2018 – 2024 (USD
Million)…………………………………………………………………………………………………………………..285
TABLE NO. 212. : Rest of Europe Oral Iron Supplements Market Revenue, By Type, 2025 – 2032 (USD
Million)…………………………………………………………………………………………………………………..285
TABLE NO. 213. : Rest of Europe Oral Iron Supplements Market Revenue, By Application, 2018 – 2024 (USD
Million)…………………………………………………………………………………………………………………..286
TABLE NO. 214. : Rest of Europe Oral Iron Supplements Market Revenue, By Application, 2025 – 2032 (USD
Million)…………………………………………………………………………………………………………………..286
TABLE NO. 215. : Rest of Europe Oral Iron Supplements Market Revenue, By Form, 2018 – 2024 (USD
Million)…………………………………………………………………………………………………………………..287
TABLE NO. 216. : Rest of Europe Oral Iron Supplements Market Revenue, By Form, 2025 – 2032 (USD
Million)…………………………………………………………………………………………………………………..287
TABLE NO. 217. : Rest of Europe Oral Iron Supplements Market Revenue, By Age Group, 2018 – 2024 (USD
Million)…………………………………………………………………………………………………………………..288
TABLE NO. 218. : Rest of Europe Oral Iron Supplements Market Revenue, By Age Group, 2025 – 2032 (USD
Million)…………………………………………………………………………………………………………………..289
TABLE NO. 219. : Rest of Europe Oral Iron Supplements Market Revenue, By Sales Channel, 2018 – 2024
(USD Million)…………………………………………………………………………………………………………..290
TABLE NO. 220. : Rest of Europe Oral Iron Supplements Market Revenue, By Sales Channel, 2025 – 2032
(USD Million)…………………………………………………………………………………………………………..290
TABLE NO. 221. : Asia Pacific Oral Iron Supplements Market Revenue, By Country, 2018 – 2024 (USD
Million)…………………………………………………………………………………………………………………..292
TABLE NO. 222. : Asia Pacific Oral Iron Supplements Market Revenue, By Country, 2025 – 2032 (USD
Million)…………………………………………………………………………………………………………………..292
TABLE NO. 223. : Asia Pacific Oral Iron Supplements Market Revenue, By Type, 2018 – 2024 (USD Million)…293
TABLE NO. 224. : Asia Pacific Oral Iron Supplements Market Revenue, By Type, 2025 – 2032 (USD Million)…293
41 | P a g e
GLOBAL ORAL IRON SUPPLEMENTS MARKET, 2018 – 2032
TABLE NO. 225. : Asia Pacific Oral Iron Supplements Market Revenue, By Application, 2018 – 2024 (USD
Million)…………………………………………………………………………………………………………………..294
TABLE NO. 226. : Asia Pacific Oral Iron Supplements Market Revenue, By Application, 2025 – 2032 (USD
Million)…………………………………………………………………………………………………………………..294
TABLE NO. 227. : Asia Pacific Oral Iron Supplements Market Revenue, By Form, 2018 – 2024 (USD Million) ..295
TABLE NO. 228. : Asia Pacific Oral Iron Supplements Market Revenue, By Form, 2025 – 2032 (USD Million) ..295
TABLE NO. 229. : Asia Pacific Oral Iron Supplements Market Revenue, By Age Group, 2018 – 2024 (USD
Million)…………………………………………………………………………………………………………………..296
TABLE NO. 230. : Asia Pacific Oral Iron Supplements Market Revenue, By Age Group, 2025 – 2032 (USD
Million)…………………………………………………………………………………………………………………..297
TABLE NO. 231. : Asia Pacific Oral Iron Supplements Market Revenue, By Sales Channel, 2018 – 2024 (USD
Million)…………………………………………………………………………………………………………………..298
TABLE NO. 232. : Asia Pacific Oral Iron Supplements Market Revenue, By Sales Channel, 2025 – 2032 (USD
Million)…………………………………………………………………………………………………………………..298
TABLE NO. 233. : China Oral Iron Supplements Market Revenue, By Type, 2018 – 2024 (USD Million)…………299
TABLE NO. 234. : China Oral Iron Supplements Market Revenue, By Type, 2025 – 2032 (USD Million)…………299
TABLE NO. 235. : China Oral Iron Supplements Market Revenue, By Application, 2018 – 2024 (USD Million) .300
TABLE NO. 236. : China Oral Iron Supplements Market Revenue, By Application, 2025 – 2032 (USD Million) .300
TABLE NO. 237. : China Oral Iron Supplements Market Revenue, By Form, 2018 – 2024 (USD Million) ………..301
TABLE NO. 238. : China Oral Iron Supplements Market Revenue, By Form, 2025 – 2032 (USD Million) ………..301
TABLE NO. 239. : China Oral Iron Supplements Market Revenue, By Age Group, 2018 – 2024 (USD Million) ..302
TABLE NO. 240. : China Oral Iron Supplements Market Revenue, By Age Group, 2025 – 2032 (USD Million) ..303
TABLE NO. 241. : China Oral Iron Supplements Market Revenue, By Sales Channel, 2018 – 2024 (USD
Million)…………………………………………………………………………………………………………………..304
TABLE NO. 242. : China Oral Iron Supplements Market Revenue, By Sales Channel, 2025 – 2032 (USD
Million)…………………………………………………………………………………………………………………..304
TABLE NO. 243. : Japan Oral Iron Supplements Market Revenue, By Type, 2018 – 2024 (USD Million)…………305
TABLE NO. 244. : Japan Oral Iron Supplements Market Revenue, By Type, 2025 – 2032 (USD Million)…………305
TABLE NO. 245. : Japan Oral Iron Supplements Market Revenue, By Application, 2018 – 2024 (USD Million) .306
TABLE NO. 246. : Japan Oral Iron Supplements Market Revenue, By Application, 2025 – 2032 (USD Million) .306
TABLE NO. 247. : Japan Oral Iron Supplements Market Revenue, By Form, 2018 – 2024 (USD Million)………..307
TABLE NO. 248. : Japan Oral Iron Supplements Market Revenue, By Form, 2025 – 2032 (USD Million)………..307
TABLE NO. 249. : Japan Oral Iron Supplements Market Revenue, By Age Group, 2018 – 2024 (USD Million) ..308
TABLE NO. 250. : Japan Oral Iron Supplements Market Revenue, By Age Group, 2025 – 2032 (USD Million) ..309
TABLE NO. 251. : Japan Oral Iron Supplements Market Revenue, By Sales Channel, 2018 – 2024 (USD
Million)…………………………………………………………………………………………………………………..310
TABLE NO. 252. : Japan Oral Iron Supplements Market Revenue, By Sales Channel, 2025 – 2032 (USD
Million)…………………………………………………………………………………………………………………..310
TABLE NO. 253. : South Korea Oral Iron Supplements Market Revenue, By Type, 2018 – 2024 (USD Million) .311
TABLE NO. 254. : South Korea Oral Iron Supplements Market Revenue, By Type, 2025 – 2032 (USD Million) .311
TABLE NO. 255. : South Korea Oral Iron Supplements Market Revenue, By Application, 2018 – 2024 (USD
Million)…………………………………………………………………………………………………………………..312
TABLE NO. 256. : South Korea Oral Iron Supplements Market Revenue, By Application, 2025 – 2032 (USD
Million)…………………………………………………………………………………………………………………..312
TABLE NO. 257. : South Korea Oral Iron Supplements Market Revenue, By Form, 2018 – 2024 (USD Million).313
42 | P a g e
GLOBAL ORAL IRON SUPPLEMENTS MARKET, 2018 – 2032
TABLE NO. 258. : South Korea Oral Iron Supplements Market Revenue, By Form, 2025 – 2032 (USD Million).313
TABLE NO. 259. : South Korea Oral Iron Supplements Market Revenue, By Age Group, 2018 – 2024 (USD
Million)…………………………………………………………………………………………………………………..314
TABLE NO. 260. : South Korea Oral Iron Supplements Market Revenue, By Age Group, 2025 – 2032 (USD
Million)…………………………………………………………………………………………………………………..315
TABLE NO. 261. : South Korea Oral Iron Supplements Market Revenue, By Sales Channel, 2018 – 2024 (USD
Million)…………………………………………………………………………………………………………………..316
TABLE NO. 262. : South Korea Oral Iron Supplements Market Revenue, By Sales Channel, 2025 – 2032 (USD
Million)…………………………………………………………………………………………………………………..316
TABLE NO. 263. : India Oral Iron Supplements Market Revenue, By Type, 2018 – 2024 (USD Million)………….317
TABLE NO. 264. : India Oral Iron Supplements Market Revenue, By Type, 2025 – 2032 (USD Million)………….317
TABLE NO. 265. : India Oral Iron Supplements Market Revenue, By Application, 2018 – 2024 (USD Million) ..318
TABLE NO. 266. : India Oral Iron Supplements Market Revenue, By Application, 2025 – 2032 (USD Million) ..318
TABLE NO. 267. : India Oral Iron Supplements Market Revenue, By Form, 2018 – 2024 (USD Million) …………319
TABLE NO. 268. : India Oral Iron Supplements Market Revenue, By Form, 2025 – 2032 (USD Million) …………319
TABLE NO. 269. : India Oral Iron Supplements Market Revenue, By Age Group, 2018 – 2024 (USD Million)….320
TABLE NO. 270. : India Oral Iron Supplements Market Revenue, By Age Group, 2025 – 2032 (USD Million)….321
TABLE NO. 271. : India Oral Iron Supplements Market Revenue, By Sales Channel, 2018 – 2024 (USD
Million)…………………………………………………………………………………………………………………..322
TABLE NO. 272. : India Oral Iron Supplements Market Revenue, By Sales Channel, 2025 – 2032 (USD
Million)…………………………………………………………………………………………………………………..322
TABLE NO. 273. : Australia Oral Iron Supplements Market Revenue, By Type, 2018 – 2024 (USD Million)…….323
TABLE NO. 274. : Australia Oral Iron Supplements Market Revenue, By Type, 2025 – 2032 (USD Million)…….323
TABLE NO. 275. : Australia Oral Iron Supplements Market Revenue, By Application, 2018 – 2024 (USD
Million)…………………………………………………………………………………………………………………..324
TABLE NO. 276. : Australia Oral Iron Supplements Market Revenue, By Application, 2025 – 2032 (USD
Million)…………………………………………………………………………………………………………………..324
TABLE NO. 277. : Australia Oral Iron Supplements Market Revenue, By Form, 2018 – 2024 (USD Million)……325
TABLE NO. 278. : Australia Oral Iron Supplements Market Revenue, By Form, 2025 – 2032 (USD Million)……325
TABLE NO. 279. : Australia Oral Iron Supplements Market Revenue, By Age Group, 2018 – 2024 (USD
Million)…………………………………………………………………………………………………………………..326
TABLE NO. 280. : Australia Oral Iron Supplements Market Revenue, By Age Group, 2025 – 2032 (USD
Million)…………………………………………………………………………………………………………………..327
TABLE NO. 281. : Australia Oral Iron Supplements Market Revenue, By Sales Channel, 2018 – 2024 (USD
Million)…………………………………………………………………………………………………………………..328
TABLE NO. 282. : Australia Oral Iron Supplements Market Revenue, By Sales Channel, 2025 – 2032 (USD
Million)…………………………………………………………………………………………………………………..328
TABLE NO. 283. : Thailand Oral Iron Supplements Market Revenue, By Type, 2018 – 2024 (USD Million) …….329
TABLE NO. 284. : Thailand Oral Iron Supplements Market Revenue, By Type, 2025 – 2032 (USD Million) …….329
TABLE NO. 285. : Thailand Oral Iron Supplements Market Revenue, By Application, 2018 – 2024 (USD
Million)…………………………………………………………………………………………………………………..330
TABLE NO. 286. : Thailand Oral Iron Supplements Market Revenue, By Application, 2025 – 2032 (USD
Million)…………………………………………………………………………………………………………………..330
TABLE NO. 287. : Thailand Oral Iron Supplements Market Revenue, By Form, 2018 – 2024 (USD Million) ……331
TABLE NO. 288. : Thailand Oral Iron Supplements Market Revenue, By Form, 2025 – 2032 (USD Million) ……331
43 | P a g e
GLOBAL ORAL IRON SUPPLEMENTS MARKET, 2018 – 2032
TABLE NO. 289. : Thailand Oral Iron Supplements Market Revenue, By Age Group, 2018 – 2024 (USD
Million)…………………………………………………………………………………………………………………..332
TABLE NO. 290. : Thailand Oral Iron Supplements Market Revenue, By Age Group, 2025 – 2032 (USD
Million)…………………………………………………………………………………………………………………..333
TABLE NO. 291. : Thailand Oral Iron Supplements Market Revenue, By Sales Channel, 2018 – 2024 (USD
Million)…………………………………………………………………………………………………………………..334
TABLE NO. 292. : Thailand Oral Iron Supplements Market Revenue, By Sales Channel, 2025 – 2032 (USD
Million)…………………………………………………………………………………………………………………..334
TABLE NO. 293. : Indonesia Oral Iron Supplements Market Revenue, By Type, 2018 – 2024 (USD Million) …..335
TABLE NO. 294. : Indonesia Oral Iron Supplements Market Revenue, By Type, 2025 – 2032 (USD Million) …..335
TABLE NO. 295. : Indonesia Oral Iron Supplements Market Revenue, By Application, 2018 – 2024 (USD
Million)…………………………………………………………………………………………………………………..336
TABLE NO. 296. : Indonesia Oral Iron Supplements Market Revenue, By Application, 2025 – 2032 (USD
Million)…………………………………………………………………………………………………………………..336
TABLE NO. 297. : Indonesia Oral Iron Supplements Market Revenue, By Form, 2018 – 2024 (USD Million)…..337
TABLE NO. 298. : Indonesia Oral Iron Supplements Market Revenue, By Form, 2025 – 2032 (USD Million)…..337
TABLE NO. 299. : Indonesia Oral Iron Supplements Market Revenue, By Age Group, 2018 – 2024 (USD
Million)…………………………………………………………………………………………………………………..338
TABLE NO. 300. : Indonesia Oral Iron Supplements Market Revenue, By Age Group, 2025 – 2032 (USD
Million)…………………………………………………………………………………………………………………..339
TABLE NO. 301. : Indonesia Oral Iron Supplements Market Revenue, By Sales Channel, 2018 – 2024 (USD
Million)…………………………………………………………………………………………………………………..340
TABLE NO. 302. : Indonesia Oral Iron Supplements Market Revenue, By Sales Channel, 2025 – 2032 (USD
Million)…………………………………………………………………………………………………………………..340
TABLE NO. 303. : Vietnam Oral Iron Supplements Market Revenue, By Type, 2018 – 2024 (USD Million) …….341
TABLE NO. 304. : Vietnam Oral Iron Supplements Market Revenue, By Type, 2025 – 2032 (USD Million) …….341
TABLE NO. 305. : Vietnam Oral Iron Supplements Market Revenue, By Application, 2018 – 2024 (USD
Million)…………………………………………………………………………………………………………………..342
TABLE NO. 306. : Vietnam Oral Iron Supplements Market Revenue, By Application, 2025 – 2032 (USD
Million)…………………………………………………………………………………………………………………..342
TABLE NO. 307. : Vietnam Oral Iron Supplements Market Revenue, By Form, 2018 – 2024 (USD Million)…….343
TABLE NO. 308. : Vietnam Oral Iron Supplements Market Revenue, By Form, 2025 – 2032 (USD Million)…….343
TABLE NO. 309. : Vietnam Oral Iron Supplements Market Revenue, By Age Group, 2018 – 2024 (USD
Million)…………………………………………………………………………………………………………………..344
TABLE NO. 310. : Vietnam Oral Iron Supplements Market Revenue, By Age Group, 2025 – 2032 (USD
Million)…………………………………………………………………………………………………………………..345
TABLE NO. 311. : Vietnam Oral Iron Supplements Market Revenue, By Sales Channel, 2018 – 2024 (USD
Million)…………………………………………………………………………………………………………………..346
TABLE NO. 312. : Vietnam Oral Iron Supplements Market Revenue, By Sales Channel, 2025 – 2032 (USD
Million)…………………………………………………………………………………………………………………..346
TABLE NO. 313. : Malaysia Oral Iron Supplements Market Revenue, By Type, 2018 – 2024 (USD Million)…….347
TABLE NO. 314. : Malaysia Oral Iron Supplements Market Revenue, By Type, 2025 – 2032 (USD Million)…….347
TABLE NO. 315. : Malaysia Oral Iron Supplements Market Revenue, By Application, 2018 – 2024 (USD
Million)…………………………………………………………………………………………………………………..348
44 | P a g e
GLOBAL ORAL IRON SUPPLEMENTS MARKET, 2018 – 2032
TABLE NO. 316. : Malaysia Oral Iron Supplements Market Revenue, By Application, 2025 – 2032 (USD
Million)…………………………………………………………………………………………………………………..348
TABLE NO. 317. : Malaysia Oral Iron Supplements Market Revenue, By Form, 2018 – 2024 (USD Million)……349
TABLE NO. 318. : Malaysia Oral Iron Supplements Market Revenue, By Form, 2025 – 2032 (USD Million)……349
TABLE NO. 319. : Malaysia Oral Iron Supplements Market Revenue, By Age Group, 2018 – 2024 (USD
Million)…………………………………………………………………………………………………………………..350
TABLE NO. 320. : Malaysia Oral Iron Supplements Market Revenue, By Age Group, 2025 – 2032 (USD
Million)…………………………………………………………………………………………………………………..351
TABLE NO. 321. : Malaysia Oral Iron Supplements Market Revenue, By Sales Channel, 2018 – 2024 (USD
Million)…………………………………………………………………………………………………………………..352
TABLE NO. 322. : Malaysia Oral Iron Supplements Market Revenue, By Sales Channel, 2025 – 2032 (USD
Million)…………………………………………………………………………………………………………………..352
TABLE NO. 323. : Philippines Oral Iron Supplements Market Revenue, By Type, 2018 – 2024 (USD Million) …353
TABLE NO. 324. : Philippines Oral Iron Supplements Market Revenue, By Type, 2025 – 2032 (USD Million) …353
TABLE NO. 325. : Philippines Oral Iron Supplements Market Revenue, By Application, 2018 – 2024 (USD
Million)…………………………………………………………………………………………………………………..354
TABLE NO. 326. : Philippines Oral Iron Supplements Market Revenue, By Application, 2025 – 2032 (USD
Million)…………………………………………………………………………………………………………………..354
TABLE NO. 327. : Philippines Oral Iron Supplements Market Revenue, By Form, 2018 – 2024 (USD Million)…355
TABLE NO. 328. : Philippines Oral Iron Supplements Market Revenue, By Form, 2025 – 2032 (USD Million)…355
TABLE NO. 329. : Philippines Oral Iron Supplements Market Revenue, By Age Group, 2018 – 2024 (USD
Million)…………………………………………………………………………………………………………………..356
TABLE NO. 330. : Philippines Oral Iron Supplements Market Revenue, By Age Group, 2025 – 2032 (USD
Million)…………………………………………………………………………………………………………………..357
TABLE NO. 331. : Philippines Oral Iron Supplements Market Revenue, By Sales Channel, 2018 – 2024 (USD
Million)…………………………………………………………………………………………………………………..358
TABLE NO. 332. : Philippines Oral Iron Supplements Market Revenue, By Sales Channel, 2025 – 2032 (USD
Million)…………………………………………………………………………………………………………………..358
TABLE NO. 333. : Taiwan Oral Iron Supplements Market Revenue, By Type, 2018 – 2024 (USD Million) ………359
TABLE NO. 334. : Taiwan Oral Iron Supplements Market Revenue, By Type, 2025 – 2032 (USD Million) ………359
TABLE NO. 335. : Taiwan Oral Iron Supplements Market Revenue, By Application, 2018 – 2024 (USD Million)360
TABLE NO. 336. : Taiwan Oral Iron Supplements Market Revenue, By Application, 2025 – 2032 (USD Million)360
TABLE NO. 337. : Taiwan Oral Iron Supplements Market Revenue, By Form, 2018 – 2024 (USD Million)………361
TABLE NO. 338. : Taiwan Oral Iron Supplements Market Revenue, By Form, 2025 – 2032 (USD Million)………361
TABLE NO. 339. : Taiwan Oral Iron Supplements Market Revenue, By Age Group, 2018 – 2024 (USD Million) 362
TABLE NO. 340. : Taiwan Oral Iron Supplements Market Revenue, By Age Group, 2025 – 2032 (USD Million) 363
TABLE NO. 341. : Taiwan Oral Iron Supplements Market Revenue, By Sales Channel, 2018 – 2024 (USD
Million)…………………………………………………………………………………………………………………..364
TABLE NO. 342. : Taiwan Oral Iron Supplements Market Revenue, By Sales Channel, 2025 – 2032 (USD
Million)…………………………………………………………………………………………………………………..364
TABLE NO. 343. : Rest of Asia Pacific Oral Iron Supplements Market Revenue, By Type, 2018 – 2024 (USD
Million)…………………………………………………………………………………………………………………..365
TABLE NO. 344. : Rest of Asia Pacific Oral Iron Supplements Market Revenue, By Type, 2025 – 2032 (USD
Million)…………………………………………………………………………………………………………………..365
45 | P a g e
GLOBAL ORAL IRON SUPPLEMENTS MARKET, 2018 – 2032
TABLE NO. 345. : Rest of Asia Pacific Oral Iron Supplements Market Revenue, By Application, 2018 – 2024
(USD Million)…………………………………………………………………………………………………………..366
TABLE NO. 346. : Rest of Asia Pacific Oral Iron Supplements Market Revenue, By Application, 2025 – 2032
(USD Million)…………………………………………………………………………………………………………..366
TABLE NO. 347. : Rest of Asia Pacific Oral Iron Supplements Market Revenue, By Form, 2018 – 2024 (USD
Million)…………………………………………………………………………………………………………………..367
TABLE NO. 348. : Rest of Asia Pacific Oral Iron Supplements Market Revenue, By Form, 2025 – 2032 (USD
Million)…………………………………………………………………………………………………………………..367
TABLE NO. 349. : Rest of Asia Pacific Oral Iron Supplements Market Revenue, By Age Group, 2018 – 2024
(USD Million)…………………………………………………………………………………………………………..368
TABLE NO. 350. : Rest of Asia Pacific Oral Iron Supplements Market Revenue, By Age Group, 2025 – 2032
(USD Million)…………………………………………………………………………………………………………..369
TABLE NO. 351. : Rest of Asia Pacific Oral Iron Supplements Market Revenue, By Sales Channel, 2018 –
2024 (USD Million) …………………………………………………………………………………………………..370
TABLE NO. 352. : Rest of Asia Pacific Oral Iron Supplements Market Revenue, By Sales Channel, 2025 –
2032 (USD Million) …………………………………………………………………………………………………..370
TABLE NO. 353. : Latin America Oral Iron Supplements Market Revenue, By Country, 2018 – 2024 (USD
Million)…………………………………………………………………………………………………………………..372
TABLE NO. 354. : Latin America Oral Iron Supplements Market Revenue, By Country, 2025 – 2032 (USD
Million)…………………………………………………………………………………………………………………..372
TABLE NO. 355. : Latin America Oral Iron Supplements Market Revenue, By Type, 2018 – 2024 (USD Million)373
TABLE NO. 356. : Latin America Oral Iron Supplements Market Revenue, By Type, 2025 – 2032 (USD Million)373
TABLE NO. 357. : Latin America Oral Iron Supplements Market Revenue, By Application, 2018 – 2024 (USD
Million)…………………………………………………………………………………………………………………..374
TABLE NO. 358. : Latin America Oral Iron Supplements Market Revenue, By Application, 2025 – 2032 (USD
Million)…………………………………………………………………………………………………………………..374
TABLE NO. 359. : Latin America Oral Iron Supplements Market Revenue, By Form, 2018 – 2024 (USD
Million)…………………………………………………………………………………………………………………..375
TABLE NO. 360. : Latin America Oral Iron Supplements Market Revenue, By Form, 2025 – 2032 (USD
Million)…………………………………………………………………………………………………………………..375
TABLE NO. 361. : Latin America Oral Iron Supplements Market Revenue, By Age Group, 2018 – 2024 (USD
Million)…………………………………………………………………………………………………………………..376
TABLE NO. 362. : Latin America Oral Iron Supplements Market Revenue, By Age Group, 2025 – 2032 (USD
Million)…………………………………………………………………………………………………………………..377
TABLE NO. 363. : Latin America Oral Iron Supplements Market Revenue, By Sales Channel, 2018 – 2024
(USD Million)…………………………………………………………………………………………………………..378
TABLE NO. 364. : Latin America Oral Iron Supplements Market Revenue, By Sales Channel, 2025 – 2032
(USD Million)…………………………………………………………………………………………………………..378
TABLE NO. 365. : Brazil Oral Iron Supplements Market Revenue, By Type, 2018 – 2024 (USD Million)…………379
TABLE NO. 366. : Brazil Oral Iron Supplements Market Revenue, By Type, 2025 – 2032 (USD Million)…………379
TABLE NO. 367. : Brazil Oral Iron Supplements Market Revenue, By Application, 2018 – 2024 (USD Million)..380
TABLE NO. 368. : Brazil Oral Iron Supplements Market Revenue, By Application, 2025 – 2032 (USD Million)..380
TABLE NO. 369. : Brazil Oral Iron Supplements Market Revenue, By Form, 2018 – 2024 (USD Million) ………..381
TABLE NO. 370. : Brazil Oral Iron Supplements Market Revenue, By Form, 2025 – 2032 (USD Million) ………..381
TABLE NO. 371. : Brazil Oral Iron Supplements Market Revenue, By Age Group, 2018 – 2024 (USD Million)…382
46 | P a g e
GLOBAL ORAL IRON SUPPLEMENTS MARKET, 2018 – 2032
TABLE NO. 372. : Brazil Oral Iron Supplements Market Revenue, By Age Group, 2025 – 2032 (USD Million)…383
TABLE NO. 373. : Brazil Oral Iron Supplements Market Revenue, By Sales Channel, 2018 – 2024 (USD
Million)…………………………………………………………………………………………………………………..384
TABLE NO. 374. : Brazil Oral Iron Supplements Market Revenue, By Sales Channel, 2025 – 2032 (USD
Million)…………………………………………………………………………………………………………………..384
TABLE NO. 375. : Argentina Oral Iron Supplements Market Revenue, By Type, 2018 – 2024 (USD Million)…..385
TABLE NO. 376. : Argentina Oral Iron Supplements Market Revenue, By Type, 2025 – 2032 (USD Million)…..385
TABLE NO. 377. : Argentina Oral Iron Supplements Market Revenue, By Application, 2018 – 2024 (USD
Million)…………………………………………………………………………………………………………………..386
TABLE NO. 378. : Argentina Oral Iron Supplements Market Revenue, By Application, 2025 – 2032 (USD
Million)…………………………………………………………………………………………………………………..386
TABLE NO. 379. : Argentina Oral Iron Supplements Market Revenue, By Form, 2018 – 2024 (USD Million) ….387
TABLE NO. 380. : Argentina Oral Iron Supplements Market Revenue, By Form, 2025 – 2032 (USD Million) ….387
TABLE NO. 381. : Argentina Oral Iron Supplements Market Revenue, By Age Group, 2018 – 2024 (USD
Million)…………………………………………………………………………………………………………………..388
TABLE NO. 382. : Argentina Oral Iron Supplements Market Revenue, By Age Group, 2025 – 2032 (USD
Million)…………………………………………………………………………………………………………………..389
TABLE NO. 383. : Argentina Oral Iron Supplements Market Revenue, By Sales Channel, 2018 – 2024 (USD
Million)…………………………………………………………………………………………………………………..390
TABLE NO. 384. : Argentina Oral Iron Supplements Market Revenue, By Sales Channel, 2025 – 2032 (USD
Million)…………………………………………………………………………………………………………………..390
TABLE NO. 385. : Peru Oral Iron Supplements Market Revenue, By Type, 2018 – 2024 (USD Million) ………….391
TABLE NO. 386. : Peru Oral Iron Supplements Market Revenue, By Type, 2025 – 2032 (USD Million) ………….391
TABLE NO. 387. : Peru Oral Iron Supplements Market Revenue, By Application, 2018 – 2024 (USD Million)…392
TABLE NO. 388. : Peru Oral Iron Supplements Market Revenue, By Application, 2025 – 2032 (USD Million)…392
TABLE NO. 389. : Peru Oral Iron Supplements Market Revenue, By Form, 2018 – 2024 (USD Million)………….393
TABLE NO. 390. : Peru Oral Iron Supplements Market Revenue, By Form, 2025 – 2032 (USD Million)………….393
TABLE NO. 391. : Peru Oral Iron Supplements Market Revenue, By Age Group, 2018 – 2024 (USD Million)….394
TABLE NO. 392. : Peru Oral Iron Supplements Market Revenue, By Age Group, 2025 – 2032 (USD Million)….395
TABLE NO. 393. : Peru Oral Iron Supplements Market Revenue, By Sales Channel, 2018 – 2024 (USD Million)396
TABLE NO. 394. : Peru Oral Iron Supplements Market Revenue, By Sales Channel, 2025 – 2032 (USD Million)396
TABLE NO. 395. : Chile Oral Iron Supplements Market Revenue, By Type, 2018 – 2024 (USD Million)………….397
TABLE NO. 396. : Chile Oral Iron Supplements Market Revenue, By Type, 2025 – 2032 (USD Million)………….397
TABLE NO. 397. : Chile Oral Iron Supplements Market Revenue, By Application, 2018 – 2024 (USD Million) ..398
TABLE NO. 398. : Chile Oral Iron Supplements Market Revenue, By Application, 2025 – 2032 (USD Million) ..398
TABLE NO. 399. : Chile Oral Iron Supplements Market Revenue, By Form, 2018 – 2024 (USD Million) …………399
TABLE NO. 400. : Chile Oral Iron Supplements Market Revenue, By Form, 2025 – 2032 (USD Million) …………399
TABLE NO. 401. : Chile Oral Iron Supplements Market Revenue, By Age Group, 2018 – 2024 (USD Million)….400
TABLE NO. 402. : Chile Oral Iron Supplements Market Revenue, By Age Group, 2025 – 2032 (USD Million)….401
TABLE NO. 403. : Chile Oral Iron Supplements Market Revenue, By Sales Channel, 2018 – 2024 (USD
Million)…………………………………………………………………………………………………………………..402
TABLE NO. 404. : Chile Oral Iron Supplements Market Revenue, By Sales Channel, 2025 – 2032 (USD
Million)…………………………………………………………………………………………………………………..402
TABLE NO. 405. : Colombia Oral Iron Supplements Market Revenue, By Type, 2018 – 2024 (USD Million)……403
TABLE NO. 406. : Colombia Oral Iron Supplements Market Revenue, By Type, 2025 – 2032 (USD Million)……403
47 | P a g e
GLOBAL ORAL IRON SUPPLEMENTS MARKET, 2018 – 2032
TABLE NO. 407. : Colombia Oral Iron Supplements Market Revenue, By Application, 2018 – 2024 (USD
Million)…………………………………………………………………………………………………………………..404
TABLE NO. 408. : Colombia Oral Iron Supplements Market Revenue, By Application, 2025 – 2032 (USD
Million)…………………………………………………………………………………………………………………..404
TABLE NO. 409. : Colombia Oral Iron Supplements Market Revenue, By Form, 2018 – 2024 (USD Million)…..405
TABLE NO. 410. : Colombia Oral Iron Supplements Market Revenue, By Form, 2025 – 2032 (USD Million)…..405
TABLE NO. 411. : Colombia Oral Iron Supplements Market Revenue, By Age Group, 2018 – 2024 (USD
Million)…………………………………………………………………………………………………………………..406
TABLE NO. 412. : Colombia Oral Iron Supplements Market Revenue, By Age Group, 2025 – 2032 (USD
Million)…………………………………………………………………………………………………………………..407
TABLE NO. 413. : Colombia Oral Iron Supplements Market Revenue, By Sales Channel, 2018 – 2024 (USD
Million)…………………………………………………………………………………………………………………..408
TABLE NO. 414. : Colombia Oral Iron Supplements Market Revenue, By Sales Channel, 2025 – 2032 (USD
Million)…………………………………………………………………………………………………………………..408
TABLE NO. 415. : Rest of Latin America Oral Iron Supplements Market Revenue, By Type, 2018 – 2024 (USD
Million)…………………………………………………………………………………………………………………..409
TABLE NO. 416. : Rest of Latin America Oral Iron Supplements Market Revenue, By Type, 2025 – 2032 (USD
Million)…………………………………………………………………………………………………………………..409
TABLE NO. 417. : Rest of Latin America Oral Iron Supplements Market Revenue, By Application, 2018 –
2024 (USD Million) …………………………………………………………………………………………………..410
TABLE NO. 418. : Rest of Latin America Oral Iron Supplements Market Revenue, By Application, 2025 –
2032 (USD Million) …………………………………………………………………………………………………..410
TABLE NO. 419. : Rest of Latin America Oral Iron Supplements Market Revenue, By Form, 2018 – 2024 (USD
Million)…………………………………………………………………………………………………………………..411
TABLE NO. 420. : Rest of Latin America Oral Iron Supplements Market Revenue, By Form, 2025 – 2032 (USD
Million)…………………………………………………………………………………………………………………..411
TABLE NO. 421. : Rest of Latin America Oral Iron Supplements Market Revenue, By Age Group, 2018 – 2024
(USD Million)…………………………………………………………………………………………………………..412
TABLE NO. 422. : Rest of Latin America Oral Iron Supplements Market Revenue, By Age Group, 2025 – 2032
(USD Million)…………………………………………………………………………………………………………..413
TABLE NO. 423. : Rest of Latin America Oral Iron Supplements Market Revenue, By Sales Channel, 2018 –
2024 (USD Million) …………………………………………………………………………………………………..414
TABLE NO. 424. : Rest of Latin America Oral Iron Supplements Market Revenue, By Sales Channel, 2025 –
2032 (USD Million) …………………………………………………………………………………………………..414
TABLE NO. 425. : Middle East Oral Iron Supplements Market Revenue, By Country, 2018 – 2024 (USD
Million)…………………………………………………………………………………………………………………..416
TABLE NO. 426. : Middle East Oral Iron Supplements Market Revenue, By Country, 2025 – 2032 (USD
Million)…………………………………………………………………………………………………………………..416
TABLE NO. 427. : Middle East Oral Iron Supplements Market Revenue, By Type, 2018 – 2024 (USD Million)..417
TABLE NO. 428. : Middle East Oral Iron Supplements Market Revenue, By Type, 2025 – 2032 (USD Million)..417
TABLE NO. 429. : Middle East Oral Iron Supplements Market Revenue, By Application, 2018 – 2024 (USD
Million)…………………………………………………………………………………………………………………..418
TABLE NO. 430. : Middle East Oral Iron Supplements Market Revenue, By Application, 2025 – 2032 (USD
Million)…………………………………………………………………………………………………………………..418
TABLE NO. 431. : Middle East Oral Iron Supplements Market Revenue, By Form, 2018 – 2024 (USD Million) .419
48 | P a g e
GLOBAL ORAL IRON SUPPLEMENTS MARKET, 2018 – 2032
TABLE NO. 432. : Middle East Oral Iron Supplements Market Revenue, By Form, 2025 – 2032 (USD Million) .419
TABLE NO. 433. : Middle East Oral Iron Supplements Market Revenue, By Age Group, 2018 – 2024 (USD
Million)…………………………………………………………………………………………………………………..420
TABLE NO. 434. : Middle East Oral Iron Supplements Market Revenue, By Age Group, 2025 – 2032 (USD
Million)…………………………………………………………………………………………………………………..421
TABLE NO. 435. : Middle East Oral Iron Supplements Market Revenue, By Sales Channel, 2018 – 2024 (USD
Million)…………………………………………………………………………………………………………………..422
TABLE NO. 436. : Middle East Oral Iron Supplements Market Revenue, By Sales Channel, 2025 – 2032 (USD
Million)…………………………………………………………………………………………………………………..422
TABLE NO. 437. : UAE Oral Iron Supplements Market Revenue, By Type, 2018 – 2024 (USD Million) …………..423
TABLE NO. 438. : UAE Oral Iron Supplements Market Revenue, By Type, 2025 – 2032 (USD Million) …………..423
TABLE NO. 439. : UAE Oral Iron Supplements Market Revenue, By Application, 2018 – 2024 (USD Million)….424
TABLE NO. 440. : UAE Oral Iron Supplements Market Revenue, By Application, 2025 – 2032 (USD Million)….424
TABLE NO. 441. : UAE Oral Iron Supplements Market Revenue, By Form, 2018 – 2024 (USD Million) ………….425
TABLE NO. 442. : UAE Oral Iron Supplements Market Revenue, By Form, 2025 – 2032 (USD Million) ………….425
TABLE NO. 443. : UAE Oral Iron Supplements Market Revenue, By Age Group, 2018 – 2024 (USD Million)…..426
TABLE NO. 444. : UAE Oral Iron Supplements Market Revenue, By Age Group, 2025 – 2032 (USD Million)…..427
TABLE NO. 445. : UAE Oral Iron Supplements Market Revenue, By Sales Channel, 2018 – 2024 (USD Million)428
TABLE NO. 446. : UAE Oral Iron Supplements Market Revenue, By Sales Channel, 2025 – 2032 (USD Million)428
TABLE NO. 447. : KSA Oral Iron Supplements Market Revenue, By Type, 2018 – 2024 (USD Million)……………429
TABLE NO. 448. : KSA Oral Iron Supplements Market Revenue, By Type, 2025 – 2032 (USD Million)……………429
TABLE NO. 449. : KSA Oral Iron Supplements Market Revenue, By Application, 2018 – 2024 (USD Million) ….430
TABLE NO. 450. : KSA Oral Iron Supplements Market Revenue, By Application, 2025 – 2032 (USD Million) ….430
TABLE NO. 451. : KSA Oral Iron Supplements Market Revenue, By Form, 2018 – 2024 (USD Million)…………..431
TABLE NO. 452. : KSA Oral Iron Supplements Market Revenue, By Form, 2025 – 2032 (USD Million)…………..431
TABLE NO. 453. : KSA Oral Iron Supplements Market Revenue, By Age Group, 2018 – 2024 (USD Million) …..432
TABLE NO. 454. : KSA Oral Iron Supplements Market Revenue, By Age Group, 2025 – 2032 (USD Million) …..433
TABLE NO. 455. : KSA Oral Iron Supplements Market Revenue, By Sales Channel, 2018 – 2024 (USD Million) 434
TABLE NO. 456. : KSA Oral Iron Supplements Market Revenue, By Sales Channel, 2025 – 2032 (USD Million) 434
TABLE NO. 457. : Israel Oral Iron Supplements Market Revenue, By Type, 2018 – 2024 (USD Million) …………435
TABLE NO. 458. : Israel Oral Iron Supplements Market Revenue, By Type, 2025 – 2032 (USD Million) …………435
TABLE NO. 459. : Israel Oral Iron Supplements Market Revenue, By Application, 2018 – 2024 (USD Million)..436
TABLE NO. 460. : Israel Oral Iron Supplements Market Revenue, By Application, 2025 – 2032 (USD Million)..436
TABLE NO. 461. : Israel Oral Iron Supplements Market Revenue, By Form, 2018 – 2024 (USD Million)…………437
TABLE NO. 462. : Israel Oral Iron Supplements Market Revenue, By Form, 2025 – 2032 (USD Million)…………437
TABLE NO. 463. : Israel Oral Iron Supplements Market Revenue, By Age Group, 2018 – 2024 (USD Million)…438
TABLE NO. 464. : Israel Oral Iron Supplements Market Revenue, By Age Group, 2025 – 2032 (USD Million)…439
TABLE NO. 465. : Israel Oral Iron Supplements Market Revenue, By Sales Channel, 2018 – 2024 (USD
Million)…………………………………………………………………………………………………………………..440
TABLE NO. 466. : Israel Oral Iron Supplements Market Revenue, By Sales Channel, 2025 – 2032 (USD
Million)…………………………………………………………………………………………………………………..440
TABLE NO. 467. : Turkey Oral Iron Supplements Market Revenue, By Type, 2018 – 2024 (USD Million)……….441
TABLE NO. 468. : Turkey Oral Iron Supplements Market Revenue, By Type, 2025 – 2032 (USD Million)……….441
TABLE NO. 469. : Turkey Oral Iron Supplements Market Revenue, By Application, 2018 – 2024 (USD Million)442
TABLE NO. 470. : Turkey Oral Iron Supplements Market Revenue, By Application, 2025 – 2032 (USD Million)442
49 | P a g e
GLOBAL ORAL IRON SUPPLEMENTS MARKET, 2018 – 2032
TABLE NO. 471. : Turkey Oral Iron Supplements Market Revenue, By Form, 2018 – 2024 (USD Million) ………443
TABLE NO. 472. : Turkey Oral Iron Supplements Market Revenue, By Form, 2025 – 2032 (USD Million) ………443
TABLE NO. 473. : Turkey Oral Iron Supplements Market Revenue, By Age Group, 2018 – 2024 (USD Million).444
TABLE NO. 474. : Turkey Oral Iron Supplements Market Revenue, By Age Group, 2025 – 2032 (USD Million).445
TABLE NO. 475. : Turkey Oral Iron Supplements Market Revenue, By Sales Channel, 2018 – 2024 (USD
Million)…………………………………………………………………………………………………………………..446
TABLE NO. 476. : Turkey Oral Iron Supplements Market Revenue, By Sales Channel, 2025 – 2032 (USD
Million)…………………………………………………………………………………………………………………..446
TABLE NO. 477. : Iran Oral Iron Supplements Market Revenue, By Type, 2018 – 2024 (USD Million)……………447
TABLE NO. 478. : Iran Oral Iron Supplements Market Revenue, By Type, 2025 – 2032 (USD Million)……………447
TABLE NO. 479. : Iran Oral Iron Supplements Market Revenue, By Application, 2018 – 2024 (USD Million)….448
TABLE NO. 480. : Iran Oral Iron Supplements Market Revenue, By Application, 2025 – 2032 (USD Million)….448
TABLE NO. 481. : Iran Oral Iron Supplements Market Revenue, By Form, 2018 – 2024 (USD Million)…………..449
TABLE NO. 482. : Iran Oral Iron Supplements Market Revenue, By Form, 2025 – 2032 (USD Million)…………..449
TABLE NO. 483. : Iran Oral Iron Supplements Market Revenue, By Age Group, 2018 – 2024 (USD Million) …..450
TABLE NO. 484. : Iran Oral Iron Supplements Market Revenue, By Age Group, 2025 – 2032 (USD Million) …..451
TABLE NO. 485. : Iran Oral Iron Supplements Market Revenue, By Sales Channel, 2018 – 2024 (USD Million) 452
TABLE NO. 486. : Iran Oral Iron Supplements Market Revenue, By Sales Channel, 2025 – 2032 (USD Million) 452
TABLE NO. 487. : Rest of Middle East Oral Iron Supplements Market Revenue, By Type, 2018 – 2024 (USD
Million)…………………………………………………………………………………………………………………..453
TABLE NO. 488. : Rest of Middle East Oral Iron Supplements Market Revenue, By Type, 2025 – 2032 (USD
Million)…………………………………………………………………………………………………………………..453
TABLE NO. 489. : Rest of Middle East Oral Iron Supplements Market Revenue, By Application, 2018 – 2024
(USD Million)…………………………………………………………………………………………………………..454
TABLE NO. 490. : Rest of Middle East Oral Iron Supplements Market Revenue, By Application, 2025 – 2032
(USD Million)…………………………………………………………………………………………………………..454
TABLE NO. 491. : Rest of Middle East Oral Iron Supplements Market Revenue, By Form, 2018 – 2024 (USD
Million)…………………………………………………………………………………………………………………..455
TABLE NO. 492. : Rest of Middle East Oral Iron Supplements Market Revenue, By Form, 2025 – 2032 (USD
Million)…………………………………………………………………………………………………………………..455
TABLE NO. 493. : Rest of Middle East Oral Iron Supplements Market Revenue, By Age Group, 2018 – 2024
(USD Million)…………………………………………………………………………………………………………..456
TABLE NO. 494. : Rest of Middle East Oral Iron Supplements Market Revenue, By Age Group, 2025 – 2032
(USD Million)…………………………………………………………………………………………………………..457
TABLE NO. 495. : Rest of Middle East Oral Iron Supplements Market Revenue, By Sales Channel, 2018 –
2024 (USD Million) …………………………………………………………………………………………………..458
TABLE NO. 496. : Rest of Middle East Oral Iron Supplements Market Revenue, By Sales Channel, 2025 –
2032 (USD Million) …………………………………………………………………………………………………..458
TABLE NO. 497. : Africa Oral Iron Supplements Market Revenue, By Country, 2018 – 2024 (USD Million) ……460
TABLE NO. 498. : Africa Oral Iron Supplements Market Revenue, By Country, 2025 – 2032 (USD Million) ……460
TABLE NO. 499. : Africa Oral Iron Supplements Market Revenue, By Type, 2018 – 2024 (USD Million)…………461
TABLE NO. 500. : Africa Oral Iron Supplements Market Revenue, By Type, 2025 – 2032 (USD Million)…………461
TABLE NO. 501. : Africa Oral Iron Supplements Market Revenue, By Application, 2018 – 2024 (USD Million).462
TABLE NO. 502. : Africa Oral Iron Supplements Market Revenue, By Application, 2025 – 2032 (USD Million).462
TABLE NO. 503. : Africa Oral Iron Supplements Market Revenue, By Form, 2018 – 2024 (USD Million)………..463
50 | P a g e
GLOBAL ORAL IRON SUPPLEMENTS MARKET, 2018 – 2032
TABLE NO. 504. : Africa Oral Iron Supplements Market Revenue, By Form, 2025 – 2032 (USD Million)………..463
TABLE NO. 505. : Africa Oral Iron Supplements Market Revenue, By Age Group, 2018 – 2024 (USD Million) ..464
TABLE NO. 506. : Africa Oral Iron Supplements Market Revenue, By Age Group, 2025 – 2032 (USD Million) ..465
TABLE NO. 507. : Africa Oral Iron Supplements Market Revenue, By Sales Channel, 2018 – 2024 (USD
Million)…………………………………………………………………………………………………………………..466
TABLE NO. 508. : Africa Oral Iron Supplements Market Revenue, By Sales Channel, 2025 – 2032 (USD
Million)…………………………………………………………………………………………………………………..466
TABLE NO. 509. : South Africa Oral Iron Supplements Market Revenue, By Type, 2018 – 2024 (USD Million) .467
TABLE NO. 510. : South Africa Oral Iron Supplements Market Revenue, By Type, 2025 – 2032 (USD Million) .467
TABLE NO. 511. : South Africa Oral Iron Supplements Market Revenue, By Application, 2018 – 2024 (USD
Million)…………………………………………………………………………………………………………………..468
TABLE NO. 512. : South Africa Oral Iron Supplements Market Revenue, By Application, 2025 – 2032 (USD
Million)…………………………………………………………………………………………………………………..468
TABLE NO. 513. : South Africa Oral Iron Supplements Market Revenue, By Form, 2018 – 2024 (USD Million).469
TABLE NO. 514. : South Africa Oral Iron Supplements Market Revenue, By Form, 2025 – 2032 (USD Million).469
TABLE NO. 515. : South Africa Oral Iron Supplements Market Revenue, By Age Group, 2018 – 2024 (USD
Million)…………………………………………………………………………………………………………………..470
TABLE NO. 516. : South Africa Oral Iron Supplements Market Revenue, By Age Group, 2025 – 2032 (USD
Million)…………………………………………………………………………………………………………………..471
TABLE NO. 517. : South Africa Oral Iron Supplements Market Revenue, By Sales Channel, 2018 – 2024 (USD
Million)…………………………………………………………………………………………………………………..472
TABLE NO. 518. : South Africa Oral Iron Supplements Market Revenue, By Sales Channel, 2025 – 2032 (USD
Million)…………………………………………………………………………………………………………………..472
TABLE NO. 519. : Egypt Oral Iron Supplements Market Revenue, By Type, 2018 – 2024 (USD Million)…………473
TABLE NO. 520. : Egypt Oral Iron Supplements Market Revenue, By Type, 2025 – 2032 (USD Million)…………473
TABLE NO. 521. : Egypt Oral Iron Supplements Market Revenue, By Application, 2018 – 2024 (USD Million) .474
TABLE NO. 522. : Egypt Oral Iron Supplements Market Revenue, By Application, 2025 – 2032 (USD Million) .474
TABLE NO. 523. : Egypt Oral Iron Supplements Market Revenue, By Form, 2018 – 2024 (USD Million) ………..475
TABLE NO. 524. : Egypt Oral Iron Supplements Market Revenue, By Form, 2025 – 2032 (USD Million) ………..475
TABLE NO. 525. : Egypt Oral Iron Supplements Market Revenue, By Age Group, 2018 – 2024 (USD Million)…476
TABLE NO. 526. : Egypt Oral Iron Supplements Market Revenue, By Age Group, 2025 – 2032 (USD Million)…477
TABLE NO. 527. : Egypt Oral Iron Supplements Market Revenue, By Sales Channel, 2018 – 2024 (USD
Million)…………………………………………………………………………………………………………………..478
TABLE NO. 528. : Egypt Oral Iron Supplements Market Revenue, By Sales Channel, 2025 – 2032 (USD
Million)…………………………………………………………………………………………………………………..478
TABLE NO. 529. : Nigeria Oral Iron Supplements Market Revenue, By Type, 2018 – 2024 (USD Million) ………479
TABLE NO. 530. : Nigeria Oral Iron Supplements Market Revenue, By Type, 2025 – 2032 (USD Million) ………479
TABLE NO. 531. : Nigeria Oral Iron Supplements Market Revenue, By Application, 2018 – 2024 (USD Million)480
TABLE NO. 532. : Nigeria Oral Iron Supplements Market Revenue, By Application, 2025 – 2032 (USD Million)480
TABLE NO. 533. : Nigeria Oral Iron Supplements Market Revenue, By Form, 2018 – 2024 (USD Million)………481
TABLE NO. 534. : Nigeria Oral Iron Supplements Market Revenue, By Form, 2025 – 2032 (USD Million)………481
TABLE NO. 535. : Nigeria Oral Iron Supplements Market Revenue, By Age Group, 2018 – 2024 (USD Million) 482
TABLE NO. 536. : Nigeria Oral Iron Supplements Market Revenue, By Age Group, 2025 – 2032 (USD Million) 483
TABLE NO. 537. : Nigeria Oral Iron Supplements Market Revenue, By Sales Channel, 2018 – 2024 (USD
Million)…………………………………………………………………………………………………………………..484
51 | P a g e
GLOBAL ORAL IRON SUPPLEMENTS MARKET, 2018 – 2032
TABLE NO. 538. : Nigeria Oral Iron Supplements Market Revenue, By Sales Channel, 2025 – 2032 (USD
Million)…………………………………………………………………………………………………………………..484
TABLE NO. 539. : Algeria Oral Iron Supplements Market Revenue, By Type, 2018 – 2024 (USD Million)……….485
TABLE NO. 540. : Algeria Oral Iron Supplements Market Revenue, By Type, 2025 – 2032 (USD Million)……….485
TABLE NO. 541. : Algeria Oral Iron Supplements Market Revenue, By Application, 2018 – 2024 (USD Million)486
TABLE NO. 542. : Algeria Oral Iron Supplements Market Revenue, By Application, 2025 – 2032 (USD Million)486
TABLE NO. 543. : Algeria Oral Iron Supplements Market Revenue, By Form, 2018 – 2024 (USD Million)………487
TABLE NO. 544. : Algeria Oral Iron Supplements Market Revenue, By Form, 2025 – 2032 (USD Million)………487
TABLE NO. 545. : Algeria Oral Iron Supplements Market Revenue, By Age Group, 2018 – 2024 (USD Million) 488
TABLE NO. 546. : Algeria Oral Iron Supplements Market Revenue, By Age Group, 2025 – 2032 (USD Million) 489
TABLE NO. 547. : Algeria Oral Iron Supplements Market Revenue, By Sales Channel, 2018 – 2024 (USD
Million)…………………………………………………………………………………………………………………..490
TABLE NO. 548. : Algeria Oral Iron Supplements Market Revenue, By Sales Channel, 2025 – 2032 (USD
Million)…………………………………………………………………………………………………………………..490
TABLE NO. 549. : Morocco Oral Iron Supplements Market Revenue, By Type, 2018 – 2024 (USD Million)…….491
TABLE NO. 550. : Morocco Oral Iron Supplements Market Revenue, By Type, 2025 – 2032 (USD Million)…….491
TABLE NO. 551. : Morocco Oral Iron Supplements Market Revenue, By Application, 2018 – 2024 (USD
Million)…………………………………………………………………………………………………………………..492
TABLE NO. 552. : Morocco Oral Iron Supplements Market Revenue, By Application, 2025 – 2032 (USD
Million)…………………………………………………………………………………………………………………..492
TABLE NO. 553. : Morocco Oral Iron Supplements Market Revenue, By Form, 2018 – 2024 (USD Million)……493
TABLE NO. 554. : Morocco Oral Iron Supplements Market Revenue, By Form, 2025 – 2032 (USD Million)……493
TABLE NO. 555. : Morocco Oral Iron Supplements Market Revenue, By Age Group, 2018 – 2024 (USD
Million)…………………………………………………………………………………………………………………..494
TABLE NO. 556. : Morocco Oral Iron Supplements Market Revenue, By Age Group, 2025 – 2032 (USD
Million)…………………………………………………………………………………………………………………..495
TABLE NO. 557. : Morocco Oral Iron Supplements Market Revenue, By Sales Channel, 2018 – 2024 (USD
Million)…………………………………………………………………………………………………………………..496
TABLE NO. 558. : Morocco Oral Iron Supplements Market Revenue, By Sales Channel, 2025 – 2032 (USD
Million)…………………………………………………………………………………………………………………..496
TABLE NO. 559. : Rest of Africa Oral Iron Supplements Market Revenue, By Type, 2018 – 2024 (USD Million)497
TABLE NO. 560. : Rest of Africa Oral Iron Supplements Market Revenue, By Type, 2025 – 2032 (USD Million)497
TABLE NO. 561. : Rest of Africa Oral Iron Supplements Market Revenue, By Application, 2018 – 2024 (USD
Million)…………………………………………………………………………………………………………………..498
TABLE NO. 562. : Rest of Africa Oral Iron Supplements Market Revenue, By Application, 2025 – 2032 (USD
Million)…………………………………………………………………………………………………………………..498
TABLE NO. 563. : Rest of Africa Oral Iron Supplements Market Revenue, By Form, 2018 – 2024 (USD
Million)…………………………………………………………………………………………………………………..499
TABLE NO. 564. : Rest of Africa Oral Iron Supplements Market Revenue, By Form, 2025 – 2032 (USD
Million)…………………………………………………………………………………………………………………..499
TABLE NO. 565. : Rest of Africa Oral Iron Supplements Market Revenue, By Age Group, 2018 – 2024 (USD
Million)…………………………………………………………………………………………………………………..500
TABLE NO. 566. : Rest of Africa Oral Iron Supplements Market Revenue, By Age Group, 2025 – 2032 (USD
Million)…………………………………………………………………………………………………………………..501
52 | P a g e
GLOBAL ORAL IRON SUPPLEMENTS MARKET, 2018 – 2032
TABLE NO. 567. : Rest of Africa Oral Iron Supplements Market Revenue, By Sales Channel, 2018 – 2024
(USD Million)…………………………………………………………………………………………………………..502
TABLE NO. 568. : Rest of Africa Oral Iron Supplements Market Revenue, By Sales Channel, 2025 – 2032
(USD Million)…………………………………………………………………………………………………………..502