Market Overview
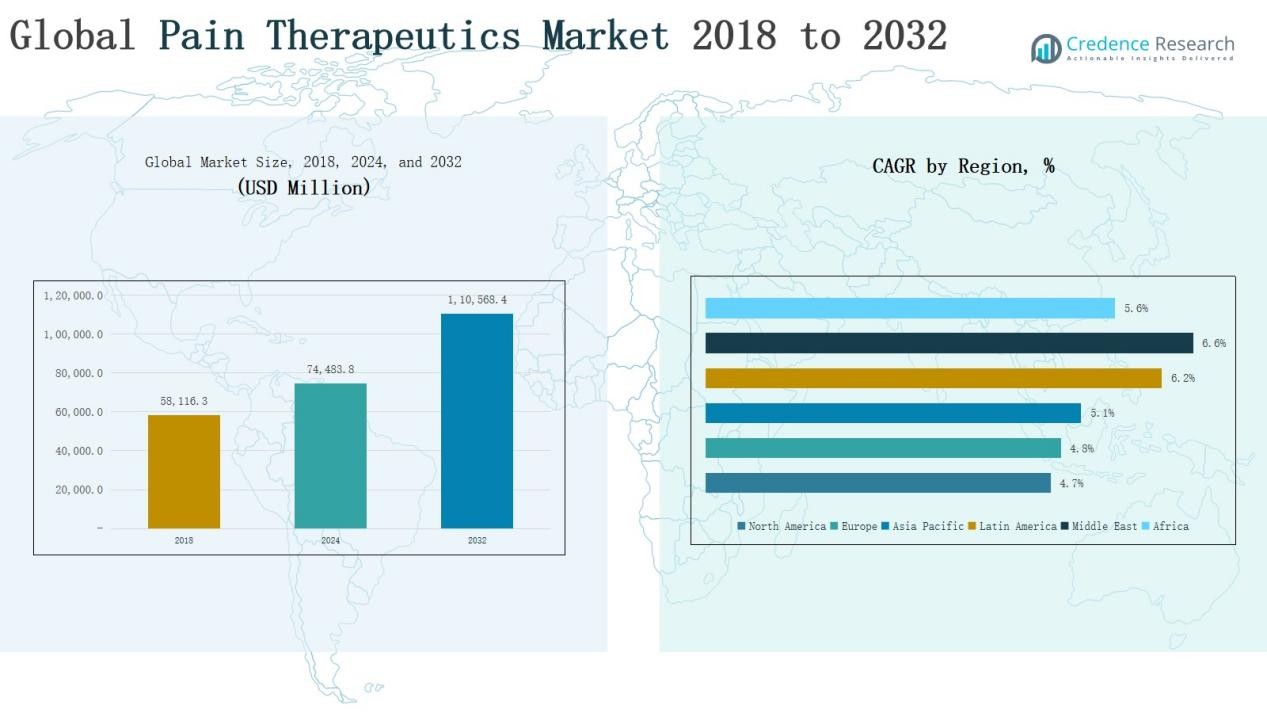
Global Pain Therapeutics Market size was valued at USD 58,116.3 million in 2018 to USD 74,483.8 million in 2024 and is anticipated to reach USD 1,10,568.4 million by 2032, at a CAGR of 5.12% during the forecast period.
| REPORT ATTRIBUTE |
DETAILS |
| Historical Period |
2020-2023 |
| Base Year |
2024 |
| Forecast Period |
2025-2032 |
| Pain Therapeutics Market Size 2024 |
USD 74,483.8 Million |
| Pain Therapeutics Market, CAGR |
5.12% |
| Pain Therapeutics Market Size 2032 |
USD 1,10,568.4 Million |
The Global Pain Therapeutics Market is driven by major players including Abbott, Pfizer Inc., AstraZeneca plc, Boston Scientific Corporation, Bristol-Myers Squibb and Company, Eli Lilly and Company, GSK plc, Merck & Co. Inc., Purdue Pharma L.P., and Sanofi S.A., alongside several regional and generic manufacturers. These companies maintain leadership through broad drug portfolios, strong R&D pipelines, and strategic collaborations aimed at expanding non-opioid and personalized therapies. Among regions, Asia Pacific emerged as the leader in 2024 with a 35.9% market share, supported by rapid healthcare expansion, a large patient base, and growing demand for modern pain management solutions.
Access crucial information at unmatched prices!
Request your sample report today & start making informed decisions powered by Credence Research Inc.!
Download Sample
Market Insights
- The Global Pain Therapeutics Market grew from USD 58,116.3 million in 2018 to USD 74,483.8 million in 2024, and is projected to reach USD 1,10,568.4 million by 2032.
- Opioid analgesics dominated with 41% share in 2024, while non-opioids including NSAIDs (21%) and acetaminophen (11%) gained traction as safer alternatives.
- Nociceptive pain led applications with 52% share in 2024, followed by neuropathic pain at 34% and psychogenic pain at 14%.
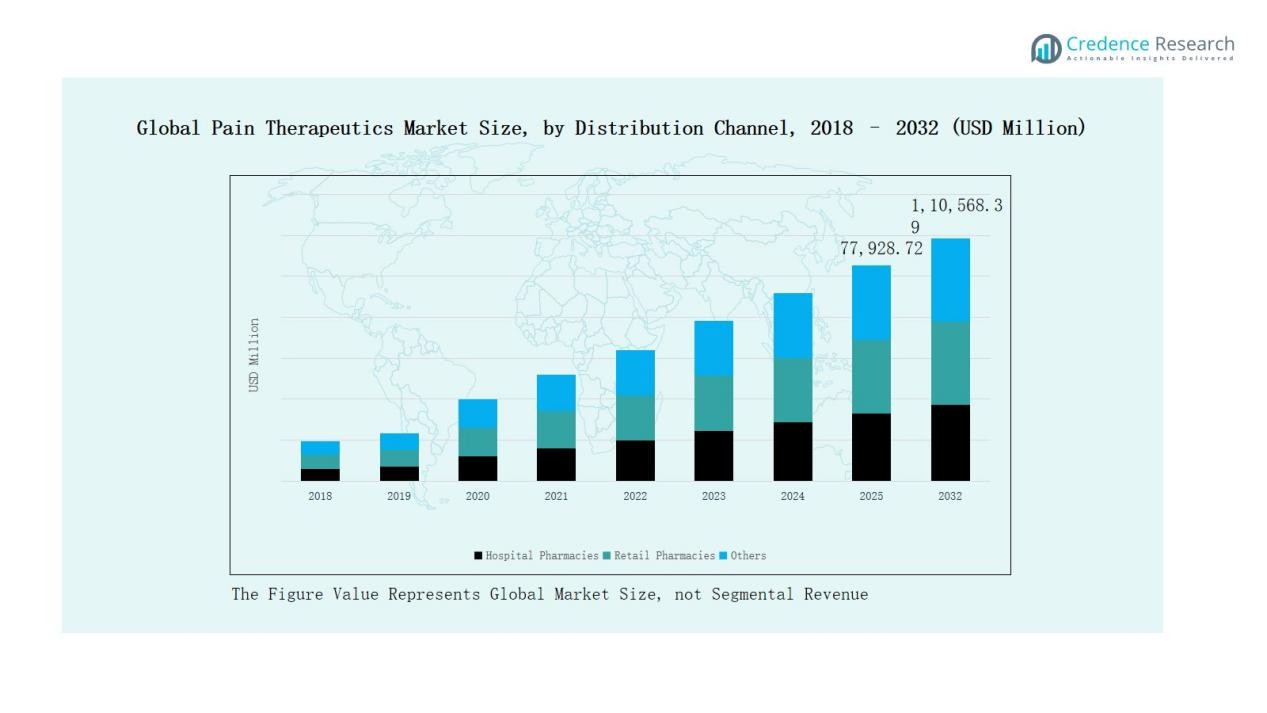
- Hospital pharmacies accounted for 49% of distribution in 2024, with retail pharmacies at 37% and others, including online platforms, contributing 14%.
- Asia Pacific led the market with 35.9% share in 2024, followed by Europe at 29.4% and North America at 19.3%, reflecting strong global demand.
Market Segment Insights
By Drug Class
The Global Pain Therapeutics Market by drug class is led by opioid analgesics, holding a 41% share in 2024. Their dominance stems from widespread use in treating moderate to severe chronic pain, particularly in oncology and post-surgical care. Non-opioid analgesics account for a 32% share, with NSAIDs contributing 21% and acetaminophen 11%, driven by rising demand for safer alternatives to opioids. Antidepressants capture 15% of the market, supported by their expanding use in neuropathic pain management. Other drug classes represent the remaining 12%, reflecting niche but growing applications in targeted therapies.
- For instance, in April 2024, Pfizer and Acura Pharmaceuticals announced FDA approval of OXECTA, an immediate-release oxycodone tablets with tamper-deterrent technology, indicated for acute and chronic moderate to severe pain.
By Application
In application segmentation, nociceptive pain dominates with a 52% share in 2024, supported by the high prevalence of musculoskeletal disorders, arthritis, and injury-related conditions. Neuropathic pain holds a 34% share, propelled by increasing cases of diabetic neuropathy, multiple sclerosis, and chemotherapy-induced pain. Psychogenic pain accounts for 14%, with gradual growth as awareness rises regarding psychosomatic conditions and the integration of mental health into pain management strategies.
- For instance, Kaia Health’s digital therapeutics app, combining cognitive-behavioral therapy (CBT) and AI-driven coaching, showed effectiveness in managing chronic pain including psychogenic types, highlighting mental health’s role in pain relief.
By Distribution Channel
The market by distribution channel is led by hospital pharmacies, which hold a 49% share in 2024 due to the strong reliance on hospital settings for post-operative pain care and chronic disease management. Retail pharmacies follow with a 37% share, driven by easy access to prescription and OTC drugs for self-management of pain. The others category, including online pharmacies and specialty clinics, contributes 14%, reflecting steady growth fueled by digital health adoption and patient preference for home delivery of medications.

Key Growth Drivers
Rising Prevalence of Chronic Pain Disorders
The rising burden of chronic conditions such as arthritis, cancer, and lower back pain significantly drives demand for pain therapeutics. An aging global population further intensifies the need for long-term pain management solutions. Growing awareness of early treatment options has accelerated the uptake of both opioid and non-opioid drugs. This trend positions chronic pain therapies as a critical growth driver, strengthening the overall market outlook.
- For instance, Eli Lilly launched its injectable therapy Zepbound (tirzepatide) for obesity and related conditions, and clinical studies reported secondary benefits in pain and mobility improvements among patients with severe joint stress.
Expansion of Non-Opioid Therapeutics
Increasing concerns regarding opioid dependence and stringent prescribing guidelines have fueled the demand for non-opioid alternatives. NSAIDs, acetaminophen, and antidepressants are gaining strong adoption as safer long-term options. Pharmaceutical innovation focusing on novel non-addictive drugs continues to expand the therapeutic landscape. This shift is reshaping prescribing patterns and driving revenue growth across non-opioid drug classes.
- For instance,Vertex Pharmaceuticals reported Phase 2 trial success for VX-548, a novel oral NaV1.8 inhibitor for acute pain, showing opioid-level efficacy without dependence risk.
Advances in Personalized and Targeted Therapy
Technological progress in pharmacogenomics and biomarker-based research supports the development of targeted pain therapeutics. These innovations allow more precise treatment strategies tailored to individual patient needs. Such approaches reduce side effects while improving therapeutic outcomes. The emphasis on personalized medicine is encouraging R&D investments and opening new revenue streams in the global market.
Key Trends & Opportunities
Integration of Digital Health and Remote Monitoring
The growing use of telemedicine and digital health platforms offers new opportunities for pain management. Remote monitoring tools enhance medication adherence and improve real-time treatment adjustments. Digital health adoption is accelerating in developed markets and gradually expanding into emerging economies. This trend enhances patient engagement while creating new partnerships between pharmaceutical companies and digital health providers.
- For instance, Sword Health uses AI-powered virtual physical therapy for musculoskeletal pain. Their programs reduced surgery rates by about 50 % and saved customers roughly US $3,177 per member annually.
Expansion in Emerging Markets
Rising healthcare expenditure and growing access to modern therapies in Asia-Pacific, Latin America, and the Middle East create strong opportunities. Increasing investment in healthcare infrastructure and supportive regulatory reforms are enabling faster drug approvals. A large patient pool and rising awareness about pain therapies further strengthen growth potential in these regions. Market players are increasingly expanding their distribution networks and R&D collaborations to capture these opportunities.
- For instance, China’s NMPA approved 55 rare disease drugs in 2024, enabled by regulatory reforms aiming to speed up approvals.
Key Challenges
Opioid Misuse and Regulatory Restrictions
The global opioid crisis has led to strict regulations and heightened scrutiny of prescribing practices. These measures restrict access to opioid-based pain relief, limiting revenue growth for this major segment. Pharmaceutical companies face challenges balancing effective pain management with compliance requirements. The need for stricter monitoring adds complexity for healthcare providers.
High Risk of Side Effects
Many pain therapeutics, including NSAIDs and antidepressants, carry significant side-effect risks such as gastrointestinal bleeding, cardiovascular complications, or dependency issues. These risks reduce patient adherence and create hesitation among prescribers. Developing safer drug formulations is costly and time-consuming, slowing the pace of innovation. Managing adverse effects remains a persistent challenge for the industry.
Pricing Pressure and Generic Competition
The presence of numerous generics exerts downward pressure on pricing across major drug classes. Patent expirations of blockbuster pain medications intensify competition and limit profit margins for established players. Payers and governments increasingly demand cost-effective treatment options, forcing companies to justify pricing. These pressures constrain revenue growth and affect long-term investment in new therapies.

Regional Analysis
North America
North America accounted for 19.3% of the global market in 2024, supported by advanced healthcare infrastructure and strong adoption of pain therapeutics. Market size grew from USD 11,495.41 million in 2018 to USD 14,378.57 million in 2024 and is projected to reach USD 20,643.12 million by 2032, expanding at a CAGR of 4.7%. The region benefits from high prevalence of chronic pain disorders and strong insurance coverage. Regulatory reforms and rising demand for non-opioid therapies further support steady growth, though opioid regulations continue to shape treatment patterns.
Europe
Europe held 29.4% of the market share in 2024, making it one of the largest contributors to global revenue. Market value increased from USD 17,388.41 million in 2018 to USD 21,915.27 million in 2024, with forecasts reaching USD 31,799.47 million by 2032 at a CAGR of 4.8%. The region’s growth is driven by robust government healthcare systems, high patient awareness, and extensive use of both opioid and non-opioid therapeutics. Stringent regulations and the strong presence of multinational pharmaceutical companies continue to reinforce Europe’s leadership in this market.
Asia Pacific
Asia Pacific emerged as the largest regional market with 35.9% share in 2024, supported by rapid urbanization and growing healthcare spending. Market size expanded from USD 20,921.88 million in 2018 to USD 26,782.26 million in 2024, and is expected to reach USD 39,694.05 million by 2032 at a CAGR of 5.1%. The region benefits from a large patient pool, rising cases of lifestyle-related pain disorders, and increasing access to modern therapies. Pharmaceutical companies are actively expanding their footprint in China, India, and Japan, fueling further growth potential.
Latin America
Latin America represented 7.4% of the global market in 2024, showing strong growth potential compared with developed regions. The market grew from USD 4,010.03 million in 2018 to USD 5,490.52 million in 2024, and is projected to reach USD 8,845.47 million by 2032, advancing at a CAGR of 6.2%. Growth is driven by improving healthcare access, increasing awareness of chronic pain management, and rising investments in hospital infrastructure. Brazil and Argentina remain the largest contributors, while the expansion of retail pharmacies supports broader availability of pain therapeutics.
Middle East
The Middle East accounted for 5.3% of market share in 2024, with the sector gaining momentum due to rising healthcare investments. Market size expanded from USD 2,777.96 million in 2018 to USD 3,914.66 million in 2024, and is forecasted to reach USD 6,512.48 million by 2032, at a CAGR of 6.6%. Countries in the GCC lead adoption, driven by better infrastructure and rising burden of lifestyle diseases. Government-backed initiatives to modernize healthcare systems are creating new opportunities for pharmaceutical companies in pain management.
Africa
Africa contributed 2.7% to the global market in 2024, reflecting its position as an emerging but smaller segment. Market size grew from USD 1,522.65 million in 2018 to USD 2,002.55 million in 2024, and is projected to reach USD 3,073.80 million by 2032 at a CAGR of 5.6%. Rising prevalence of untreated chronic pain, coupled with increasing healthcare investments in South Africa, Egypt, and Nigeria, drives gradual adoption of pain therapeutics. Limited access to advanced drugs remains a challenge, though expanding distribution channels are expected to improve penetration over time.

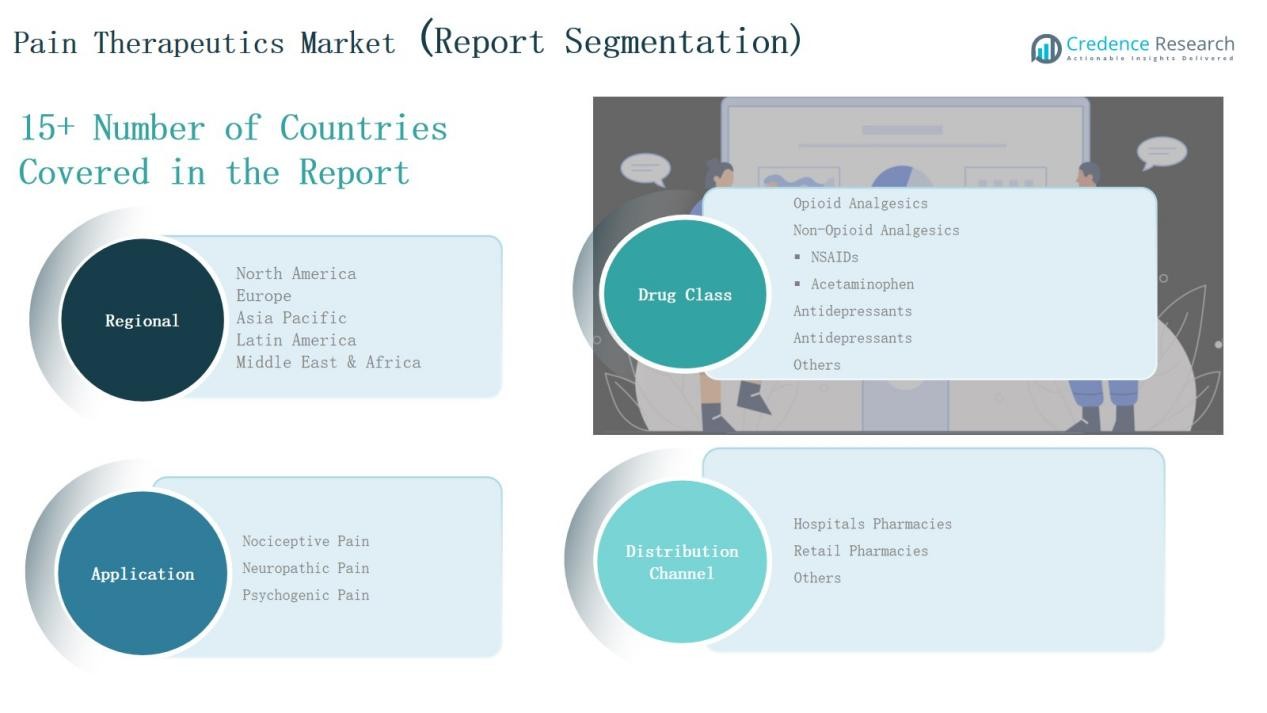
Market Segmentations:
By Drug Class
- Opioid Analgesics
- Non-Opioid Analgesics
- NSAIDs
- Acetaminophen
- Antidepressants
- Others
By Application
- Nociceptive Pain
- Neuropathic Pain
- Psychogenic Pai
By Distribution Channel
- Hospital Pharmacies
- Retail Pharmacies
- Others
By Region
- North America
- Europe
- Germany
- France
- U.K.
- Italy
- Spain
- Rest of Europe
- Asia Pacific
- China
- Japan
- India
- South Korea
- South-east Asia
- Rest of Asia Pacific
- Latin America
- Brazil
- Argentina
- Rest of Latin America
- Middle East & Africa
- GCC Countries
- South Africa
- Rest of the Middle East and Africa
Competitive Landscape
The Global Pain Therapeutics Market is highly competitive, with both multinational pharmaceutical giants and regional players shaping its dynamics. Leading companies such as Abbott, Pfizer, AstraZeneca, Eli Lilly, GSK, Merck & Co., Bristol-Myers Squibb, and Sanofi dominate through extensive portfolios covering opioid and non-opioid therapies. Their strong R&D investments, broad distribution networks, and strategic collaborations secure significant market positions. Purdue Pharma and Boston Scientific contribute with specialized pain management solutions, while emerging firms and generic manufacturers increase competition by offering cost-effective alternatives. Market leaders focus on developing safer non-opioid drugs, personalized therapies, and extended-release formulations to address regulatory pressures and concerns over opioid misuse. Competitive intensity is further heightened by patent expirations, which have enabled generic penetration across major drug classes. Companies are responding with innovation, lifecycle management strategies, and expansion into high-growth regions such as Asia-Pacific and Latin.
Shape Your Report to Specific Countries or Regions & Enjoy 30% Off!
Key Players
- Abbott
- Pfizer Inc.
- AstraZeneca plc
- Boston Scientific Corporation
- Bristol-Myers Squibb and Company
- Eli Lilly and Company
- GSK plc
- Merck & Co. Inc.
- Purdue Pharma L.P.
- Sanofi S.A.
- Other Key Players
Recent Developments
- In January 2025, Vertex Pharmaceuticals received FDA approval for Journavx (suzetrigine), a first-in-class non-opioid therapy for adults with moderate-to-severe acute pain.
- In May 2025, Eli Lilly announced the acquisition of SiteOne Therapeutics to expand its non-opioid pain pipeline with the investigational Nav1.8 inhibitor STC-004.
- In August 2025, Tonix Pharmaceuticals secured FDA approval for Tonmya (cyclobenzaprine HCl sublingual), the first new fibromyalgia treatment in over 15 years.
Report Coverage
The research report offers an in-depth analysis based on Drug Class, Application, Distribution Channel and Region. It details leading market players, providing an overview of their business, product offerings, investments, revenue streams, and key applications. Additionally, the report includes insights into the competitive environment, SWOT analysis, current market trends, as well as the primary drivers and constraints. Furthermore, it discusses various factors that have driven market expansion in recent years. The report also explores market dynamics, regulatory scenarios, and technological advancements that are shaping the industry. It assesses the impact of external factors and global economic changes on market growth. Lastly, it provides strategic recommendations for new entrants and established companies to navigate the complexities of the market.
Future Outlook
- Demand for non-opioid pain therapeutics will continue to expand across all major regions.
- Rising geriatric population will drive long-term demand for chronic pain management solutions.
- Innovation in personalized and targeted therapies will improve treatment effectiveness and safety.
- Digital health integration will enhance patient monitoring and adherence in pain management.
- Emerging markets will gain importance as healthcare access and awareness levels improve.
- Pharmaceutical companies will focus on lifecycle management and extended-release formulations.
- Regulatory pressure on opioid prescriptions will strengthen adoption of alternative therapies.
- Growing prevalence of lifestyle-related disorders will create new opportunities for pain therapeutics.
- Strategic collaborations between pharma and biotech firms will accelerate new drug development.
- Expansion of distribution channels, including online pharmacies, will improve global drug accessibility.


