CHAPTER NO. 1 : GENESIS OF THE MARKET
1.1 Market Prelude – Introduction & Scope
1.2 The Big Picture – Objectives & Vision
1.3 Strategic Edge – Unique Value Proposition
1.4 Stakeholder Compass – Key Beneficiaries
CHAPTER NO. 2 : EXECUTIVE LENS
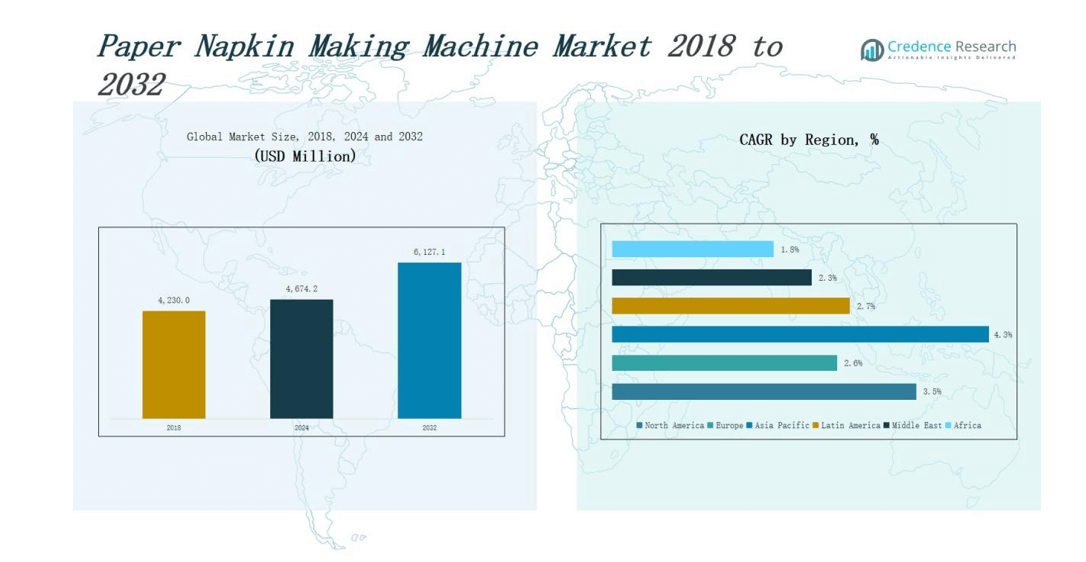
2.1 Pulse of the Industry – Market Snapshot
2.2 Growth Arc – Revenue Projections (USD Million)
2.3. Premium Insights – Based on Primary Interviews
CHAPTER NO. 3 : PAPER NAPKIN MAKING MACHINE MARKET FORCES & INDUSTRY PULSE
3.1 Foundations of Change – Market Overview
3.2 Catalysts of Expansion – Key Market Drivers
3.2.1 Momentum Boosters – Growth Triggers
3.2.2 Innovation Fuel – Disruptive Technologies
3.3 Headwinds & Crosswinds – Market Restraints
3.3.1 Regulatory Tides – Compliance Challenges
3.3.2 Economic Frictions – Inflationary Pressures
3.4 Untapped Horizons – Growth Potential & Opportunities
3.5 Strategic Navigation – Industry Frameworks
3.5.1 Market Equilibrium – Porter’s Five Forces
3.5.2 Ecosystem Dynamics – Value Chain Analysis
3.5.3 Macro Forces – PESTEL Breakdown
3.6 Price Trend Analysis
3.6.1 Regional Price Trend
3.6.2 Price Trend by product
CHAPTER NO. 4 : KEY INVESTMENT EPICENTER
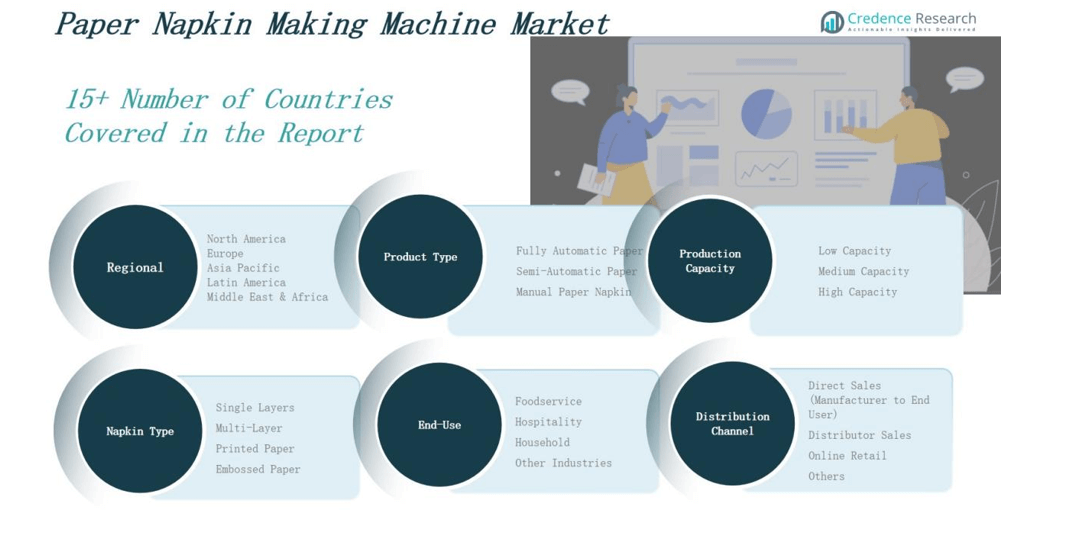
4.1 Regional Goldmines – High-Growth Geographies
4.2 Product Frontiers – Lucrative Product Categories
4.3 Production Capacity Sweet Spots – Emerging Demand Segments
CHAPTER NO. 5: REVENUE TRAJECTORY & WEALTH MAPPING
5.1 Momentum Metrics – Forecast & Growth Curves
5.2 Regional Revenue Footprint – Market Share Insights
5.3 Segmental Wealth Flow – Product Type & Production Capacity Revenue
CHAPTER NO. 6 : TRADE & COMMERCE ANALYSIS
6.1. Import Analysis by Region
6.1.1. Global Paper Napkin Making Machine Market Import Revenue By Region
6.2. Export Analysis by Region
6.2.1. Global Paper Napkin Making Machine Market Export Revenue By Region
CHAPTER NO. 7 : COMPETITION ANALYSIS
7.1. Company Market Share Analysis
7.1.1. Global Paper Napkin Making Machine Market: Company Market Share
7.2. Global Paper Napkin Making Machine Market Company Revenue Market Share
7.3. Strategic Developments
7.3.1. Acquisitions & Mergers
7.3.2. New Product Launch
7.3.3. Regional Expansion
7.4. Competitive Dashboard
7.5. Company Assessment Metrics, 2024
CHAPTER NO. 8 : PAPER NAPKIN MAKING MACHINE MARKET – BY PRODUCT TYPE SEGMENT ANALYSIS
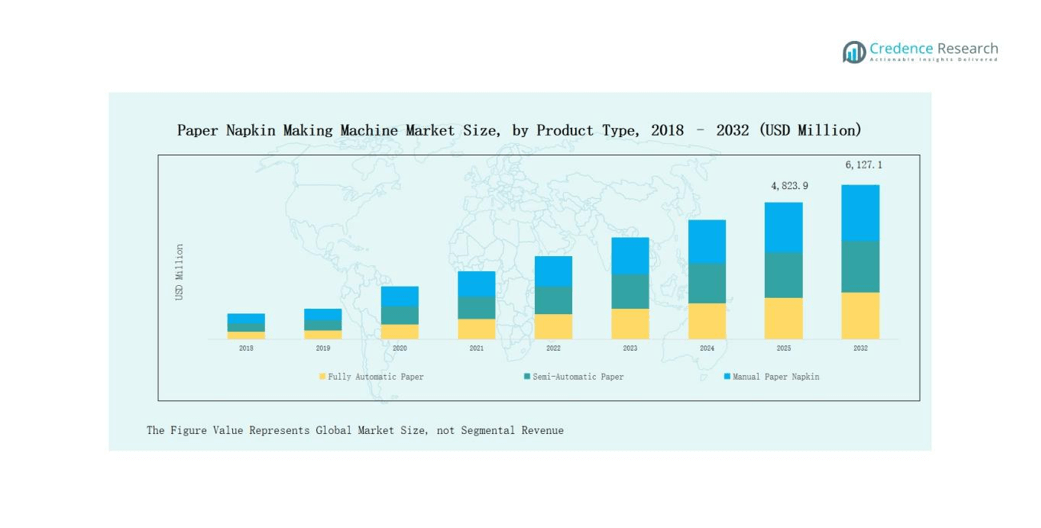
8.1. Paper Napkin Making Machine Market Overview by Product Type Segment
8.1.1. Paper Napkin Making Machine Market Revenue Share By Product Type
8.2. Fully Automatic Paper
8.3. Semi-Automatic Paper
8.4. Manual Paper Napkin
CHAPTER NO. 9 : PAPER NAPKIN MAKING MACHINE MARKET – BY PRODUCTION CAPACITY SEGMENT ANALYSIS
9.1. Paper Napkin Making Machine Market Overview by Production Capacity Segment
9.1.1. Paper Napkin Making Machine Market Revenue Share By Production Capacity
9.2. Low Capacity
9.3. Medium Capacity
9.4. High Capacity
CHAPTER NO. 10 : PAPER NAPKIN MAKING MACHINE MARKET – BY END-USE SEGMENT ANALYSIS
10.1. Paper Napkin Making Machine Market Overview by End-use Segment
10.1.1. Paper Napkin Making Machine Market Revenue Share By End-use
10.2. Foodservice
10.3. Hospitality
10.4. Household
10.5. Other Industries
CHAPTER NO. 11 : PAPER NAPKIN MAKING MACHINE MARKET – BY NAPKIN TYPE SEGMENT ANALYSIS
11.1. Paper Napkin Making Machine Market Overview by Napkin Type Segment
11.1.1. Paper Napkin Making Machine Market Revenue Share By Napkin Type
11.2. Single Layers
11.3. Multi-Layer
11.4. Printed Paper
11.5. Embossed Paper
CHAPTER NO. 12 : PAPER NAPKIN MAKING MACHINE MARKET – BY DISTRIBUTION CHANNEL SEGMENT ANALYSIS
12.1. Paper Napkin Making Machine Market Overview by Distribution Channel Segment
12.1.1. Paper Napkin Making Machine Market Revenue Share By Distribution Channel
12.2. Direct Sales (Manufacturer to End User)
12.3. Distributor Sales
12.4. Online Retail
12.5. Others
CHAPTER NO. 13 : PAPER NAPKIN MAKING MACHINE MARKET – REGIONAL ANALYSIS
13.1. Paper Napkin Making Machine Market Overview by Region Segment
13.1.1. Global Paper Napkin Making Machine Market Revenue Share By Region
13.1.2. Regions
13.1.3. Global Paper Napkin Making Machine Market Revenue By Region
13.1.4. Product Type
13.1.5. Global Paper Napkin Making Machine Market Revenue By Product Type
13.1.6. Production Capacity
13.1.7. Global Paper Napkin Making Machine Market Revenue By Production Capacity
13.1.8. End-use
13.1.9. Global Paper Napkin Making Machine Market Revenue By End-use
13.1.10. Napkin Type
13.1.12. Global Paper Napkin Making Machine Market Revenue By Napkin Type
13.1.13. Distribution Channel
13.1.14. Global Paper Napkin Making Machine Market Revenue By Distribution Channel
CHAPTER NO. 14 : NORTH AMERICA PAPER NAPKIN MAKING MACHINE MARKET – COUNTRY ANALYSIS
14.1. North America Paper Napkin Making Machine Market Overview by Country Segment
14.1.1. North America Paper Napkin Making Machine Market Revenue Share By Region
14.2. North America
14.2.1. North America Paper Napkin Making Machine Market Revenue By Country
14.2.2. Product Type
14.2.3. North America Paper Napkin Making Machine Market Revenue By Product Type
14.2.4. Production Capacity
14.2.5. North America Paper Napkin Making Machine Market Revenue By Production Capacity
14.2.6. End-use
14.2.7. North America Paper Napkin Making Machine Market Revenue By End-use
14.2.8. Napkin Type
14.2.9. North America Paper Napkin Making Machine Market Revenue By Napkin Type
14.2.10. Distribution Channel
14.2.11. North America Paper Napkin Making Machine Market Revenue By Distribution Channel
14.3. U.S.
14.4. Canada
14.5. Mexico
CHAPTER NO. 15 : EUROPE PAPER NAPKIN MAKING MACHINE MARKET – COUNTRY ANALYSIS
15.1. Europe Paper Napkin Making Machine Market Overview by Country Segment
15.1.1. Europe Paper Napkin Making Machine Market Revenue Share By Region
15.2. Europe
15.2.1. Europe Paper Napkin Making Machine Market Revenue By Country
15.2.2. Product Type
15.2.3. Europe Paper Napkin Making Machine Market Revenue By Product Type
15.2.4. Production Capacity
15.2.5. Europe Paper Napkin Making Machine Market Revenue By Production Capacity
15.2.6. End-use
15.2.7. Europe Paper Napkin Making Machine Market Revenue By End-use
15.2.8. Napkin Type
15.2.9. Europe Paper Napkin Making Machine Market Revenue By Napkin Type
15.2.10. Distribution Channel
15.2.11. Europe Paper Napkin Making Machine Market Revenue By Distribution Channel
15.3. UK
15.4. France
15.5. Germany
15.6. Italy
15.7. Spain
15.8. Russia
15.9. Rest of Europe
CHAPTER NO. 16 : ASIA PACIFIC PAPER NAPKIN MAKING MACHINE MARKET – COUNTRY ANALYSIS
16.1. Asia Pacific Paper Napkin Making Machine Market Overview by Country Segment
16.1.1. Asia Pacific Paper Napkin Making Machine Market Revenue Share By Region
16.2. Asia Pacific
16.2.1. Asia Pacific Paper Napkin Making Machine Market Revenue By Country
16.2.2. Product Type
16.2.3. Asia Pacific Paper Napkin Making Machine Market Revenue By Product Type
16.2.4. Production Capacity
16.2.5. Asia Pacific Paper Napkin Making Machine Market Revenue By Production Capacity
16.2.6. End-use
16.2.7. Asia Pacific Paper Napkin Making Machine Market Revenue By End-use
16.2.8. Napkin Type
16.2.9. Asia Pacific Paper Napkin Making Machine Market Revenue By Napkin Type
16.2.10. Distribution Channel
16.2.11. Asia Pacific Paper Napkin Making Machine Market Revenue By Distribution Channel
16.3. China
16.4. Japan
16.5. South Korea
16.6. India
16.7. Australia
16.8. Southeast Asia
16.9. Rest of Asia Pacific
CHAPTER NO. 17 : LATIN AMERICA PAPER NAPKIN MAKING MACHINE MARKET – COUNTRY ANALYSIS
17.1. Latin America Paper Napkin Making Machine Market Overview by Country Segment
17.1.1. Latin America Paper Napkin Making Machine Market Revenue Share By Region
17.2. Latin America
17.2.1. Latin America Paper Napkin Making Machine Market Revenue By Country
17.2.2. Product Type
17.2.3. Latin America Paper Napkin Making Machine Market Revenue By Product Type
17.2.4. Production Capacity
17.2.5. Latin America Paper Napkin Making Machine Market Revenue By Production Capacity
17.2.6. End-use
17.2.7. Latin America Paper Napkin Making Machine Market Revenue By End-use
17.2.8. Napkin Type
17.2.9. Latin America Paper Napkin Making Machine Market Revenue By Napkin Type
17.2.10. Distribution Channel
17.2.11. Latin America Paper Napkin Making Machine Market Revenue By Distribution Channel
17.3. Brazil
17.4. Argentina
17.5. Rest of Latin America
CHAPTER NO. 18 : MIDDLE EAST PAPER NAPKIN MAKING MACHINE MARKET – COUNTRY ANALYSIS
18.1. Middle East Paper Napkin Making Machine Market Overview by Country Segment
18.1.1. Middle East Paper Napkin Making Machine Market Revenue Share By Region
18.2. Middle East
18.2.1. Middle East Paper Napkin Making Machine Market Revenue By Country
18.2.2. Product Type
18.2.3. Middle East Paper Napkin Making Machine Market Revenue By Product Type
18.2.4. Production Capacity
18.2.5. Middle East Paper Napkin Making Machine Market Revenue By Production Capacity
18.2.6. End-use
18.2.7. Middle East Paper Napkin Making Machine Market Revenue By End-use
18.2.8. Napkin Type
18.2.9. Middle East Paper Napkin Making Machine Market Revenue By Napkin Type
18.2.10. Distribution Channel
18.2.11. Middle East Paper Napkin Making Machine Market Revenue By Distribution Channel
18.3. GCC Countries
18.4. Israel
18.5. Turkey
18.6. Rest of Middle East
CHAPTER NO. 19 : AFRICA PAPER NAPKIN MAKING MACHINE MARKET – COUNTRY ANALYSIS
19.1. Africa Paper Napkin Making Machine Market Overview by Country Segment
19.1.1. Africa Paper Napkin Making Machine Market Revenue Share By Region
19.2. Africa
19.2.1. Africa Paper Napkin Making Machine Market Revenue By Country
19.2.2. Product Type
19.2.3. Africa Paper Napkin Making Machine Market Revenue By Product Type
19.2.4. Production Capacity
19.2.5. Africa Paper Napkin Making Machine Market Revenue By Production Capacity
19.2.6. End-use
19.2.7. Africa Paper Napkin Making Machine Market Revenue By End-use
19.2.8. Napkin Type
19.2.9. Africa Paper Napkin Making Machine Market Revenue By Napkin Type
19.2.10. Distribution Channel
19.2.11. Africa Paper Napkin Making Machine Market Revenue By Distribution Channel
19.3. South Africa
19.4. Egypt
19.5. Rest of Africa
CHAPTER NO. 20 : COMPANY PROFILES
20.1. Alpha Napkin Machines
20.1.1. Company Overview
20.1.2. Product Portfolio
20.1.3. Financial Overview
20.1.4. Recent Developments
20.1.5. Growth Strategy
20.1.6. SWOT Analysis
20.2. Beston Machinery
20.3. Bretting Manufacturing Co., Inc. (USA
20.4. C. G. Bretting Manufacturing
20.5. Delta Paper Machine
20.6. Finetech Tissue Machines
20.7. Hanwha Corporation
20.8. Hobema
20.9. Jori Machine
20.10. Kawanoe Zoki
20.11. MarquipWardUnited
20.12. Ocean Associate Co. Ltd
20.13. Royal Paper Industries
20.14. Taiwan Pulp Moulding Co., Ltd. (Taiwan Jori Machine)