
Physical Therapy Supplies Market Overview:
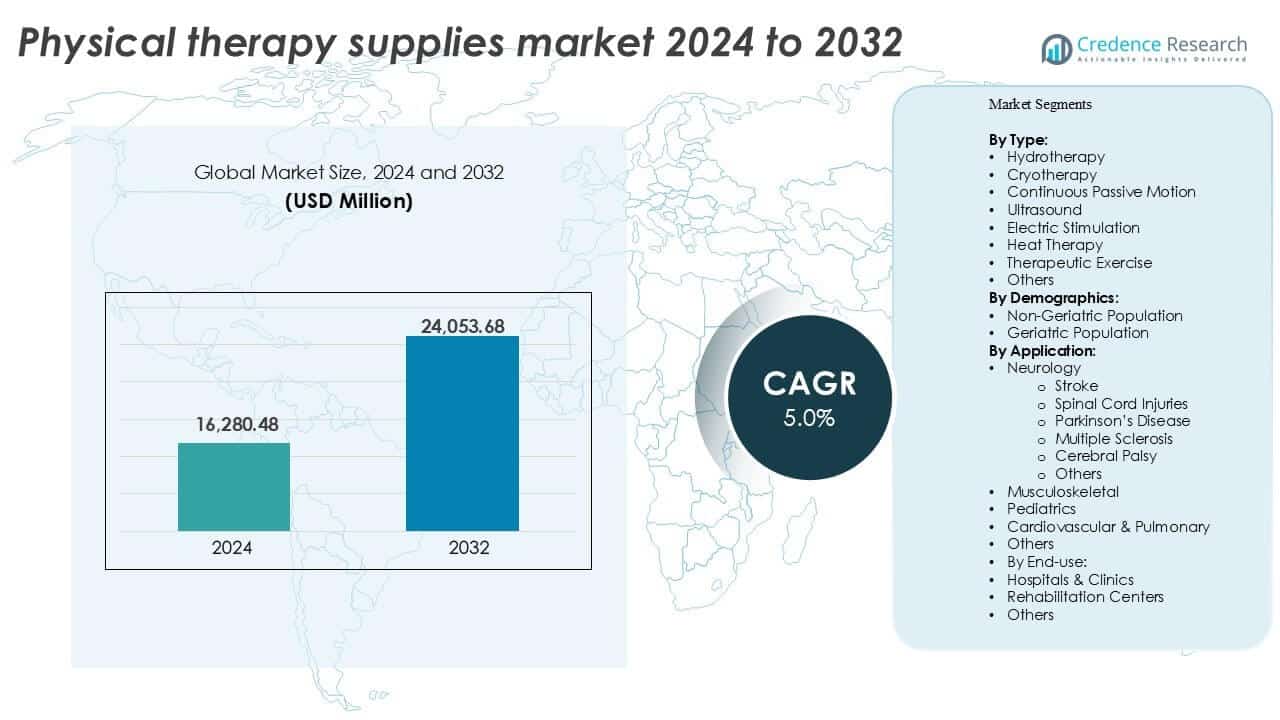
The Global Physical Therapy Supplies Market size was valued at USD 16,280.48 million in 2024 and is anticipated to reach USD 24,053.68 million by 2032, growing at a CAGR of 5.0% during the forecast period.
| REPORT ATTRIBUTE | DETAILS |
|---|---|
| Historical Period | 2020-2023 |
| Base Year | 2024 |
| Forecast Period | 2025-2032 |
| Physical Therapy Supplies Market Size 2024 | USD 16,280.48 million |
| Physical Therapy Supplies Market, CAGR | 5.0% |
| Physical Therapy Supplies Market Size 2032 | USD 24,053.68 million |
Leading players in the physical therapy supplies market include Dynatronics Corporation, BTL, Zimmer MedizinSysteme GmbH, Performance Health, Storz Medical AG, ITO Co. Ltd., EMS Physio Ltd., Enraf-Nonius, Whitehall Manufacturing, and RICHMAR. These companies dominate through strong distribution networks, broad product offerings, and continuous innovation in therapeutic technologies. North America emerged as the leading regional market in 2024, capturing over 35% of the global market share. The region benefits from advanced healthcare systems, high rehabilitation demand, and widespread insurance coverage. Europe follows, supported by structured public healthcare and rising neurological and orthopedic disorder prevalence. Asia-Pacific is the fastest-growing region, driven by expanding healthcare infrastructure, aging demographics, and increased awareness of physical therapy benefits. Competitive intensity continues to rise, with top players focusing on compact, user-friendly, and digitally integrated solutions to meet growing outpatient and home-based therapy needs.
Physical Therapy Supplies Market Insights
- The global physical therapy supplies market was valued at USD 16,280.48 million in 2024 and is expected to reach USD 24,053.68 million by 2032, growing at a CAGR of 5.0%.
- Rising demand for post-surgical rehabilitation, growing geriatric population, and increasing chronic disease cases are key drivers boosting therapy supply adoption across hospitals, clinics, and home care.
- Integration of AI-based wearable devices and home-use portable therapy units is shaping product innovation and expanding accessibility in emerging markets.
- North America led the market with over 35% share in 2024, followed by Europe and Asia-Pacific, while the therapeutic exercise segment held the largest share among types due to broad applications in orthopedic and neurological recovery.
- High equipment costs and limited insurance coverage in some regions restrict access to advanced devices, especially in developing countries, impacting wider market penetration despite growing rehabilitation needs.
Physical Therapy Supplies Market Segmentation Analysis:
By Type
Therapeutic exercise held the largest market share in 2024 among all physical therapy supply types. Its dominance is driven by widespread use in rehabilitation plans for musculoskeletal and neurological conditions. The demand is fueled by increased post-surgical recovery needs and long-term injury management programs. Heat therapy and electric stimulation devices also showed strong growth, supported by rising demand for non-invasive pain relief methods. Hydrotherapy and cryotherapy gained traction in sports injury recovery settings. Continuous passive motion and ultrasound therapy are expanding in orthopedic care. Growing outpatient rehab programs continue to support multi-modal therapy adoption across these types.
- For instance, resistance bands used in therapeutic exercise often provide tension levels from 1 kg to over 20 kg, allowing tailored strength training for various patient groups.
By Demographics
The geriatric population dominated the demographic segment, accounting for the largest revenue share in 2024. Rising aging rates and a higher prevalence of age-related disorders, such as osteoarthritis and stroke, fuel demand for physical therapy supplies among older adults. This group frequently requires long-term rehabilitation for mobility, balance, and strength restoration. Non-geriatric users, while smaller in share, drive significant demand through sports medicine, accident recovery, and post-operative therapy. However, the consistent healthcare focus on elderly care and the need for chronic condition management reinforce the geriatric segment's leading position.
- For instance, balance trainers designed for older adults often include adjustable platform inclines from 0° to 15° to safely challenge stability during rehab exercises.
By Application
Neurology emerged as the leading application segment, holding the highest market share in 2024. Within neurology, stroke rehabilitation accounted for the majority share due to increasing incidence rates and long recovery timelines. Spinal cord injuries and Parkinson’s disease follow, with strong demand for motion restoration and gait training tools. Musculoskeletal applications also hold a substantial share, supported by orthopedic injury treatment and chronic joint condition management. Pediatrics and cardiovascular & pulmonary segments are niche but growing, driven by targeted therapy programs. The increasing focus on personalized neurological rehabilitation solutions continues to support segment leadership.
Physical Therapy Supplies Market Key Growth Drivers
Aging Global Population and Chronic Disease Burden
The growing elderly population significantly drives the physical therapy supplies market. Aging leads to higher risks of musculoskeletal disorders, neurological conditions, arthritis, and post-surgical rehabilitation needs. With people aged 65+ increasing rapidly, particularly in Asia-Pacific and Europe, long-term physical therapy becomes essential in elderly care. For example, stroke and hip fracture recovery demand specialized therapeutic tools like electric stimulators and continuous passive motion devices. In parallel, chronic diseases such as diabetes, Parkinson’s, and cardiovascular disorders raise long-term rehabilitation demand. Healthcare providers increasingly integrate physical therapy into chronic disease management plans to improve patient mobility, reduce complications, and prevent hospital readmissions. This demographic shift ensures sustained demand across hospitals, rehabilitation centers, and home-care setups, reinforcing physical therapy supplies as critical to geriatric care infrastructure.
- For instance, electric muscle stimulators used in stroke recovery typically deliver pulse widths between 200 µs and 400 µs to support muscle re‑education.
Expanding Post-Surgical and Sports Rehabilitation Demand
Post-operative rehabilitation and sports injury recovery are major growth areas for physical therapy supplies. Rising rates of orthopedic procedures such as joint replacements, ligament reconstructions, and spine surgeries fuel demand for equipment supporting mobility restoration and pain management. Devices like ultrasound stimulators, cryotherapy units, and therapeutic exercise tools play essential roles in speeding up healing and improving outcomes. Simultaneously, growing participation in professional and recreational sports globally increases the risk of injuries, leading to wider adoption of physical therapy across athlete recovery programs. Sports medicine clinics and physical therapy centers invest in specialized supplies to reduce downtime and restore physical function. Rapid urbanization, fitness awareness, and government investments in sports infrastructure further expand this segment. These trends drive continuous product innovation and market expansion across outpatient and athletic rehabilitation ecosystems.
- For instance, therapeutic ultrasound units used in soft‑tissue healing often operate at frequencies around 1 MHz to reach deeper tissue layers.
Technological Advancements and Home Rehabilitation Solutions
Technology integration in physical therapy supplies accelerates market growth. Smart rehabilitation devices now offer real-time monitoring, wireless connectivity, and data tracking through mobile apps and sensors. These features enhance patient engagement and allow therapists to remotely adjust treatment plans. Demand for home-based physical therapy has surged, particularly post-pandemic, due to convenience, cost savings, and rising awareness. Equipment like portable electric stimulators, compact CPM machines, and app-connected exercise tools enable effective rehabilitation outside clinical settings. Patients with limited mobility or access to therapy centers benefit from these solutions. Manufacturers focus on user-friendly, lightweight, and automated devices to support at-home recovery. This tech-driven shift enhances therapy adherence, reduces travel burdens, and opens new market opportunities. Insurance reimbursement support for remote physiotherapy in some regions further encourages adoption, making technology a central pillar of future growth.
Physical Therapy Supplies Market Key Trends & Opportunities
Integration of Artificial Intelligence and Wearable Technologies
AI and wearable tech are transforming physical therapy delivery. Smart sensors embedded in braces, belts, or garments collect data on posture, movement, and muscle activity during rehabilitation. AI algorithms analyze performance, track progress, and provide feedback to both patients and therapists. These technologies enable precision therapy and improve patient adherence. For instance, AI-assisted virtual trainers can guide patients through routines, reducing dependency on in-person sessions. Real-time performance tracking helps detect early signs of therapy deviation or injury risk. This trend opens opportunities for remote therapy models, especially in underserved or rural areas. Companies investing in AI-driven rehab platforms can capture market share in home-based and digital healthcare ecosystems. Moreover, data collected from wearables can feed into broader health analytics platforms, enabling more personalized treatment plans across therapy sessions.
- For instance, AI‑driven motion tracking systems using inertial sensors and accelerometers can continuously monitor gait and activity patterns in real time outside clinics.
Growing Demand for Pediatric and Neurological Rehabilitation
Specialized therapy solutions for pediatric and neurological patients present strong future potential. Conditions like cerebral palsy, autism spectrum disorders, and developmental delays require long-term, customized interventions using adapted physical therapy supplies. Similarly, neurological disorders such as multiple sclerosis, Parkinson’s, and spinal cord injuries—need dedicated rehabilitation equipment to maintain muscle function and mobility. These patient groups often require repeated sessions over years, supporting recurring equipment demand. Innovations in soft-touch therapy tools, smaller-scale ultrasound units, and motor-assist devices are improving outcomes for these complex cases. Healthcare systems increasingly fund pediatric and neurorehabilitation programs, especially in developed markets. Non-profits and government initiatives focused on child disability support also expand access to these therapies. As awareness rises and diagnostic rates improve, suppliers offering tailored products for these segments will find significant growth avenues.
Physical Therapy Supplies Market Key Challenges
High Equipment Costs and Limited Reimbursement Coverage
The high cost of physical therapy supplies limits market access, particularly in developing regions. Advanced equipment such as electric stimulation units, hydrotherapy pools, and robotic-assist devices require significant investment. Clinics and rehabilitation centers may hesitate to upgrade tools due to budget constraints. Additionally, insurance reimbursement policies vary widely across countries. In many markets, physical therapy is underfunded or lacks full coverage for device-based treatments. Patients bear out-of-pocket costs, reducing adoption. This affordability gap restricts penetration in price-sensitive areas and delays the uptake of advanced tools. Start-ups and SMEs often face barriers entering the market due to high R&D and regulatory costs. Broader insurance coverage and subsidy programs are necessary to scale access. Until then, high pricing and limited financial support remain major restraints on market expansion.
Shortage of Skilled Physical Therapists and Training Gaps
Despite rising demand, the market faces a global shortage of licensed physical therapists. The World Health Organization reports that many countries have below-recommended ratios of rehabilitation professionals. This shortage affects patient access to therapy and limits full utilization of physical therapy equipment. Even when supplies are available, lack of proper training leads to underuse or misuse. In rural and remote regions, the gap is more severe due to poor healthcare infrastructure. Moreover, new technologies like AI-assisted or sensor-integrated devices require training to operate effectively. Without adequate education programs for therapists, adoption of these tools remains slow. Health systems must invest in workforce development, skill-building workshops, and e-learning platforms. Bridging this human-resource gap is essential to ensuring therapy tools are applied correctly and efficiently in clinical and home settings.
Physical Therapy Supplies Market Regional Analysis
North America
North America held the largest market share of over 35% in 2024, driven by advanced healthcare infrastructure and strong insurance coverage for rehabilitation services. The U.S. leads the region due to high rates of chronic disease, orthopedic surgeries, and a growing aging population. Widespread adoption of advanced physical therapy equipment such as electrotherapy and ultrasound devices supports continued market expansion. Government support for post-acute care, presence of key players, and growing home healthcare trends further boost regional growth. Canada also contributes steadily, with increasing investments in rehabilitation facilities and public awareness of physical therapy benefits.
Europe
Europe accounted for around 25% of the global physical therapy supplies market in 2024. The region benefits from well-established public healthcare systems, especially in Germany, France, and the U.K. Rising geriatric population and post-operative rehabilitation demand drive steady growth. EU-wide support for rehabilitation services under universal health coverage ensures high therapy adoption rates. Countries like Italy and Spain witness growth in outpatient therapy clinics and rehabilitation centers. Technological adoption, particularly in assistive devices and motion therapy, strengthens demand. Increasing neurological disorder prevalence and orthopedic surgeries also support Europe's continued investment in modern therapy equipment.
Asia-Pacific
Asia-Pacific captured over 20% market share in 2024 and is the fastest-growing region due to its large population base and increasing healthcare spending. Japan and China lead in demand for physical therapy supplies, fueled by aging demographics and chronic disease rates. India, South Korea, and Australia show rapid expansion in rehabilitation services, driven by rising awareness and growing medical tourism. Government initiatives to expand physiotherapy education and infrastructure, especially in urban hospitals and private clinics, strengthen adoption. Increased sports activity and accident-related injuries in the region further contribute to product demand across multiple care settings.
Latin America
Latin America represented nearly 10% of the physical therapy supplies market in 2024. Brazil and Mexico lead the region due to expanding private healthcare systems and increasing demand for rehabilitation services. Growing burden of musculoskeletal and neurological disorders supports therapy equipment usage across outpatient clinics and hospitals. Public healthcare reforms in Argentina and Colombia focus on post-injury care, creating opportunities for physical therapy supply providers. However, access disparities between urban and rural areas remain a limiting factor. Ongoing investments in training and facility upgrades are expected to improve market penetration over the coming years.
Middle East & Africa (MEA)
MEA held a modest share of around 5% in the global market in 2024 but shows emerging potential. Countries like Saudi Arabia and the UAE are investing in rehabilitation hospitals and specialized therapy centers as part of healthcare modernization plans. Rising incidence of stroke, orthopedic conditions, and road injuries drives therapy demand. Africa lags behind due to limited infrastructure, but efforts to expand rehabilitation services are underway. International collaborations and non-profit health programs are helping bridge access gaps. Gradual awareness of physiotherapy benefits and training initiatives across the region will support long-term market development.
Physical Therapy Supplies Market Segmentations:
By Type
- Hydrotherapy
- Cryotherapy
- Continuous Passive Motion
- Ultrasound
- Electric Stimulation
- Heat Therapy
- Therapeutic Exercise
- Others
By Demographics
- Non-Geriatric Population
- Geriatric Population
By Application
- Neurology
- Stroke
- Spinal Cord Injuries
- Parkinson’s Disease
- Multiple Sclerosis
- Cerebral Palsy
- Others
- Musculoskeletal
- Pediatrics
- Cardiovascular & Pulmonary
- Others
By End-use
- Hospitals & Clinics
- Rehabilitation Centers
- Others
By Geography
- North America
- U.S.
- Canada
- Mexico
- Europe
- Germany
- France
- U.K.
- Italy
- Spain
- Rest of Europe
- Asia Pacific
- China
- Japan
- India
- South Korea
- South-east Asia
- Rest of Asia Pacific
- Latin America
- Brazil
- Argentina
- Rest of Latin America
- Middle East & Africa
- GCC Countries
- South Africa
- Rest of the Middle East and Africa
Competitive Landscape
The physical therapy supplies market features a moderately fragmented competitive landscape, with several global and regional players competing across product categories. Key companies such as Dynatronics Corporation, Zimmer MedizinSysteme GmbH, BTL, Performance Health, and Storz Medical AG focus on expanding their portfolios through product innovation and targeted acquisitions. These players invest in R&D to introduce compact, user-friendly devices tailored for both clinical and home-based rehabilitation. Strategic partnerships with hospitals, rehab centers, and distributors enhance market presence and customer reach. Firms like ITO Co. Ltd., EMS Physio Ltd., and Enraf-Nonius emphasize international expansion through dealer networks. Meanwhile, Whitehall Manufacturing and RICHMAR cater to niche therapy areas, supporting market diversity. Pricing competitiveness, technological differentiation, and after-sales support remain key factors influencing buyer decisions. With rising demand for portable, connected, and AI-integrated therapy devices, companies are prioritizing digital integration and patient-centered designs to gain a competitive edge in both developed and emerging markets.
Key Player Analysis
- Dynatronics Corporation
- Whitehall Manufacturing
- Zimmer MedizinSysteme GmbH
- Performance Health
- EMS Physio Ltd.
- ITO Co. Ltd.
- Enraf-Nonius
- Storz Medical AG
- RICHMAR
- BTL
Recent Developments
- In 2024, Performance Health, a leading healthcare provider, introduced SISSEL® products as part of its comprehensive wellness offering. By partnering with Performance Health, SISSEL® will be able to offer its vast network of clinicians and consumers natural and effective options for well-being.
- In June 2024, Enraf-Nonius B.V. (Netherlands) partnered with Kismet Holdings Group (US) to introduce a comprehensive range of physiotherapy and rehabilitation equipment in the US market.
- In February 2024, Storz Medical AG established its Japanese subsidiary, named STORZ MEDICAL Japan Co., Ltd.
Report Coverage
The research report offers an in-depth analysis based on Type, Demographics, Application, End-Use and Geography. It details leading market players, providing an overview of their business, product offerings, investments, revenue streams, and key applications. Additionally, the report includes insights into the competitive environment, SWOT analysis, current market trends, as well as the primary drivers and constraints. Furthermore, it discusses various factors that have driven market expansion in recent years. The report also explores market dynamics, regulatory scenarios, and technological advancements that are shaping the industry. It assesses the impact of external factors and global economic changes on market growth. Lastly, it provides strategic recommendations for new entrants and established companies to navigate the complexities of the market.
Future Outlook
- Demand for home-based physical therapy devices will continue rising due to aging populations and mobility issues.
- AI-enabled therapy tools and connected devices will see wider adoption for remote monitoring.
- Pediatric and neurological rehabilitation segments are expected to grow with more specialized therapy programs.
- Sports and fitness injury-related therapy demand will increase as active lifestyles become more common.
- Technological advancements will improve the portability, accuracy, and usability of therapy equipment.
- Emerging markets will witness strong growth with expanding healthcare infrastructure and awareness.
- Hospitals and rehabilitation centers will increase procurement of multifunctional therapy systems.
- Strategic partnerships and acquisitions will shape the competitive landscape among global and regional players.
- Reimbursement coverage is likely to expand for therapy treatments in developed regions.
- Training and upskilling of physiotherapists will become critical to support advanced device adoption.
Request a Free Sample
Fill in your details and we'll send you a free sample report.
- Sample data tables & charts
- Research methodology
Need a Custom Version of This Report?
Tailor the scope, geography, or segments to your exact requirements.
- Custom geography or segment scope
- Direct access to our analyst team
Frequently Asked Questions
What is the current market size for the Nutraceutical excipients market, and what is its projected size in 2032?
At what Compound Annual Growth Rate is the Nutraceutical excipients market projected to grow between 2024 and 2032?
Which Nutraceutical excipients market segment held the largest share in 2024?
What are the primary factors fueling the growth of the Nutraceutical excipients market?
Who are the leading companies in the Nutraceutical excipients market?
Which region commanded the largest share of the Nutraceutical excipients market in 2024?
Table of Content
Chapter 1. Report Introduction
- 1.1 Report Description & Purpose
- 1.1.1 Report Title & Market Definition
- 1.1.2 Unique Selling Propositions (USP) & Key Differentiators
- 1.1.3 Value Proposition for Stakeholders
- 1.2 Research Objectives
- 1.2.1 Market Sizing Objectives (Volume & Revenue)
- 1.2.2 Segmentation Objectives
- 1.2.3 Competitive Intelligence Objectives
- 1.2.4 Forecast & Scenario Objectives
- 1.3 Report Scope
- 1.3.1 Physical Therapy Supplies Scope – Types & Subtypes Covered
- 1.3.2 Geographic Scope – Regions & Countries Covered
- 1.3.3 Historical Period, Base Year & Forecast Period (2024; forecast to 2032)
- 1.3.4 Inclusions & Exclusions
- 1.4 HS Code & Classification Framework
- 1.5 Currency, Units & Pricing Basis
- 1.6 Target Stakeholders
- 1.7 Limitations & Assumptions
Chapter 2. Executive Summary
- 2.1 Global Physical Therapy Supplies Market Snapshot
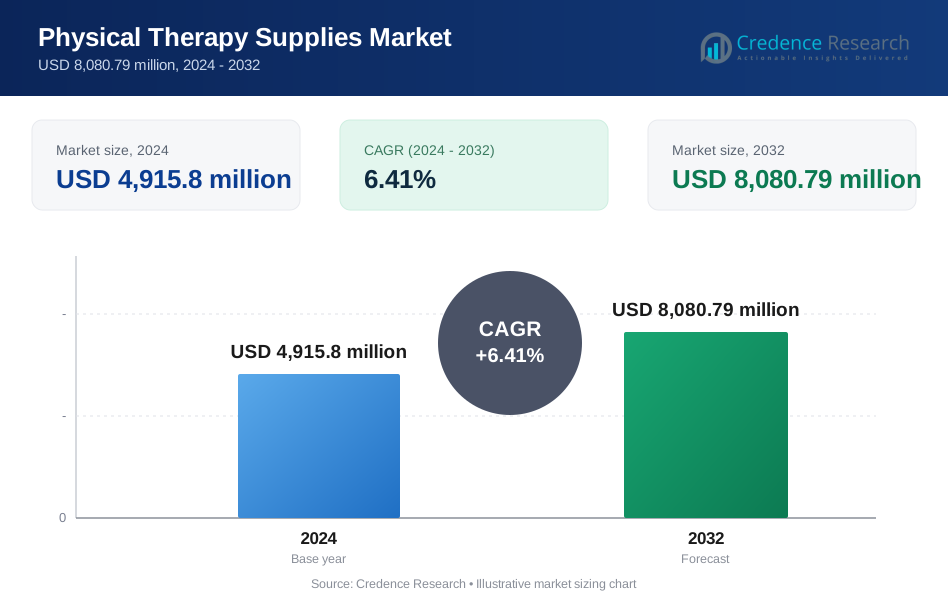
- 2.1.1 Market Size – Historical (2024) & Forecast (2024-2032) (2024: USD 4,915.8 million → 2032: USD 8,080.79 million)
- 2.1.2 Volume & Revenue – Global Totals
- 2.1.3 Key Market Highlights – Top Five Facts
- 2.2 Physical Therapy Supplies Market Segmentation Snapshot
- 2.2.1 Market Split by Region – 2024 vs. 2032
- 2.3 Competitive Snapshot
- 2.3.1 Top 10 Players by Revenue Share – 2024
- 2.3.2 Top 10 Players by Volume Share – 2024
- 2.3.3 Recent Strategic Developments (18-Month Summary)
- 2.4 Key Investment Highlights & Strategic Conclusions
Chapter 3. Physical Therapy Supplies Market Dynamics & Industry Analysis
- 3.1 Market Overview & Context
- 3.1.1 Physical Therapy Supplies Market Position in the Broader Automotive Value Chain
- 3.1.2 OEM vs. Replacement Market Dynamics
- 3.1.3 Market Maturity & Development Stage by Region
- 3.2 Physical Therapy Supplies Market Drivers
- 3.3 Physical Therapy Supplies Market Restraints & Challenges
- 3.4 Physical Therapy Supplies Market Opportunities
- 3.5 Porter's Five Forces Analysis
- 3.5.1 Threat of New Entrants
- 3.5.2 Bargaining Power of Suppliers
- 3.5.3 Bargaining Power of Buyers
- 3.5.4 Threat of Substitutes
- 3.5.5 Competitive Rivalry – Intensity Assessment
- 3.6 Physical Therapy Supplies Value Chain Analysis
- 3.6.1 Upstream – Raw Material/Input Suppliers
- 3.6.1.1 Raw Material/Input 1
- 3.6.1.2 Raw Material/Input 2
- 3.6.1.3 Raw Material/Input 3
- 3.6.2 Midstream – Production/Manufacturing/Service Delivery
- 3.6.2.1 Production/Process Overview
- 3.6.2.2 Key Facility Locations & Capacity by Manufacturer
- 3.6.3 Downstream – Distribution & End Consumer
- 3.6.3.1 Primary Channel – B2B/OEM
- 3.6.3.2 Secondary Channels – Dealer, Retail, Online, Direct
- 3.6.4 Value Chain Profitability Analysis
- 3.6.1 Upstream – Raw Material/Input Suppliers
- 3.7 PESTEL Analysis
- 3.7.1 Political Factors
- 3.7.2 Economic Factors
- 3.7.3 Social Factors
- 3.7.4 Technological Factors
- 3.7.5 Environmental Factors
- 3.7.6 Legal Factors
- 3.8 Physical Therapy Supplies Supply Chain Analysis
- 3.8.1 Raw Material/Input Supply Risk Assessment
- 3.8.2 Manufacturing Concentration Risk (Geographic Exposure)
- 3.8.3 Trade Disruption Impact Analysis
- 3.9 Regulatory & Policy Landscape
Note: The regulatory and policy landscape section covers regulations based on their applicability to the market, Physical Therapy Supplies category, geography, and scope of the study. Only regulatory frameworks with a material impact on operations, compliance, trade, sustainability, or market access are analyzed in detail.
Chapter 4. Key Investment Pockets & Opportunity Analysis
- 4.1 Physical Therapy Supplies Market Attractiveness Analysis
- 4.1.1 By Region – Investment Attractiveness Matrix (Volume × CAGR)
- 4.2 Absolute Revenue Growth Opportunity
- 4.2.1 By Region – Absolute USD Growth Through 2032
- 4.3 Incremental Volume Opportunity
- 4.3.1 By Region – Incremental Volume Through 2032
- 4.3.2 Segment – Incremental Volume
- 4.4 Emerging Submarket Opportunity Deep Dive (Subject to Applicability)
- 4.5 Emerging Market Opportunity Scorecards
- 4.5.1 United States
- 4.5.2 Europe
- 4.5.3 Asia
- 4.5.4 Middle East & Africa
Note: Emerging Market Opportunity Scorecards will be included based on relevance and strategic importance. Regions listed are indicative and may vary depending on data availability and market dynamics.
Chapter 5. Physical Therapy Supplies Import-Export Analysis & Trade Flows
- 5.1 Global Trade Overview
- 5.1.1 Global Export Value by Country (2024)
- 5.1.2 Global Export Volume by Country (2024)
- 5.1.3 Global Import Value by Country (2024)
- 5.1.4 Global Import Volume by Country (2024)
- 5.1.5 Net Trade Balance by Country (2024)
- 5.2 Export Analysis – Segment
- 5.2.1 Type 1 (HS Code)
- 5.2.2 Type 2 (HS Code)
- 5.2.3 Type 3 (HS Code)
- 5.2.4 Type 4 (HS Code)
- 5.2.5 Type 5 (HS Code)
- 5.3 Import Analysis – Segment
- 5.3.1 Type 1 (HS Code)
- 5.3.2 Type 2 (HS Code)
- 5.3.3 Type 3 (HS Code)
- 5.3.4 Type 4 (HS Code)
- 5.3.5 Type 5 (HS Code)
- 5.4 Average Unit Trade Prices
- 5.4.1 Average Export Price – Segment & Country
- 5.4.2 Average Import Price – Segment & Source Country
- 5.4.3 Price Trends (2024)
- 5.5 Key Trade Route Analysis
- 5.5.1 Trade Route 1
- 5.5.2 Trade Route 2
- 5.5.3 Trade Route 3
- 5.5.4 Trade Route 4
- 5.5.5 Trade Route 5
- 5.6 Trade Policy Impact Assessment
- 5.6.1 US Anti-Dumping & Section 301 Tariffs
- 5.6.2 EU Customs Union Impact
- 5.6.3 Major Free Trade Agreements
- 5.6.4 USMCA Rules of Origin
Note: Trade policy analysis will be included only where relevant to the Physical Therapy Supplies market.
Chapter 6. Competitive Landscape & Company Benchmarking
- 6.1 Physical Therapy Supplies Market Concentration & Structure
- 6.1.1 Herfindahl-Hirschman Index (HHI) – vs. 2024
- 6.1.2 Tier 1, Tier 2 & Tier 3 Market Structure
- 6.1.3 Global, Regional & Local Player Dynamics
- 6.2 Physical Therapy Supplies Market Share Analysis – 2024
- 6.2.1 Global Revenue Share by Company
- 6.2.2 Global Volume Share by Company
- 6.2.3 Regional Revenue Share
- 6.2.4 Market Share Evolution ( vs. 2024)
- 6.2.5 OEM Segment Share by Company
- 6.2.6 Replacement Segment Share by Company
- 6.3 Production/Delivery Capacity & Facility Analysis
- 6.3.1 Global Installed Capacity
- 6.3.2 Capacity Utilization Rates
- 6.3.3 Production/Output Volume
- 6.3.4 Facility Locations & Capacity Map
- 6.3.5 Planned Capacity Additions
- 6.4 Physical Therapy Supplies Competitive Benchmarking Matrix
- 6.4.1 Revenue, Volume, CAGR & Profitability Comparison
- 6.4.2 Channel Revenue Mix
- 6.4.3 Geographic Revenue Exposure
- 6.4.4 R&D Intensity
- 6.4.5 Sustainability Maturity
- 6.5 Strategic Developments in Physical Therapy Supplies (Last 24 Months)
- 6.5.1 Mergers, Acquisitions & Divestments
- 6.5.2 New Physical Therapy Supplies Launches
- 6.5.3 Facility Expansions
- 6.5.4 Strategic Alliances, Joint Ventures & Partnerships
- 6.5.5 Distribution Expansion & Market Entry
- 6.5.6 Sustainability & ESG Initiatives
- 6.6 Competitive Strategy Mapping
- 6.6.1 Leader, Challenger, Follower & Niche Classification
- 6.6.2 Pricing Strategy Comparison
- 6.6.3 Channel Strategy Matrix
Note: Strategic developments are included based on their materiality and the availability of reliable information.
Chapter 7. Global Physical Therapy Supplies Market – By Distribution Channel
- 7.1 Segment Overview
- 7.1.1 Volume & Revenue Split by Channel (2024 & 2032)
- 7.1.2 Channel Mix Evolution (2024-2032)
Chapter 8. Regional Market Analysis – Global Overview
- 8.1 Global Regional Overview
- 8.1.1 Regional Volume Share
- 8.1.2 Regional Revenue Share
- 8.1.3 Regional Volume by Region
- 8.1.4 Regional Revenue by Region
- 8.1.5 Regional Forecast Through 2032
- 8.2 Cross-Regional Segment Analysis
- 8.2.1 By Distribution Channel
- 8.2.2 By Brand/Price Tier
Chapter 9. North America Physical Therapy Supplies Market
- 9.1 United States
- 9.2 Canada
- 9.3 Mexico
Chapter 10. Europe Physical Therapy Supplies Market
- 10.1 Germany
- 10.2 France
- 10.3 Italy
- 10.4 United Kingdom
- 10.5 Spain
- 10.6 Poland
- 10.7 Russia
- 10.8 Netherlands
- 10.9 Belgium
- 10.10 Sweden
- 10.11 Denmark
- 10.12 Norway
- 10.13 Rest of Europe
Chapter 11. Asia Pacific Physical Therapy Supplies Market
- 11.1 China
- 11.2 India
- 11.3 Japan
- 11.4 South Korea
- 11.5 Thailand
- 11.6 Indonesia
- 11.7 Vietnam
- 11.8 Malaysia
- 11.9 Australia
- 11.10 Rest of Asia Pacific
Chapter 12. Latin America Physical Therapy Supplies Market
- 12.1 Brazil
- 12.2 Argentina
- 12.3 Colombia
- 12.4 Chile
- 12.5 Rest of Latin America
Chapter 13. Middle East Physical Therapy Supplies Market
- 13.1 Saudi Arabia
- 13.2 United Arab Emirates
- 13.3 Turkey
- 13.4 Israel
- 13.5 Iran
- 13.6 Rest of the Middle East
Chapter 14. Africa Physical Therapy Supplies Market
- 14.1 South Africa
- 14.2 Egypt
- 14.3 Nigeria
- 14.4 Morocco
- 14.5 Rest of Africa
Chapter 15. Physical Therapy Supplies Company Profiles
- 15.1 [Company 01]
- 15.1.1 Company Overview
- 15.1.2 Key Management Personnel
- 15.1.3 Products & Services Portfolio
- 15.1.4 Financial Performance
- 15.1.5 Key Market Focus & Geographic Presence
- 15.1.6 Recent Developments & Strategic Initiatives
Note: The company profile list is preliminary and may change based on research findings, market developments, data availability, and client requirements.
Chapter 16. Appendices
- Appendix A – List of Abbreviations & Acronyms
- Appendix B – Industry Classification Code Reference – Full Series
- Appendix C – Production & Capacity Data Tables
- Appendix D – End-Use & Demand Base Tables
- Appendix E – Consumption & Replacement Rate Assumptions
- Appendix F – ASP Reference Tables
- Appendix G – Manufacturing & Facility Database
- Appendix H – Import-Export Data Tables
- Appendix I – Regulatory Summary Tables
- Appendix J – Primary Research Participant List (Anonymized)
- Appendix K – Primary Research Questionnaire Framework
- Appendix L – Data Sources & Bibliography
- Appendix M – Market Size Divergence & Source Comparison
Chapter 17. Research Methodology
- 17.1 Research Framework & Philosophy
- 17.2 Secondary Research – Sources, Hierarchy & Data Extraction
- 17.3 Data Modeling – Bottom-Up & Top-Down Market Sizing
- 17.4 Primary Research – Stakeholder Framework, LOI & Sample Sizes
- 17.5 Forecast Methodology – Regression, Scenario & Sensitivity Analysis
- 17.6 Quality Control – Four-Layer Validation Framework
- 17.7 Limitations & Standard Assumptions
- 17.8 Disclaimer
