
Market Overview
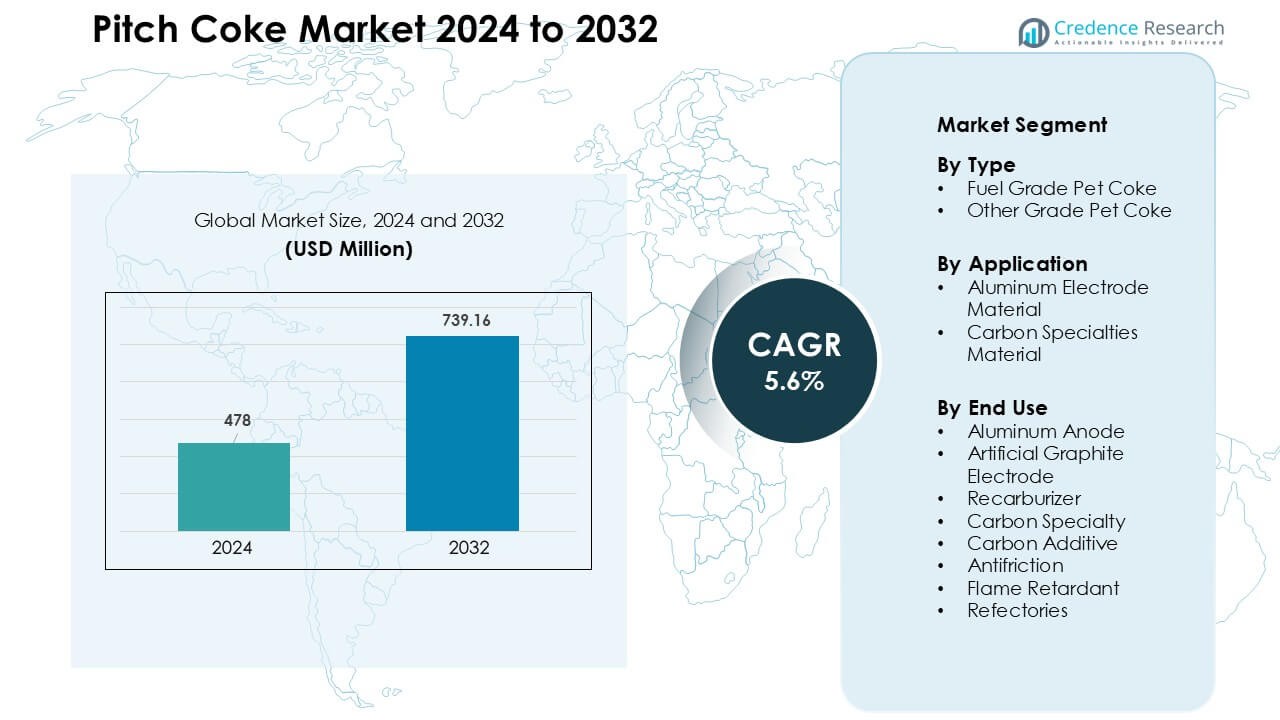
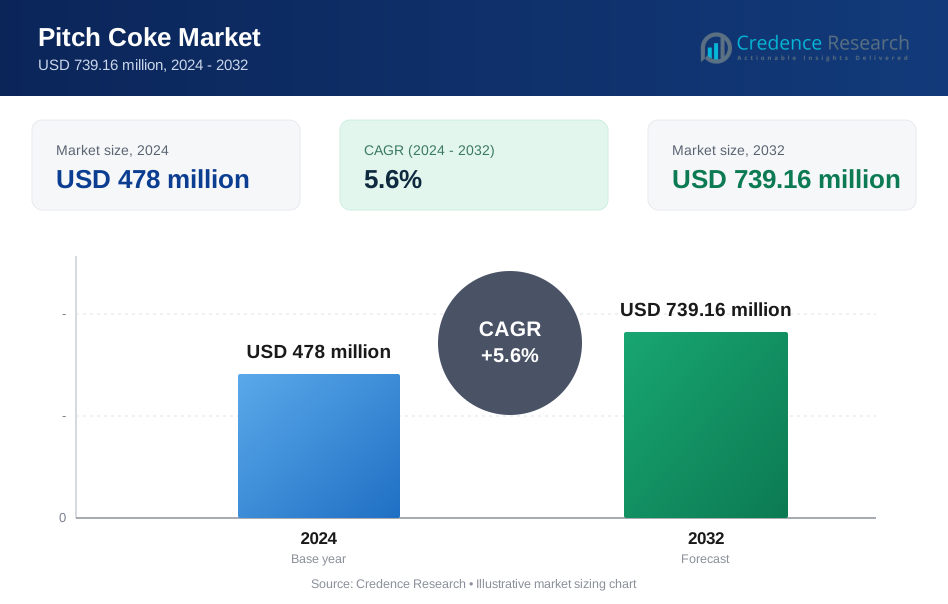
Pitch Coke Market was valued at USD 478 million in 2024 and is anticipated to reach USD 739.16 million by 2032, growing at a CAGR of 5.6% during the forecast period.
| REPORT ATTRIBUTE | DETAILS |
|---|---|
| Historical Period | 2020-2023 |
| Base Year | 2024 |
| Forecast Period | 2025-2032 |
| Pitch Coke Market Size 2024 | USD 478 Million |
| Pitch Coke Market, CAGR | 5.6% |
| Pitch Coke Market Size 2032 | USD 739.16 Million |
The pitch coke market is shaped by key players such as Mitsubishi Chemical, Shamokin Carbons, Bilbaina de Alquitranes, DONGSUNG CORPORATION, Tianjin Yunhai Carbon Element Products, Sojitz JECT Corporation, Ukrgraphit, RESORBENT S.R.O., SUMMIT CRM Limited, and Rain Carbon Inc., all competing through advanced calcination, high-purity pitch processing, and strong supply partnerships with aluminum and graphite producers. These companies focus on improving carbon quality, reducing impurities, and expanding capacity across major industrial hubs. Asia-Pacific led the global market with nearly 52% share in 2024, driven by large-scale aluminum smelting, strong electrode manufacturing growth, and abundant access to raw materials.
Market Insights
- The pitch coke market reached USD 478 million in 2024 and is projected to hit USD 739.16 million by 2032, registering a CAGR of 5.6 % during the forecast period.
- Growing aluminum smelting activity drives demand, as aluminum anode applications held about 46% share in 2024, supported by the need for high-purity carbon materials.
- Rising use of artificial graphite and carbon specialties boosts long-term adoption, with trends favoring high-purity, low-sulfur pitch coke for electrodes, composites, and advanced industrial applications.
- Competition intensifies among leading companies focusing on calcination efficiency, sulfur reduction, premium-grade production, and long-term contracts with smelters and electrode manufacturers.
- Asia-Pacific dominated with nearly 52% share, driven by large-scale smelting and electrode production, while North America and Europe maintained steady demand from specialty carbon and EAF steelmaking industries.
Market Segmentation Analysis:
By Type
Fuel Grade Pet Coke dominated the type segment in 2024 with about 63% share, supported by strong demand from metal smelters and carbon product manufacturers seeking high-carbon, low-ash feedstock. This grade gained wider adoption because producers preferred stable combustion performance and lower production costs compared with other carbon sources. The segment expanded further due to rising aluminum production and growth in integrated carbon plants across Asia. Other Grade Pet Coke recorded moderate growth, mainly driven by usage in premium carbon applications, but Fuel Grade Pet Coke remained ahead due to its large-scale industrial utility.
- For instance, in the aluminum industry, it is estimated that producing one metric ton of aluminum requires roughly 0.5 metric ton of calcined petcoke (or anode-grade coke) as a carbon anode feedstock.
By Application
Aluminum Electrode Material held the leading share in 2024 with nearly 58%, driven by rapid expansion of global aluminum smelting capacity and rising demand for high-purity pitch coke in anode production. Smelters relied on pitch coke because it supports strong electrical conductivity and improves anode density. Carbon Specialties Material grew steadily due to adoption in advanced carbon composites and battery components, yet aluminum applications remained dominant. Continued investments in electrolytic aluminum projects in China, India, and the Middle East strengthened this segment, ensuring stable long-term demand from primary metal producers.
- For instance, a major carbon-materials supplier Rain Carbon serving aluminium smelters produces calcined petroleum coke that meets the quality standards for anode manufacture, ensuring low ash and sulfur content and consistent electrical conductivity for stable smelter performance.
By End Use
Aluminum Anode emerged as the dominant end-use segment in 2024 with around 46% share, driven by heavy consumption of pitch coke in the fabrication of high-strength anodes used in aluminum smelting. Producers favored pitch coke because it improves anode performance, reduces energy loss, and enhances cell life in electrolytic operations. Artificial Graphite Electrode and Recarburizer applications grew due to steel sector expansion, while Carbon Specialty and Carbon Additive gained traction in high-tech industries. Despite broader end-use diversification, aluminum anodes-maintained leadership due to continuous growth in primary aluminum production.
Key Growth Drivers
Rising Aluminum Production Worldwide
The expansion of global aluminum smelting is a major growth driver for the pitch coke market. Primary aluminum producers continue to increase capacity in Asia, the Middle East, and Europe to meet rising demand from construction, transportation, and packaging industries. Pitch coke plays a central role in anode manufacturing because it delivers high carbon purity, structural integrity, and strong electrical conductivity. The shift toward energy-efficient smelting technologies has further increased demand for low-impurity anode materials. Large smelters in China, India, and the Gulf countries are investing in modern electrolytic cells that rely on consistent-quality pitch coke for stable performance. This strong dependence strengthens long-term consumption trends and creates steady procurement cycles, especially among integrated metal producers. As lightweight aluminum use accelerates in automotive components, beverage cans, and renewable infrastructure, pitch coke demand is expected to rise in parallel. Continued industrialization in emerging economies reinforces this upward trajectory.
- For instance, global primary aluminum production recently reached record levels annualized output hit ~71.2 million metric tons when smelters globally operated at high run-rates. This scale of production intensifies demand for quality carbon inputs in anode manufacture.
Growth in Artificial Graphite and Specialty Carbon Materials
Rising production of artificial graphite electrodes and high-performance carbon products drives significant demand for pitch coke. Artificial graphite is widely used in electric arc furnaces (EAFs), which are expanding due to growing scrap steel recycling and decarbonization efforts in the steel industry. Pitch coke serves as a key precursor material that enhances electrode density, conductivity, and thermal stability. Beyond steelmaking, rapid growth in specialty carbon materials including carbon composites, carbon brushes, friction products, and battery-grade carbon creates new opportunities. The electronics and energy storage industries are adopting advanced carbon grades for their high temperature resistance and mechanical strength. Many manufacturers are shifting toward coal- and petroleum-based pitch coke because it supports precision forming and high structural consistency. As global investment increases in EV batteries, semiconductor manufacturing, and advanced industrial components, specialty carbon applications continue to elevate the demand for high-quality pitch coke.
- For instance, the global market for graphite electrodes widely produced from synthetic/artificial graphite using petroleum coke or pitch coke feedstock is experiencing rising demand due to the increased use of EAF-based steel production globally.
Expanding Applications in Recarburizers and Metallurgical Additives
The growing use of recarburizers in steel and foundry operations significantly boosts pitch coke consumption. Pitch coke is valued for its high carbon content, low sulfur presence, and excellent solubility, making it effective for restoring carbon levels during molten metal processing. Foundries and metallurgical plants prefer pitch coke over traditional carbon additives because it provides more predictable absorption rates and enhances metallurgical quality. Growth in ductile iron production, alloy steel manufacturing, and precision castings has intensified demand for high-purity recarburizers. Increasing automation and quality control in foundries further strengthen this shift toward engineered carbon additives. The automotive, machinery, and heavy equipment sectors are expanding, which raises consumption of cast components that rely on high-grade carbon inputs. With industrial development accelerating across Southeast Asia, Africa, and Latin America, consumption of pitch-coke-based recarburizers continues to rise, reinforcing its importance in modern metallurgical processes.
Key Trends & Opportunities
Advancements in High-Purity Pitch Coke for Battery and EV Technologies
A major emerging trend is the rising use of high-purity pitch coke in lithium-ion batteries and next-generation energy storage technologies. As electric vehicle adoption accelerates, battery manufacturers are looking for advanced carbon materials that enhance anode stability, cycle life, and conductivity. High-purity pitch coke offers a strong opportunity due to its ability to produce engineered carbon with uniform microstructure. Companies are investing in purification technologies, such as advanced calcination and solvent extraction, to upgrade pitch coke for battery-grade material. The expansion of gigafactories in China, Europe, and the United States adds strong momentum to this trend. Battery firms are exploring pitch-derived carbon as a competitive alternative to synthetic graphite, especially for high-performance anodes. This shift creates a major opportunity for pitch coke manufacturers to diversify beyond traditional metallurgical applications and enter the fast-growing EV and energy storage markets.
- For instance, recent research has demonstrated that carbon derived from petroleum- or pitch-based coke can be processed into graphite-anode materials suitable for lithium-ion batteries, with controlled carbonization and graphitization, delivering stable electrochemical performance comparable to synthetic graphite.
Increasing Investments in Carbon Composite and High-Performance Materials
Pitch coke demand is rising as industries shift toward lightweight and high-strength carbon composites used in aerospace, automotive, industrial machinery, and electronics. The need for structural components that provide heat resistance, chemical stability, and reduced weight has accelerated the adoption of carbon-based materials. Pitch coke serves as a key feedstock for producing carbon fibers, carbon matrix composites, and advanced friction materials. Manufacturers are focusing on upgrading pitch coke quality to suit precise mechanical and thermal requirements. Countries investing in advanced manufacturing such as Japan, South Korea, Germany, and the United States are driving new opportunities for specialty carbon applications. The continued move toward electrification, renewable energy systems, and thermal insulation technologies further expands the scope for pitch-coke-based composites. This trend positions pitch coke as an essential raw material for high-value engineering applications.
Key Challenges
Environmental Restrictions and Emission Control Regulations
Stringent environmental policies form a major challenge for the pitch coke market. Manufacturing processes such as distillation, calcination, and carbonization emit particulate matter, sulfur oxides, and volatile organic compounds. Governments across North America, Europe, and Asia are imposing tighter emission norms on carbon processing plants. Compliance requires costly investments in flue-gas desulfurization, carbon capture, dust-control systems, and energy-efficient furnace technologies. Smaller manufacturers face operational strains due to higher environmental compliance costs. Additionally, public and regulatory pressure to reduce dependence on fossil-based carbon materials is creating long-term uncertainty. Many downstream users, particularly in metals and automotive sectors, are exploring low-carbon alternatives, which could temper demand. These evolving regulations increase production costs and limit expansion for pitch coke producers.
Volatility in Feedstock Availability and Price Fluctuations
Pitch coke production depends heavily on the availability of coal tar pitch, petroleum residue, and other heavy feedstocks. Price volatility in these raw materials poses a significant challenge for market stability. Refinery operating rates, coking capacity shifts, and constraints in coal tar production directly influence pitch coke supply. Unexpected disruptions, such as refinery shutdowns or fluctuations in metallurgical coke production, can trigger supply shortages. These conditions lead to inconsistent pricing and reduced predictability for manufacturers and downstream industries. Producers must also manage feedstock quality variations, which affect the consistency of the final product. As supply chains experience pressures from geopolitical tensions, energy market swings, and transportation bottlenecks, manufacturers face increased procurement risk. This instability limits long-term planning and impacts profitability for pitch coke producers.
Regional Analysis
North America
North America held roughly 22% share of the pitch coke market in 2024, supported by strong demand from aluminum smelters, specialty carbon producers, and steel recyclers. The United States remained the primary consumer due to its large EAF steelmaking base and growing investments in carbon composites for aerospace and defense. Canada contributed steady demand from aluminum operations and engineered carbon applications. Technological adoption in calcination and purification improved product quality, while regional manufacturers focused on high-value carbon specialties. However, stricter emission norms and higher operating costs continued to shape production strategies across the region.
Europe
Europe accounted for around 18% share in 2024, driven by strong demand from specialty carbon manufacturers and advanced material producers. Germany, Norway, and France remained key consumers due to established aluminum smelting and carbon composite production. The region’s focus on energy-efficient manufacturing and low-impurity anode materials supported moderate growth. European policies promoting recycling increased reliance on EAF steel, which boosted electrode-related consumption. However, reduced coal tar availability and stringent environmental regulations created sourcing challenges for regional processors. Despite this, Europe stayed important for premium carbon applications used in aerospace, industrial machinery, and high-performance engineering.
Asia-Pacific
Asia-Pacific dominated the global pitch coke market with nearly 52% share in 2024, anchored by massive consumption from China, India, South Korea, and Japan. China led due to extensive aluminum smelting capacity and strong demand for anode-grade coke in electrolytic operations. India showed rapid growth in steelmaking, foundry recarburizers, and carbon additive applications. Expanding EV battery production and increased investment in specialty carbon materials supported regional demand. Asia-Pacific also benefited from competitive production costs, integrated supply chains, and abundant feedstock availability. This combination positioned the region as the central hub for both volume production and end-use industries.
Latin America
Latin America captured close to 5% share of the pitch coke market in 2024, driven mainly by Brazil’s aluminum and steel industries. Brazil’s robust primary aluminum production and expanding EAF steelmaking supported steady demand for anode materials and recarburizers. Mexico contributed additional consumption from automotive castings and metallurgical applications. Regional investments in mining, metal refining, and industrial components increased adoption of engineered carbon products. However, limited local pitch coke production and dependence on imported feedstock created supply constraints. Despite these challenges, Latin America continued to gain traction as metal processing activities expanded across the region.
Middle East & Africa
The Middle East & Africa region held nearly 3% share in 2024, supported by aluminum smelting hubs in the UAE, Bahrain, and Saudi Arabia. These countries invested heavily in modern electrolytic cells, which rely on consistent-quality pitch coke for anode production. South Africa added demand for metallurgical applications and specialty carbon uses in mining equipment and refractories. Access to competitive energy pricing and large-scale smelting facilities boosted material consumption. However, the region remained dependent on imported pitch coke due to limited manufacturing capacity. Ongoing industrialization and metal sector expansion are expected to strengthen long-term demand.
Market Segmentations:
By Type
- Fuel Grade Pet Coke
- Other Grade Pet Coke
By Application
- Aluminum Electrode Material
- Carbon Specialties Material
By End Use
- Aluminum Anode
- Artificial Graphite Electrode
- Recarburizer
- Carbon Specialty
- Carbon Additive
- Antifriction
- Flame Retardant
- Refectories
By Geography
- North America
- U.S.
- Canada
- Mexico
- Europe
- Germany
- France
- U.K.
- Italy
- Spain
- Rest of Europe
- Asia Pacific
- China
- Japan
- India
- South Korea
- South-east Asia
- Rest of Asia Pacific
- Latin America
- Brazil
- Argentina
- Rest of Latin America
- Middle East & Africa
- GCC Countries
- South Africa
- Rest of the Middle East and Africa
Competitive Landscape
The competitive landscape of the pitch coke market features a mix of global carbon producers, specialty material manufacturers, and integrated chemical companies focusing on high-purity carbon solutions. Leading players such as Mitsubishi Chemical, Shamokin Carbons, Bilbaina de Alquitranes, DONGSUNG CORPORATION, Tianjin Yunhai Carbon Element Products, Sojitz JECT Corporation, Ukrgraphit, RESORBENT S.R.O., SUMMIT CRM Limited, and Rain Carbon Inc. compete through advancements in calcination technology, upgraded pitch purification, and improved control of sulfur and volatile content. Many companies are expanding production capacity to meet demand from aluminum smelting, artificial graphite, and carbon specialties. Strategic supply agreements with smelters and electrode manufacturers strengthen market positioning, while geographic expansion across Asia-Pacific and the Middle East helps reduce feedstock risk. Firms increasingly invest in R&D for specialty-grade pitch coke aimed at EV batteries, aerospace composites, and high-performance carbon materials. Sustainability pressures also encourage producers to deploy emission control systems and energy-efficient processing lines.
Key Player Analysis
- Mitsubishi Chemical
- Shamokin Carbons
- Bilbaina de Alquitranes, S.A
- DONGSUNG CORPORATION
- Tianjin Yunhai Carbon Element Products Co., Ltd.
- Sojitz JECT Corporation
- Ukrgraphit
- RESORBENT S.R.O.
- SUMMIT CRM Limited
- Rain Carbon Inc.
Recent Developments
- In October 2025, the parent of DONGSUNG CORPORATION, Dongsung Chemical, reported completion of expansion of its organic‑peroxide production line at its Yeosu plant, and commencement of full‑scale operations.
- In 2025, a global pitch coke report profiled RESORBENT SRO capacity, production, and growth. The study confirmed RESORBENT as a key supplier in updated competitive benchmarks for the pitch coke market.
- In January 2025, Rain Carbon announced a new coal tar pitch facility in Andhra Pradesh. The site will process, blend, and upgrade pitch for high-grade carbon products.
Report Coverage
The research report offers an in-depth analysis based on Type, Application, End Use and Geography. It details leading market players, providing an overview of their business, product offerings, investments, revenue streams, and key applications. Additionally, the report includes insights into the competitive environment, SWOT analysis, current market trends, as well as the primary drivers and constraints. Furthermore, it discusses various factors that have driven market expansion in recent years. The report also explores market dynamics, regulatory scenarios, and technological advancements that are shaping the industry. It assesses the impact of external factors and global economic changes on market growth. Lastly, it provides strategic recommendations for new entrants and established companies to navigate the complexities of the market.
Future Outlook
- Demand will rise as aluminum smelting capacity expands across Asia and the Middle East.
- High-purity pitch coke will gain traction due to growing artificial graphite production.
- Battery and EV industries will explore pitch-derived carbon for advanced anode materials.
- Carbon composite applications will create new opportunities in aerospace and automotive sectors.
- Producers will invest in cleaner calcination systems to meet strict emission norms.
- Supply chain integration will strengthen as companies secure long-term feedstock contracts.
- Specialty carbon grades will see higher adoption in electronics and high-temperature industries.
- Technological upgrades will improve pitch purity and reduce sulfur content.
- Recarburizer demand will increase as foundries shift toward high-efficiency carbon additives.
- Asia-Pacific will remain the dominant growth center due to large end-use industries.
Request a Free Sample
Fill in your details and we'll send you a free sample report.
- Sample data tables & charts
- Research methodology
Need a Custom Version of This Report?
Tailor the scope, geography, or segments to your exact requirements.
- Custom geography or segment scope
- Direct access to our analyst team
Frequently Asked Questions
What is the current market size for Pitch Coke Market, and what is its projected size in 2032?
At what Compound Annual Growth Rate is Pitch Coke Market projected to grow between 2024 and 2032?
Which Pitch Coke Market segment held the largest share in 2024?
What are the primary factors fueling the growth of Pitch Coke Market?
Who are the leading companies in Pitch Coke Market?
Which region commanded the largest share of Pitch Coke Market?
Table of Content
Chapter 1. Report Introduction
- 1.1 Report Description & Purpose
- 1.1.1 Report Title & Market Definition
- 1.1.2 Unique Selling Propositions (USP) & Key Differentiators
- 1.1.3 Value Proposition for Stakeholders
- 1.2 Research Objectives
- 1.2.1 Market Sizing Objectives (Volume & Revenue)
- 1.2.2 Segmentation Objectives
- 1.2.3 Competitive Intelligence Objectives
- 1.2.4 Forecast & Scenario Objectives
- 1.3 Report Scope
- 1.3.1 Pitch Coke Scope – Types & Subtypes Covered
- 1.3.2 Geographic Scope – Regions & Countries Covered
- 1.3.3 Historical Period, Base Year & Forecast Period (2024; forecast to 2032)
- 1.3.4 Inclusions & Exclusions
- 1.4 HS Code & Classification Framework
- 1.5 Currency, Units & Pricing Basis
- 1.6 Target Stakeholders
- 1.7 Limitations & Assumptions
Chapter 2. Executive Summary
- 2.1 Global Pitch Coke Market Snapshot
- 2.1.1 Market Size – Historical (2024) & Forecast (2024-2032) (2024: USD 478 million → 2032: USD 739.16 million)
- 2.1.2 Volume & Revenue – Global Totals
- 2.1.3 Key Market Highlights – Top Five Facts
- 2.2 Pitch Coke Market Segmentation Snapshot
- 2.2.1 Market Split by Region – 2024 vs. 2032
- 2.3 Competitive Snapshot
- 2.3.1 Top 10 Players by Revenue Share – 2024
- 2.3.2 Top 10 Players by Volume Share – 2024
- 2.3.3 Recent Strategic Developments (18-Month Summary)
- 2.4 Key Investment Highlights & Strategic Conclusions
Chapter 3. Pitch Coke Market Dynamics & Industry Analysis
- 3.1 Market Overview & Context
- 3.1.1 Pitch Coke Market Position in the Broader Automotive Value Chain
- 3.1.2 OEM vs. Replacement Market Dynamics
- 3.1.3 Market Maturity & Development Stage by Region
- 3.2 Pitch Coke Market Drivers
- 3.3 Pitch Coke Market Restraints & Challenges
- 3.4 Pitch Coke Market Opportunities
- 3.5 Porter's Five Forces Analysis
- 3.5.1 Threat of New Entrants
- 3.5.2 Bargaining Power of Suppliers
- 3.5.3 Bargaining Power of Buyers
- 3.5.4 Threat of Substitutes
- 3.5.5 Competitive Rivalry – Intensity Assessment
- 3.6 Pitch Coke Value Chain Analysis
- 3.6.1 Upstream – Raw Material/Input Suppliers
- 3.6.1.1 Raw Material/Input 1
- 3.6.1.2 Raw Material/Input 2
- 3.6.1.3 Raw Material/Input 3
- 3.6.2 Midstream – Production/Manufacturing/Service Delivery
- 3.6.2.1 Production/Process Overview
- 3.6.2.2 Key Facility Locations & Capacity by Manufacturer
- 3.6.3 Downstream – Distribution & End Consumer
- 3.6.3.1 Primary Channel – B2B/OEM
- 3.6.3.2 Secondary Channels – Dealer, Retail, Online, Direct
- 3.6.4 Value Chain Profitability Analysis
- 3.6.1 Upstream – Raw Material/Input Suppliers
- 3.7 PESTEL Analysis
- 3.7.1 Political Factors
- 3.7.2 Economic Factors
- 3.7.3 Social Factors
- 3.7.4 Technological Factors
- 3.7.5 Environmental Factors
- 3.7.6 Legal Factors
- 3.8 Pitch Coke Supply Chain Analysis
- 3.8.1 Raw Material/Input Supply Risk Assessment
- 3.8.2 Manufacturing Concentration Risk (Geographic Exposure)
- 3.8.3 Trade Disruption Impact Analysis
- 3.9 Regulatory & Policy Landscape
Note: The regulatory and policy landscape section covers regulations based on their applicability to the market, Pitch Coke category, geography, and scope of the study. Only regulatory frameworks with a material impact on operations, compliance, trade, sustainability, or market access are analyzed in detail.
Chapter 4. Key Investment Pockets & Opportunity Analysis
- 4.1 Pitch Coke Market Attractiveness Analysis
- 4.1.1 By Region – Investment Attractiveness Matrix (Volume × CAGR)
- 4.2 Absolute Revenue Growth Opportunity
- 4.2.1 By Region – Absolute USD Growth Through 2032
- 4.3 Incremental Volume Opportunity
- 4.3.1 By Region – Incremental Volume Through 2032
- 4.3.2 Segment – Incremental Volume
- 4.4 Emerging Submarket Opportunity Deep Dive (Subject to Applicability)
- 4.5 Emerging Market Opportunity Scorecards
- 4.5.1 United States
- 4.5.2 Europe
- 4.5.3 Asia
- 4.5.4 Middle East & Africa
Note: Emerging Market Opportunity Scorecards will be included based on relevance and strategic importance. Regions listed are indicative and may vary depending on data availability and market dynamics.
Chapter 5. Pitch Coke Import-Export Analysis & Trade Flows
- 5.1 Global Trade Overview
- 5.1.1 Global Export Value by Country (2024)
- 5.1.2 Global Export Volume by Country (2024)
- 5.1.3 Global Import Value by Country (2024)
- 5.1.4 Global Import Volume by Country (2024)
- 5.1.5 Net Trade Balance by Country (2024)
- 5.2 Export Analysis – Segment
- 5.2.1 Type 1 (HS Code)
- 5.2.2 Type 2 (HS Code)
- 5.2.3 Type 3 (HS Code)
- 5.2.4 Type 4 (HS Code)
- 5.2.5 Type 5 (HS Code)
- 5.3 Import Analysis – Segment
- 5.3.1 Type 1 (HS Code)
- 5.3.2 Type 2 (HS Code)
- 5.3.3 Type 3 (HS Code)
- 5.3.4 Type 4 (HS Code)
- 5.3.5 Type 5 (HS Code)
- 5.4 Average Unit Trade Prices
- 5.4.1 Average Export Price – Segment & Country
- 5.4.2 Average Import Price – Segment & Source Country
- 5.4.3 Price Trends (2024)
- 5.5 Key Trade Route Analysis
- 5.5.1 Trade Route 1
- 5.5.2 Trade Route 2
- 5.5.3 Trade Route 3
- 5.5.4 Trade Route 4
- 5.5.5 Trade Route 5
- 5.6 Trade Policy Impact Assessment
- 5.6.1 US Anti-Dumping & Section 301 Tariffs
- 5.6.2 EU Customs Union Impact
- 5.6.3 Major Free Trade Agreements
- 5.6.4 USMCA Rules of Origin
Note: Trade policy analysis will be included only where relevant to the Pitch Coke market.
Chapter 6. Competitive Landscape & Company Benchmarking
- 6.1 Pitch Coke Market Concentration & Structure
- 6.1.1 Herfindahl-Hirschman Index (HHI) – vs. 2024
- 6.1.2 Tier 1, Tier 2 & Tier 3 Market Structure
- 6.1.3 Global, Regional & Local Player Dynamics
- 6.2 Pitch Coke Market Share Analysis – 2024
- 6.2.1 Global Revenue Share by Company
- 6.2.2 Global Volume Share by Company
- 6.2.3 Regional Revenue Share
- 6.2.4 Market Share Evolution ( vs. 2024)
- 6.2.5 OEM Segment Share by Company
- 6.2.6 Replacement Segment Share by Company
- 6.3 Production/Delivery Capacity & Facility Analysis
- 6.3.1 Global Installed Capacity
- 6.3.2 Capacity Utilization Rates
- 6.3.3 Production/Output Volume
- 6.3.4 Facility Locations & Capacity Map
- 6.3.5 Planned Capacity Additions
- 6.4 Pitch Coke Competitive Benchmarking Matrix
- 6.4.1 Revenue, Volume, CAGR & Profitability Comparison
- 6.4.2 Channel Revenue Mix
- 6.4.3 Geographic Revenue Exposure
- 6.4.4 R&D Intensity
- 6.4.5 Sustainability Maturity
- 6.5 Strategic Developments in Pitch Coke (Last 24 Months)
- 6.5.1 Mergers, Acquisitions & Divestments
- 6.5.2 New Pitch Coke Launches
- 6.5.3 Facility Expansions
- 6.5.4 Strategic Alliances, Joint Ventures & Partnerships
- 6.5.5 Distribution Expansion & Market Entry
- 6.5.6 Sustainability & ESG Initiatives
- 6.6 Competitive Strategy Mapping
- 6.6.1 Leader, Challenger, Follower & Niche Classification
- 6.6.2 Pricing Strategy Comparison
- 6.6.3 Channel Strategy Matrix
Note: Strategic developments are included based on their materiality and the availability of reliable information.
Chapter 7. Global Pitch Coke Market – By Distribution Channel
- 7.1 Segment Overview
- 7.1.1 Volume & Revenue Split by Channel (2024 & 2032)
- 7.1.2 Channel Mix Evolution (2024-2032)
Chapter 8. Regional Market Analysis – Global Overview
- 8.1 Global Regional Overview
- 8.1.1 Regional Volume Share
- 8.1.2 Regional Revenue Share
- 8.1.3 Regional Volume by Region
- 8.1.4 Regional Revenue by Region
- 8.1.5 Regional Forecast Through 2032
- 8.2 Cross-Regional Segment Analysis
- 8.2.1 By Distribution Channel
- 8.2.2 By Brand/Price Tier
Chapter 9. North America Pitch Coke Market
- 9.1 United States
- 9.2 Canada
- 9.3 Mexico
Chapter 10. Europe Pitch Coke Market
- 10.1 Germany
- 10.2 France
- 10.3 Italy
- 10.4 United Kingdom
- 10.5 Spain
- 10.6 Poland
- 10.7 Russia
- 10.8 Netherlands
- 10.9 Belgium
- 10.10 Sweden
- 10.11 Denmark
- 10.12 Norway
- 10.13 Rest of Europe
Chapter 11. Asia Pacific Pitch Coke Market
- 11.1 China
- 11.2 India
- 11.3 Japan
- 11.4 South Korea
- 11.5 Thailand
- 11.6 Indonesia
- 11.7 Vietnam
- 11.8 Malaysia
- 11.9 Australia
- 11.10 Rest of Asia Pacific
Chapter 12. Latin America Pitch Coke Market
- 12.1 Brazil
- 12.2 Argentina
- 12.3 Colombia
- 12.4 Chile
- 12.5 Rest of Latin America
Chapter 13. Middle East Pitch Coke Market
- 13.1 Saudi Arabia
- 13.2 United Arab Emirates
- 13.3 Turkey
- 13.4 Israel
- 13.5 Iran
- 13.6 Rest of the Middle East
Chapter 14. Africa Pitch Coke Market
- 14.1 South Africa
- 14.2 Egypt
- 14.3 Nigeria
- 14.4 Morocco
- 14.5 Rest of Africa
Chapter 15. Pitch Coke Company Profiles
- 15.1 [Company 01]
- 15.1.1 Company Overview
- 15.1.2 Key Management Personnel
- 15.1.3 Products & Services Portfolio
- 15.1.4 Financial Performance
- 15.1.5 Key Market Focus & Geographic Presence
- 15.1.6 Recent Developments & Strategic Initiatives
Note: The company profile list is preliminary and may change based on research findings, market developments, data availability, and client requirements.
Chapter 16. Appendices
- Appendix A – List of Abbreviations & Acronyms
- Appendix B – Industry Classification Code Reference – Full Series
- Appendix C – Production & Capacity Data Tables
- Appendix D – End-Use & Demand Base Tables
- Appendix E – Consumption & Replacement Rate Assumptions
- Appendix F – ASP Reference Tables
- Appendix G – Manufacturing & Facility Database
- Appendix H – Import-Export Data Tables
- Appendix I – Regulatory Summary Tables
- Appendix J – Primary Research Participant List (Anonymized)
- Appendix K – Primary Research Questionnaire Framework
- Appendix L – Data Sources & Bibliography
- Appendix M – Market Size Divergence & Source Comparison
Chapter 17. Research Methodology
- 17.1 Research Framework & Philosophy
- 17.2 Secondary Research – Sources, Hierarchy & Data Extraction
- 17.3 Data Modeling – Bottom-Up & Top-Down Market Sizing
- 17.4 Primary Research – Stakeholder Framework, LOI & Sample Sizes
- 17.5 Forecast Methodology – Regression, Scenario & Sensitivity Analysis
- 17.6 Quality Control – Four-Layer Validation Framework
- 17.7 Limitations & Standard Assumptions
- 17.8 Disclaimer
