Market Overview
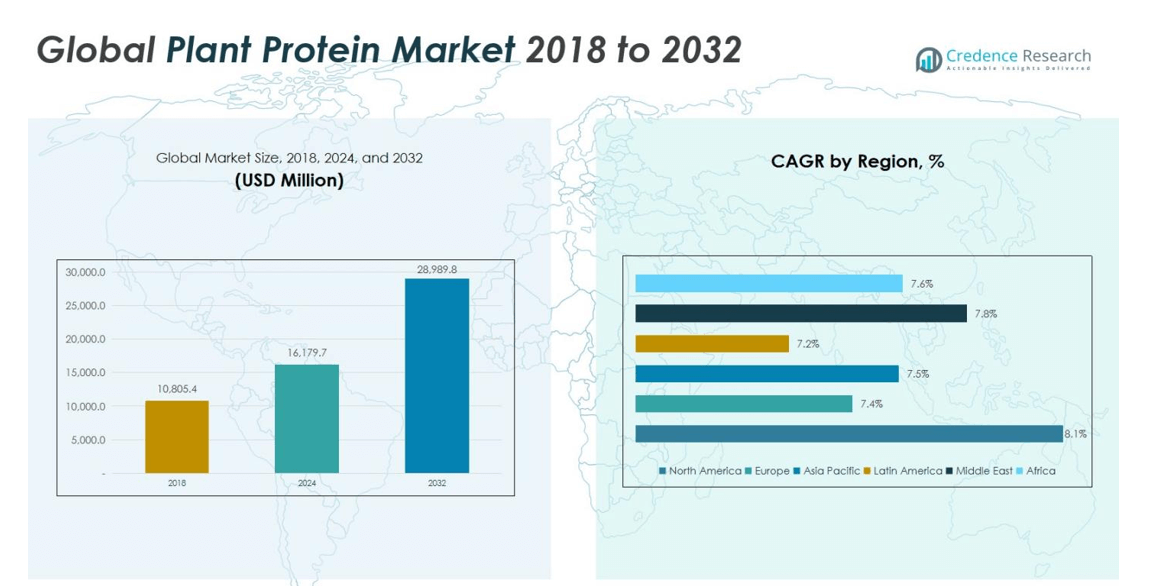
Plant Protein Market size was valued at USD 10,805.4 Million in 2018 and is expected to reach USD 16,179.7 Million in 2024. The market is anticipated to grow further, reaching USD 28,989.8 Million by 2032, at a CAGR of 7.62% during the forecast period.
| REPORT ATTRIBUTE |
DETAILS |
| Historical Period |
2020-2023 |
| Base Year |
2024 |
| Forecast Period |
2025-2032 |
| Plant Protein Market Size 2024 |
USD 16,179.7 Million |
| Plant Protein Market, CAGR |
7.62% |
| Plant Protein Market Size 2032 |
USD 28,989.8 Million |
The Plant Protein Market is dominated by leading players such as Ingredion Inc., Cargill Incorporated, Archer Daniels Midland Company, Ajinomoto Co., Glanbia PLC, Azaki Gulico Co., Axiom’s Foods, E.I. Du Pont de Nemours and Company, and Cosucra Group. These companies focus on product innovation, strategic partnerships, and expansion across key regions to strengthen their market presence. Asia Pacific leads the market with a 29% share, driven by rising health awareness, growing urban populations, and increased demand for meat and dairy alternatives. Europe follows with a 28% share, supported by vegan and flexitarian diet adoption and government initiatives promoting sustainable food production. North America holds a 22% share, fueled by high consumer health consciousness and widespread retail availability of protein isolates, concentrates, and textured products. These regions combined reflect the market’s growth potential and the strategic influence of major players in shaping global plant protein consumption trends.
Market Insights
- The Plant Protein Market was valued at USD 16,179.7 Million in 2024 and is projected to reach USD 28,989.8 Million by 2032, growing at a CAGR of 7.62%.
- Growth is driven by increasing demand for plant-based diets, rising health and wellness awareness, and environmental sustainability concerns, which are boosting adoption across meat and dairy alternatives, bakery products, and nutritional supplements.
- Key trends include innovation in meat and dairy alternatives, development of protein isolates and concentrates with improved taste and texture, and expansion into emerging markets such as Asia Pacific, Latin America, and the Middle East.
- The competitive landscape is led by Ingredion Inc., Cargill Incorporated, Archer Daniels Midland Company, Ajinomoto Co., and Glanbia PLC, with companies focusing on product innovation, partnerships, and regional expansion to strengthen market presence.
- Regional analysis shows Asia Pacific leading with 29% share, followed by Europe at 28%, North America 22%, Latin America 7%, Middle East 4%, and Africa 2%, with soy protein as the dominant source segment.
Access crucial information at unmatched prices!
Request your sample report today & start making informed decisions powered by Credence Research Inc.!
Download Sample
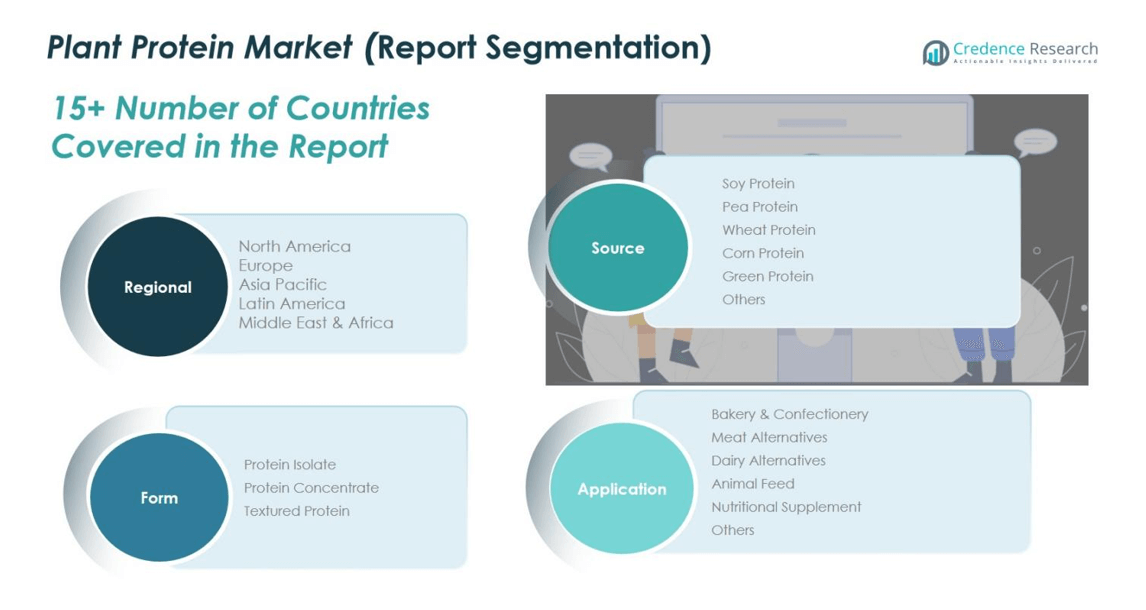
Market Segmentation Analysis:
By Source:
In the plant protein market, the source segment is dominated by soy protein, accounting for 35% of the market share. Soy protein’s high nutritional value, versatility in food formulations, and cost-effectiveness drive its adoption across multiple applications. Pea protein follows as a growing sub-segment, gaining traction due to its hypoallergenic properties and rising demand for clean-label products. Other sources, including wheat, corn, and green protein, contribute to diversification, driven by consumer preference for plant-based diets and the growing popularity of functional and fortified foods.
- For instance, soy protein isolate, which contains approximately 90% protein, is widely used in protein bars, shakes, and meat alternatives due to its complete amino acid profile and cost-effectiveness.
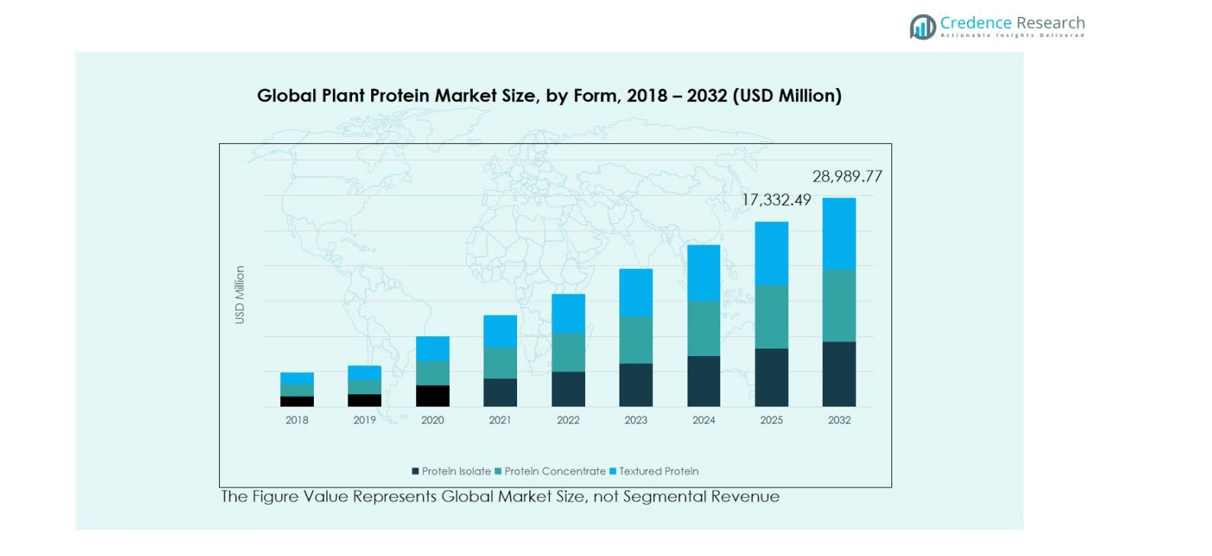
By Form:
The form segment is led by protein isolate, holding around 45% of the market share due to its high protein content, ease of incorporation in beverages, and suitability for dietary supplements. Protein concentrate represents a significant portion as well, preferred in bakery and meat alternative products for its functional properties and lower processing cost. Textured protein is increasingly adopted in meat analogs and plant-based snacks. The growth of the isolate segment is driven by rising health consciousness, demand for high-protein foods, and innovation in nutritional products targeting athletes and wellness-focused consumers.
- For instance, Grande Custom Ingredients Group offers Grande Ultra WPI, a whey protein isolate designed for beverage clarity and clean flavor, using a patented process for better taste and higher protein content.
By Application:
Within applications, meat alternatives dominate the market with a 30% share, fueled by rising veganism, flexitarian diets, and environmental concerns related to traditional meat production. Dairy alternatives and bakery & confectionery segments are also expanding due to lactose intolerance awareness and growing demand for plant-based baked goods. Nutritional supplements and animal feed segments are driven by functional benefits and protein enrichment trends. The meat alternative sub-segment’s growth is primarily supported by product innovation, rising consumer awareness, and the increasing availability of convenient, protein-rich plant-based options globally.
Key Growth Drivers
Rising Demand for Plant-Based Diets
The increasing adoption of plant-based diets worldwide is a primary growth driver for the plant protein market. Consumers are shifting toward vegan and flexitarian lifestyles due to health awareness, ethical concerns, and environmental sustainability. This shift is driving demand for protein-rich alternatives to meat and dairy products, with soy, pea, and wheat proteins leading the market. The trend is supported by growing product innovation, availability of convenient ready-to-eat options, and global campaigns promoting plant-based nutrition, ensuring sustained market growth.
- For instance, Roquette recently introduced NUTRALYS® T WHEAT 600L, its first textured wheat protein, which offers meat-like fibers and over 60% protein content to meet demand for fibrous, chicken-style alternatives.
Health and Wellness Awareness
Growing consumer focus on health and wellness is boosting the demand for plant proteins. Awareness of the benefits of high-protein diets, including weight management, muscle building, and overall nutritional balance, is encouraging the inclusion of protein isolates and concentrates in foods, beverages, and supplements. Plant proteins are preferred due to their lower saturated fat content and natural origin. This driver is further strengthened by functional foods and fortified products, catering to fitness enthusiasts, aging populations, and individuals seeking clean-label, allergen-friendly alternatives.
- For instance, Nestlé offers Compleat® Peptide 1.5, a formula containing hydrolyzed pea protein isolate alongside nutrient-rich fruit and vegetable ingredients, designed to support muscle maintenance and nutritional needs in adults.
Environmental Sustainability and Ethical Concerns
Environmental concerns related to livestock farming and meat production are driving the plant protein market. Consumers increasingly prefer sustainable protein sources with lower carbon footprints, reduced water usage, and minimal environmental impact. Ethical considerations regarding animal welfare also contribute to the shift toward plant-based protein alternatives. Companies are responding with innovative, eco-friendly formulations and sourcing strategies. This driver is complemented by government initiatives promoting sustainable agriculture and rising investor interest in plant-based food ventures, supporting long-term market expansion.
Key Trends & Opportunities
Innovation in Meat and Dairy Alternatives
Innovation in plant-based meat and dairy alternatives is a major market trend, creating significant growth opportunities. Companies are developing products that closely mimic the taste, texture, and nutritional profile of animal-derived foods. Advances in protein extraction, formulation, and flavor enhancement technologies are enabling the creation of meat substitutes, plant-based cheeses, and protein-fortified beverages. Rising consumer demand for convenient, protein-rich, and sustainable alternatives presents opportunities for new product launches, collaborations, and expansion into emerging markets.
- For instance, Beyond Meat also reintroduced Beyond Chicken Pieces to over 1,900 Kroger stores, providing 21 grams of plant protein per serving and containing heart-healthy avocado oil with 0.5 grams of saturated fat per portion, compared to 3.8 grams in traditional chicken, emphasizing improved nutrition and ingredient transparency in plant-based meat alternatives.
Expansion in Emerging Markets
Emerging regions such as Asia Pacific, Latin America, and the Middle East present substantial growth opportunities for the plant protein market. Increasing disposable income, urbanization, and growing awareness of health and sustainability are driving adoption. Companies are investing in local manufacturing facilities, strategic partnerships, and targeted marketing campaigns to tap these markets. Expanding distribution channels through e-commerce, supermarkets, and specialty stores is enhancing product accessibility, while regional flavor preferences and dietary habits are inspiring tailored product offerings that cater to local consumer needs.
- For instance, Tomorrow Foods, backed by Blue Horizon, is building the continent’s first plant-based R&D center in Argentina. This facility enables the development of diversified protein isolates like peas, chickpeas, and mung beans, catering to local consumer preferences and driving product innovation across the region.
Key Challenges
High Production Costs
High production and processing costs pose a significant challenge in the plant protein market. Extraction, purification, and formulation processes for isolates and concentrates require advanced technology and specialized equipment, increasing overall product pricing. This can limit affordability for price-sensitive consumers, particularly in emerging markets. Additionally, sourcing high-quality raw materials, such as non-GMO soy and organic pea protein, further increases costs. Companies must invest in process optimization, scale efficiencies, and strategic partnerships to manage costs while maintaining product quality and competitive pricing.
Taste and Texture Limitations
Despite innovations, taste and texture remain a key challenge for plant protein products. Many consumers find plant-based alternatives less palatable than animal-derived proteins, limiting repeat purchases. Achieving a desirable mouthfeel, flavor profile, and consistency in meat substitutes, dairy alternatives, and protein beverages is technically complex. Overcoming these sensory limitations requires continuous R&D, advanced formulation techniques, and ingredient blending. Companies must balance functionality, nutritional content, and consumer preference to enhance acceptability and expand the market for mainstream adoption.
Regional Analysis
North America
North America accounted for a significant share of the plant protein market, representing 22% of the global market in 2024. The region’s market was valued at USD 2,341.53 million in 2018, reaching USD 3,612.23 million in 2024, and is projected to grow to USD 6,725.63 million by 2032 at a CAGR of 8.1%. Growth is driven by high consumer awareness of health and wellness, the popularity of plant-based diets, and increasing demand for meat and dairy alternatives. The U.S. leads the market, supported by strong retail distribution and innovation in protein isolates and concentrates.
Europe
Europe holds a dominant position in the plant protein market, with a 28% market share in 2024. The market grew from USD 3,086.02 million in 2018 to USD 4,559.90 million in 2024, and it is expected to reach USD 8,024.37 million by 2032 at a CAGR of 7.4%. Rising consumer preference for vegan and flexitarian diets, coupled with government support for sustainable food production, is driving demand. The UK, Germany, and France are key contributors, with innovation in meat and dairy alternatives further boosting adoption across bakery, beverages, and supplements.
Asia Pacific
Asia Pacific represents a 29% share of the global plant protein market in 2024, reflecting rapid growth across emerging economies. The market expanded from USD 3,685.72 million in 2018 to USD 5,496.01 million in 2024, with projections reaching USD 9,792.75 million by 2032 at a CAGR of 7.5%. Rising health awareness, growing urban populations, and increasing disposable incomes drive adoption. China, Japan, and India are the largest contributors, fueled by innovative plant-based products, expansion of retail channels, and rising interest in functional foods and nutritional supplements.
Latin America
Latin America holds a 7% share of the global market in 2024, with moderate but steady growth. The market grew from USD 790.95 million in 2018 to USD 1,154.54 million in 2024, and it is expected to reach USD 1,997.40 million by 2032 at a CAGR of 7.2%. Demand is driven by increasing health-conscious consumers, rising plant-based diet awareness, and adoption of protein-fortified foods. Brazil and Argentina are key markets, supported by product innovation in meat alternatives, beverages, and bakery products, along with expanding distribution networks across urban and semi-urban regions.
Middle East
The Middle East accounted for a 4% share of the global plant protein market in 2024. The market grew from USD 624.55 million in 2018 to USD 944.20 million in 2024, and it is projected to reach USD 1,713.30 million by 2032 at a CAGR of 7.8%. Growth is driven by increasing consumer awareness of healthy diets, the popularity of protein supplements, and adoption of plant-based food products among urban populations. GCC countries, Israel, and Turkey are leading contributors, with rising investments in retail and e-commerce channels facilitating market expansion.
Africa
Africa represents a 2% share of the global plant protein market in 2024, showing steady growth across the continent. The market increased from USD 276.62 million in 2018 to USD 412.81 million in 2024, and it is expected to reach USD 736.34 million by 2032 at a CAGR of 7.6%. Growth is driven by rising urbanization, increasing health-conscious consumers, and growing interest in protein-rich diets. South Africa and Egypt lead the market, supported by expanding retail penetration, introduction of fortified foods, and the development of plant-based product options for functional and nutritional applications.
Market Segmentations:
By Source
- Soy Protein
- Pea Protein
- Wheat Protein
- Corn Protein
- Green Protein
- Others
By Form:
- Protein Isolate
- Protein Concentrate
- Textured Protein
By Application:
- Bakery & Confectionery
- Meat Alternatives
- Dairy Alternatives
- Animal Feed
- Nutritional Supplements
- Others
By Region
- North America
- Europe
- Germany
- France
- U.K.
- Italy
- Spain
- Rest of Europe
- Asia Pacific
- China
- Japan
- India
- South Korea
- South-east Asia
- Rest of Asia Pacific
- Latin America
- Brazil
- Argentina
- Rest of Latin America
- Middle East & Africa
- GCC Countries
- South Africa
- Rest of the Middle East and Africa
Competitive Landscape
The competitive landscape of the plant protein market is led by key players such as Ingredion Inc., Cargill Incorporated, Archer Daniels Midland Company, Azaki Gulico Co., Ajinomoto Co., Axiom’s Foods, E.I. Du Pont de Nemours and Company, Glanbia PLC, and Cosucra Group. These companies are actively pursuing strategies such as product innovation, mergers and acquisitions, and partnerships to strengthen their market presence. They focus on developing high-protein isolates, concentrates, and textured proteins to meet the rising demand across bakery, meat and dairy alternatives, and nutritional supplement applications. Investments in research and development enhance product quality, taste, and functional properties. Regional expansion, strategic collaborations with distributors and retailers, and marketing initiatives targeting health-conscious consumers further support growth. The competitive environment emphasizes sustainability, clean-label formulations, and the creation of plant-based solutions that address both functional and nutritional requirements, fostering differentiation and long-term market positioning.
Shape Your Report to Specific Countries or Regions & Enjoy 30% Off!
Key Player Analysis
- Ingredion Inc.
- Cargill Incorporated
- Archer Daniels Midland Company
- Azaki Gulico Co.
- Ajinomoto Co., Inc., Ltd.
- Axiom’s Foods
- I. Du Pont de Nemours and Company
- Glanbia PLC
- Cosucra Group
- Other Key Players
Recent Developments
- In November 2024, Ingredion Incorporated and Lantmännen established a strategic partnership to develop sustainably sourced plant-based proteins. Lantmännen is investing over €100 million in a state-of-the-art factory in Sweden to support this initiative.
- In April 2025, Khloé Kardashian launched Khloud Protein Popcorn, a health-conscious snack offering 7 grams of protein per serving. The product is available in three flavors and is designed for consumers seeking clean, high-protein alternatives.
- In August 2025, Australian plant-based meat producer v2food acquired U.S.-based Daring Foods, a leading unbreaded plant-based chicken brand.
- In April 2025, Burcon NutraScience announced that its alliance partner, RE ProMan LLC, successfully completed the acquisition of a protein production facility in Galesburg, Illinois. This acquisition is expected to enhance Burcon’s production capabilities for its plant-based protein products.
Report Coverage
The research report offers an in-depth analysis based on Source, Form, Application and Region. It details leading market players, providing an overview of their business, product offerings, investments, revenue streams, and key applications. Additionally, the report includes insights into the competitive environment, SWOT analysis, current market trends, as well as the primary drivers and constraints. Furthermore, it discusses various factors that have driven market expansion in recent years. The report also explores market dynamics, regulatory scenarios, and technological advancements that are shaping the industry. It assesses the impact of external factors and global economic changes on market growth. Lastly, it provides strategic recommendations for new entrants and established companies to navigate the complexities of the market.
Future Outlook
- The plant protein market is expected to witness steady growth driven by increasing consumer demand for plant-based diets.
- Rising health awareness and focus on nutritional supplements will continue to boost adoption across all age groups.
- Innovation in meat and dairy alternatives will expand product offerings and attract new consumers.
- Emerging markets will provide significant growth opportunities due to rising disposable income and urbanization.
- Expansion of e-commerce and retail channels will enhance product accessibility and visibility globally.
- Functional and fortified plant protein products will gain popularity among fitness and wellness-focused consumers.
- Sustainable sourcing and environmentally friendly production practices will drive market preference.
- Collaborations and partnerships among key players will accelerate product development and distribution.
- Advances in protein extraction and formulation technologies will improve taste, texture, and quality.
- Government initiatives promoting healthy diets and plant-based alternatives will support long-term market growth.


