
Market Overview:
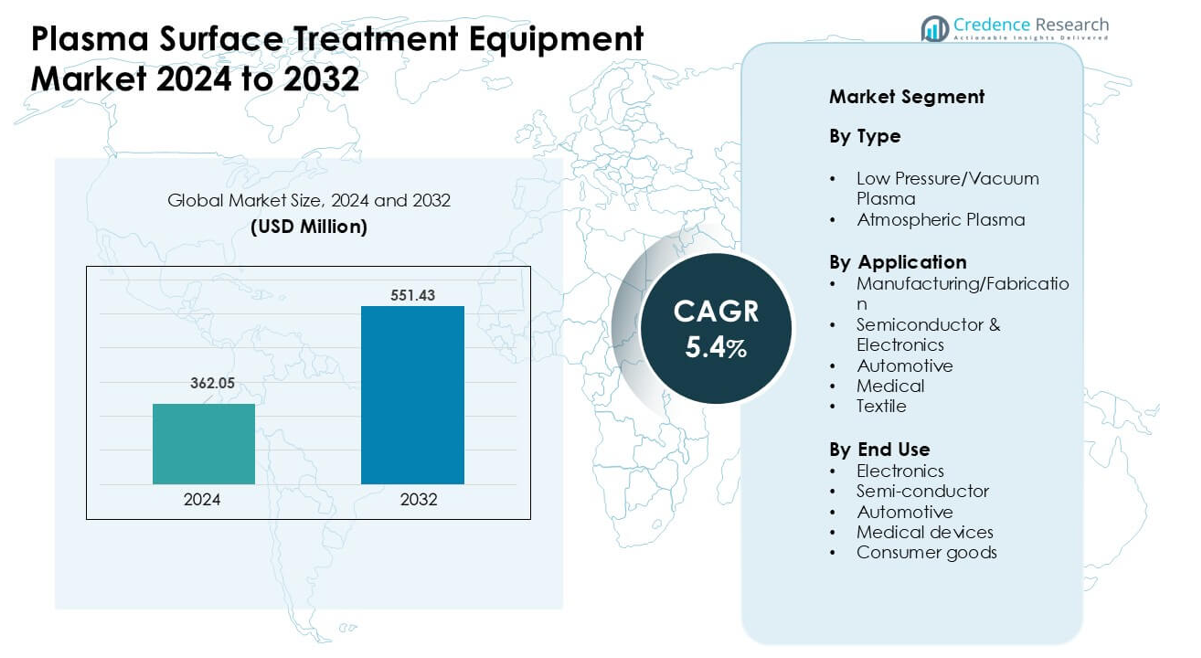
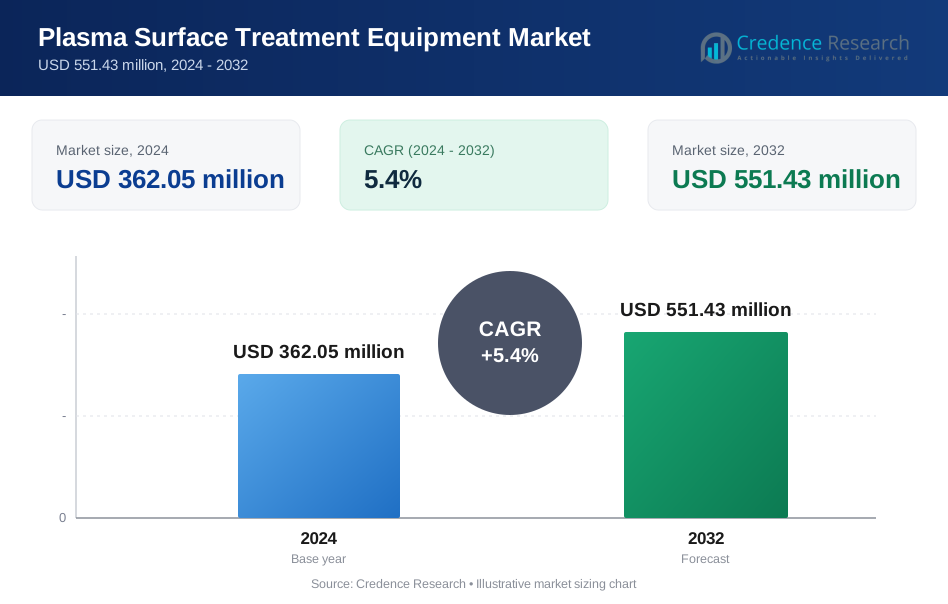
Plasma Surface Treatment Equipment Market was valued at USD 362.05 million in 2024 and is anticipated to reach USD 551.43 million by 2032, growing at a CAGR of 5.4% during the forecast period.
| REPORT ATTRIBUTE | DETAILS |
|---|---|
| Historical Period | 2020-2023 |
| Base Year | 2024 |
| Forecast Period | 2025-2032 |
| Plasma Surface Treatment Equipment Market Size 2024 | USD 362.05 million |
| Plasma Surface Treatment Equipment Market, CAGR | 5.4% |
| Plasma Surface Treatment Equipment Market Size 2032 | USD 551.43 million |
The Plasma Surface Treatment Equipment Market is shaped by major players such as Plasma Etch, AcXys Technologies, Nordson, Plasma Therm, AP&S International, Henniker Plasma, Advanced Energy Industries, Diener Electronic, MKS Instruments, and Glow Research. These companies compete through advanced vacuum and atmospheric plasma systems that improve adhesion, cleanliness, and coating performance across semiconductor, automotive, electronics, and medical device production. Asia Pacific leads the global market with about 38% share, driven by strong semiconductor fabrication, high electronics output, and rapid investment in automated manufacturing lines.
Market Insights:
- The Plasma Surface Treatment Equipment Market reached about USD 05 million in 2024 and is projected to grow at a steady CAGR of 5.4% through 2032.
- Strong demand from semiconductor and electronics production drives adoption, as low pressure/vacuum plasma holds the largest share due to high precision and stable surface activation.
- Atmospheric plasma gains traction as factories shift toward faster, inline processes and energy-efficient treatment for packaging, automotive interiors, and consumer goods.
- Competition includes Plasma Etch, AcXys Technologies, Nordson, Plasma Therm, AP&S International, Henniker Plasma, Advanced Energy Industries, Diener Electronic, MKS Instruments, and Glow Research, each expanding automation and service capabilities.
- Asia Pacific leads with about 38% share, followed by North America at 34% and Europe at 28%, while semiconductor & electronics remains the top application segment with nearly 42% share.
Market Segmentation Analysis:
By Type
Low pressure/vacuum plasma led this segment in 2024 with about 57% share. Many factories used this method due to strong control over ion density, cleaner surface activation, and support for sensitive materials like polymers and micro-components. Demand rose in electronics and medical lines where uniform treatment mattered for bonding and coating steps. Atmospheric plasma grew at a steady rate due to faster processing on large surfaces. Strong focus on energy-efficient systems and higher adhesion performance kept low pressure/vacuum plasma in the dominant position across global plants.
- For instance, PLASMA TREAT GmbH via its low‑pressure plasma cleaning equipment supports fine cleaning and surface activation for polymer and elastomer parts, facilitating adhesion and coating preparation even for oxidation-sensitive substrates.
By Application
Semiconductor & electronics held the leading share in 2024 with nearly 42%. Chip makers relied on plasma systems for precise cleaning, etching, and surface activation before packaging and lithography steps. Strong growth in advanced nodes and rising demand for flexible displays pushed wider use of plasma tools. Manufacturing and fabrication units also adopted these systems for better coating durability. Automotive and medical sectors used plasma for improved adhesion and bio-compatibility. Strong expansion in consumer devices supported continued dominance of semiconductor & electronics.
- For instance, Tokyo Electron Ltd. (TEL) uses its cold‑plasma TACTRAS™ platform to deliver up to 25% improvement in carrier transport properties in advanced FinFET semiconductor structures through optimized plasma surface modification.
By End Use
Electronics dominated the end-use segment in 2024 with about 45% share. Device makers used plasma treatment to improve bonding strength, reduce contamination, and prepare components for coating and encapsulation. Strong demand for smartphones, wearables, and IoT hardware pushed higher adoption of plasma units. Semiconductor plants grew due to advanced wafer processing needs, while automotive and medical device makers used plasma for safety-critical assemblies. Consumer goods brands adopted plasma to enhance printability and surface quality. Strong electronics output kept this end-use group ahead of others.
Key Growth Drivers:
Rising Demand from Semiconductor and Electronics Production
Growing semiconductor output drives strong adoption of plasma surface treatment equipment. Chip makers use plasma tools to clean, activate, and modify surfaces with high precision, which supports advanced packaging, microfabrication, and lithography steps. Rising demand for smartphones, wearables, and high-density chips increases the need for reliable adhesion and defect-free bonding. Flexible electronics and miniaturized components also require gentler, controllable plasma processes. Expanding investment in fabs across Asia and North America boosts equipment installation. The shift toward sub-10 nm nodes and higher integration levels keeps plasma treatment essential for yield improvement and long-term device performance.
- For instance, Plasmatreat notes that its “Openair‑Plasma®” systems enable inline surface cleaning and activation in semiconductor packaging delivering highly particle‑free process control that reduces interface failures (such as delamination or internal cracking) substantially.
Increasing Use in Automotive Lightweighting and Advanced Materials
Automotive manufacturers rely on plasma treatment to enhance bonding strength on metals, composites, and engineered plastics. Lightweight materials need strong adhesion for coatings, paints, and structural joints, and plasma offers high consistency without chemical waste. The growth of electric vehicles raises the need for precise surface preparation of battery housings, sensors, and interior components. Plasma also supports safer manufacturing by replacing hazardous solvents. Rising adoption of ADAS and connected systems adds more electronic modules that benefit from plasma conditioning. Automakers continue integrating advanced materials, which increases the long-term need for high-performance plasma systems.
- For instance, Plasmatreat’s Openair‑Plasma® technology is used in battery manufacturing for EVs: before cell-to-cell bonding or protective‑coating application on housings, plasma activation cleans and activates metal or plastic housing surfaces enabling reliable adhesive bonding, corrosion protection, and consistent coating adhesion without solvents.
Expanding Application in Medical Devices and Healthcare Manufacturing
Medical device makers use plasma systems to remove contaminants, improve surface energy, and support bio-compatible coatings. Demand grows with rising production of catheters, implants, diagnostic tools, and wearable sensors. Plasma enables sterile, residue-free preparation without harsh chemicals, which supports strict regulatory needs. Growing use of polymer-based devices increases the need for gentle, precise plasma activation. Single-use medical supplies and minimally invasive tools also depend on strong adhesion between components. Healthcare expansion in emerging markets boosts the purchase of surface treatment equipment. The shift toward advanced coating technologies further strengthens demand for plasma solutions.
Key Trend & Opportunity:
Adoption of Atmospheric Plasma for High-Speed Manufacturing
Atmospheric plasma gains momentum as factories seek faster, inline surface treatment options. The technology removes the need for vacuum chambers, which lowers downtime and supports automation lines. Packaging, automotive interiors, and consumer goods benefit from its ability to treat wide surfaces at high speed. Opportunities rise as atmospheric systems become more energy-efficient and cost-effective. Expanding use in 3D printing, flexible substrates, and precision assembly opens new markets. Manufacturers adopt atmospheric plasma to enhance throughput, reduce chemical waste, and meet sustainability goals. This trend widens the addressable market for next-generation plasma platforms.
- For instance, Plasmatreat uses its “Openair‑Plasma®” atmospheric‑plasma systems which operate at standard air pressure and avoid vacuum chambers, allowing direct inline integration into production lines.
Growth of Smart Manufacturing and Industry 4.0 Integration
Industry 4.0 adoption creates new opportunities for automated plasma treatment systems. Factories want equipment that supports real-time process control, remote monitoring, and predictive maintenance. Plasma tools now integrate IoT sensors, advanced software, and AI-based diagnostics to improve consistency and reduce error rates. Electronics and automotive plants benefit from stable process parameters that reduce scrap and enhance yield. As digital twins and cloud analytics expand, plasma systems become part of connected production lines. This enables smarter utilization, lower operating costs, and higher reliability. The trend drives upgrades across both large-scale and mid-sized manufacturing units.
- For instance, Plasmatreat’s Openair‑Plasma® systems are designed for full automation and inline integration, enabling seamless integration into automated assembly or coating lines which helps eliminate manual primer or solvent‑based preparation steps.
Key Challenge:
High Initial Investment and Operating Costs
Many manufacturers hesitate due to the significant cost of advanced plasma systems. Vacuum plasma units require pumps, chambers, and sensitive power modules, which increases setup spending. Maintenance and skilled operator requirements also raise long-term costs. Smaller manufacturers struggle to justify investment without large production volumes. High installation costs slow adoption in emerging markets where budgets are limited. Competitive pressure from lower-cost chemical treatments remains strong, especially in small fabrication units. These financial barriers restrict market expansion despite plasma’s technical benefits.
Limited Awareness and Technical Skill Gaps in Developing Regions
Adoption remains slow in regions where manufacturers lack knowledge about plasma benefits and process requirements. Many factories still rely on traditional surface cleaning or chemical primers due to familiarity and lower upfront cost. Plasma systems need skilled technicians who can manage parameters like gas mix, energy levels, and treatment cycles. Shortage of trained staff leads to improper use, poor results, or underutilization. Limited awareness of environmental gains also affects buying decisions. This challenge is more visible in small and mid-sized plants, which delays full-scale uptake of plasma surface treatment solutions.
Regional Analysis:
North America
North America held about 34% share in 2024, supported by strong semiconductor, aerospace, and medical device production. U.S. chip expansions drove higher adoption of plasma tools for precise cleaning and activation steps. Automakers in the region used plasma to improve bonding performance in lightweight components and EV assemblies. Medical technology firms increased use due to strict regulatory needs for sterile, residue-free surfaces. Ongoing investment in advanced manufacturing, automation, and sustainability boosted market demand. Growing adoption of atmospheric plasma systems in packaging and consumer goods further supported steady growth across the region.
Europe
Europe accounted for nearly 28% share in 2024, driven by strong automotive, aerospace, and electronics production. Germany, France, and the U.K. led equipment adoption due to high-quality standards and wider use of engineered materials. Automakers used plasma to strengthen adhesion on composites and battery components, while medical device firms relied on precise surface modification. Environmental regulations encouraged a shift from chemical primers to plasma-based surface treatment. Growth in flexible electronics and advanced packaging boosted equipment upgrades. Rising focus on green manufacturing and high-energy efficiency kept Europe a key market for plasma surface treatment solutions.
Asia Pacific
Asia Pacific dominated the global market with about 38% share in 2024. China, Japan, South Korea, and Taiwan expanded semiconductor fabrication, which sharply increased demand for vacuum and atmospheric plasma systems. Rising production of electronics, consumer devices, and EV components strengthened market growth. Many manufacturers adopted plasma tools for improved bonding, coating, and contamination control across large-scale plants. Growth in medical devices, textiles, and industrial automation further supported demand. Strong investment in high-speed manufacturing and Industry 4.0 technologies positioned Asia Pacific as the fastest-growing regional market.
Latin America
Latin America captured roughly 6% share in 2024, with growth driven by rising automotive assembly, packaging, and consumer electronics production. Mexico led adoption due to its strong manufacturing base and supply chain links with North America. Plasma systems gained use in coating, labelling, and bonding steps across regional factories. Brazil expanded use in medical supplies and industrial components. High system costs limited rapid penetration, but increasing focus on process efficiency and surface quality supported gradual uptake. Growing investment in electronics and EV supply chains is expected to enhance future regional demand.
Middle East & Africa
Middle East & Africa held close to 4% share in 2024, driven by growing industrial activity in the UAE, Saudi Arabia, and South Africa. Manufacturers used plasma tools to improve coating durability, bonding strength, and material performance in automotive components, electronics, and industrial goods. Expanding healthcare manufacturing supported demand for clean, bio-compatible surface preparation. Limited technical skills and high capital expenditure slowed broader adoption. However, increasing investment in diversification programs, automation, and advanced materials is boosting interest. Rising regional focus on improving product quality continues to support steady market growth.
Market Segmentations:
By Type
- Low Pressure/Vacuum Plasma
- Atmospheric Plasma
By Application
- Manufacturing/Fabrication
- Semiconductor & Electronics
- Automotive
- Medical
- Textile
By End Use
- Electronics
- Semi-conductor
- Automotive
- Medical devices
- Consumer goods
By Geography
- North America
- U.S.
- Canada
- Mexico
- Europe
- Germany
- France
- U.K.
- Italy
- Spain
- Rest of Europe
- Asia Pacific
- China
- Japan
- India
- South Korea
- South-east Asia
- Rest of Asia Pacific
- Latin America
- Brazil
- Argentina
- Rest of Latin America
- Middle East & Africa
- GCC Countries
- South Africa
- Rest of the Middle East and Africa
Competitive Landscape:
The competitive landscape of the Plasma Surface Treatment Equipment Market features key players such as Plasma Etch, AcXys Technologies, Nordson, Plasma Therm, AP&S International, Henniker Plasma, Advanced Energy Industries, Diener Electronic, MKS Instruments, and Glow Research. These companies focus on advanced vacuum and atmospheric plasma systems that support precise cleaning, activation, and surface modification across semiconductor, automotive, electronics, medical device, and packaging applications. Many vendors invest in automation, energy-efficient designs, and IoT-enabled monitoring to improve process control and reduce downtime. Firms also expand their global service networks to support large manufacturing hubs in Asia Pacific, Europe, and North America. Continuous development of high-throughput systems, improved electrode technologies, and modular platforms helps vendors address diverse production needs. Partnerships with semiconductor fabs, EV component makers, and medical device manufacturers strengthen long-term demand. Growing emphasis on sustainability and chemical-free treatment continues to shape competition.
Key Player Analysis:
- Plasma Etch
- AcXys Technologies
- Nordson
- Plasma Therm
- AP&S International
- Henniker Plasma
- Advanced Energy Industries
- Diener Electronic
- MKS Instruments
- Glow Research
Recent Developments:
- In June 2025, Published that Nordson Electronics Solutions developed a panel-level packaging (PLP) solution for Powertech Technology, Inc., noting plasma treatment and dispensing integration to achieve high yields in underfill/packaging steps.
- In March 2025, AcXys Technologies Announced the P-MIX powder-activation equipment (atmospheric plasma) to modify powder surface energy for improved wettability or reduced agglomeration.
- In January 2025, Company leadership (Greg DeLarge, President) highlighted Plasma Etch’s continued show presence and product demos (including the popular Plasma Wand atmospheric system) and noted plans to exhibit at 2025 trade shows (SEMICON West, CamX).
Report Coverage:
The research report offers an in-depth analysis based on Type, Application, End-Use and Geography. It details leading market players, providing an overview of their business, product offerings, investments, revenue streams, and key applications. Additionally, the report includes insights into the competitive environment, SWOT analysis, current market trends, as well as the primary drivers and constraints. Furthermore, it discusses various factors that have driven market expansion in recent years. The report also explores market dynamics, regulatory scenarios, and technological advancements that are shaping the industry. It assesses the impact of external factors and global economic changes on market growth. Lastly, it provides strategic recommendations for new entrants and established companies to navigate the complexities of the market.
Future Outlook:
- Demand will rise as semiconductor production expands and requires more precise surface activation.
- Adoption will grow in EV manufacturing due to higher bonding needs for lightweight components.
- Atmospheric plasma systems will gain wider use in high-speed automated production lines.
- Medical device makers will increase reliance on plasma for sterile and bio-compatible surface preparation.
- IoT-enabled plasma systems will support predictive maintenance and real-time process control.
- Sustainability goals will push factories to replace chemical primers with cleaner plasma methods.
- Flexible electronics and advanced packaging will drive need for gentle, uniform plasma treatment.
- More mid-sized manufacturers will invest as equipment becomes cost-efficient and modular.
- Technological upgrades will boost throughput, energy savings, and treatment consistency.
- Asia Pacific will remain the fastest-growing region due to semiconductor and electronics expansion.
Request a Free Sample
Fill in your details and we'll send you a free sample report.
- Sample data tables & charts
- Research methodology
Need a Custom Version of This Report?
Tailor the scope, geography, or segments to your exact requirements.
- Custom geography or segment scope
- Direct access to our analyst team
Frequently Asked Questions
What is the current market size for Plasma Surface Treatment Equipment Market, and what is its projected size in 2032?
At what Compound Annual Growth Rate is Plasma Surface Treatment Equipment Market projected to grow between 2024 and 2032?
Which Plasma Surface Treatment Equipment Market segment held the largest share in 2024?
What are the primary factors fueling the growth of Plasma Surface Treatment Equipment Market?
Who are the leading companies in Plasma Surface Treatment Equipment Market?
Which region commanded the largest share of Plasma Surface Treatment Equipment Market?
Table of Content
Chapter 1. Report Introduction
- 1.1 Report Description & Purpose
- 1.1.1 Report Title & Market Definition
- 1.1.2 Unique Selling Propositions (USP) & Key Differentiators
- 1.1.3 Value Proposition for Stakeholders
- 1.2 Research Objectives
- 1.2.1 Market Sizing Objectives (Volume & Revenue)
- 1.2.2 Segmentation Objectives
- 1.2.3 Competitive Intelligence Objectives
- 1.2.4 Forecast & Scenario Objectives
- 1.3 Report Scope
- 1.3.1 Plasma Surface Treatment Equipment Scope – Types & Subtypes Covered
- 1.3.2 Geographic Scope – Regions & Countries Covered
- 1.3.3 Historical Period, Base Year & Forecast Period (2024; forecast to 2032)
- 1.3.4 Inclusions & Exclusions
- 1.4 HS Code & Classification Framework
- 1.5 Currency, Units & Pricing Basis
- 1.6 Target Stakeholders
- 1.7 Limitations & Assumptions
Chapter 2. Executive Summary
- 2.1 Global Plasma Surface Treatment Equipment Market Snapshot
- 2.1.1 Market Size – Historical (2024) & Forecast (2024-2032) (2024: USD 362.05 million → 2032: USD 551.43 million)
- 2.1.2 Volume & Revenue – Global Totals
- 2.1.3 Key Market Highlights – Top Five Facts
- 2.2 Plasma Surface Treatment Equipment Market Segmentation Snapshot
- 2.2.1 Market Split by Region – 2024 vs. 2032
- 2.3 Competitive Snapshot
- 2.3.1 Top 10 Players by Revenue Share – 2024
- 2.3.2 Top 10 Players by Volume Share – 2024
- 2.3.3 Recent Strategic Developments (18-Month Summary)
- 2.4 Key Investment Highlights & Strategic Conclusions
Chapter 3. Plasma Surface Treatment Equipment Market Dynamics & Industry Analysis
- 3.1 Market Overview & Context
- 3.1.1 Plasma Surface Treatment Equipment Market Position in the Broader Automotive Value Chain
- 3.1.2 OEM vs. Replacement Market Dynamics
- 3.1.3 Market Maturity & Development Stage by Region
- 3.2 Plasma Surface Treatment Equipment Market Drivers
- 3.3 Plasma Surface Treatment Equipment Market Restraints & Challenges
- 3.4 Plasma Surface Treatment Equipment Market Opportunities
- 3.5 Porter's Five Forces Analysis
- 3.5.1 Threat of New Entrants
- 3.5.2 Bargaining Power of Suppliers
- 3.5.3 Bargaining Power of Buyers
- 3.5.4 Threat of Substitutes
- 3.5.5 Competitive Rivalry – Intensity Assessment
- 3.6 Plasma Surface Treatment Equipment Value Chain Analysis
- 3.6.1 Upstream – Raw Material/Input Suppliers
- 3.6.1.1 Raw Material/Input 1
- 3.6.1.2 Raw Material/Input 2
- 3.6.1.3 Raw Material/Input 3
- 3.6.2 Midstream – Production/Manufacturing/Service Delivery
- 3.6.2.1 Production/Process Overview
- 3.6.2.2 Key Facility Locations & Capacity by Manufacturer
- 3.6.3 Downstream – Distribution & End Consumer
- 3.6.3.1 Primary Channel – B2B/OEM
- 3.6.3.2 Secondary Channels – Dealer, Retail, Online, Direct
- 3.6.4 Value Chain Profitability Analysis
- 3.6.1 Upstream – Raw Material/Input Suppliers
- 3.7 PESTEL Analysis
- 3.7.1 Political Factors
- 3.7.2 Economic Factors
- 3.7.3 Social Factors
- 3.7.4 Technological Factors
- 3.7.5 Environmental Factors
- 3.7.6 Legal Factors
- 3.8 Plasma Surface Treatment Equipment Supply Chain Analysis
- 3.8.1 Raw Material/Input Supply Risk Assessment
- 3.8.2 Manufacturing Concentration Risk (Geographic Exposure)
- 3.8.3 Trade Disruption Impact Analysis
- 3.9 Regulatory & Policy Landscape
Note: The regulatory and policy landscape section covers regulations based on their applicability to the market, Plasma Surface Treatment Equipment category, geography, and scope of the study. Only regulatory frameworks with a material impact on operations, compliance, trade, sustainability, or market access are analyzed in detail.
Chapter 4. Key Investment Pockets & Opportunity Analysis
- 4.1 Plasma Surface Treatment Equipment Market Attractiveness Analysis
- 4.1.1 By Region – Investment Attractiveness Matrix (Volume × CAGR)
- 4.2 Absolute Revenue Growth Opportunity
- 4.2.1 By Region – Absolute USD Growth Through 2032
- 4.3 Incremental Volume Opportunity
- 4.3.1 By Region – Incremental Volume Through 2032
- 4.3.2 Segment – Incremental Volume
- 4.4 Emerging Submarket Opportunity Deep Dive (Subject to Applicability)
- 4.5 Emerging Market Opportunity Scorecards
- 4.5.1 United States
- 4.5.2 Europe
- 4.5.3 Asia
- 4.5.4 Middle East & Africa
Note: Emerging Market Opportunity Scorecards will be included based on relevance and strategic importance. Regions listed are indicative and may vary depending on data availability and market dynamics.
Chapter 5. Plasma Surface Treatment Equipment Import-Export Analysis & Trade Flows
- 5.1 Global Trade Overview
- 5.1.1 Global Export Value by Country (2024)
- 5.1.2 Global Export Volume by Country (2024)
- 5.1.3 Global Import Value by Country (2024)
- 5.1.4 Global Import Volume by Country (2024)
- 5.1.5 Net Trade Balance by Country (2024)
- 5.2 Export Analysis – Segment
- 5.2.1 Type 1 (HS Code)
- 5.2.2 Type 2 (HS Code)
- 5.2.3 Type 3 (HS Code)
- 5.2.4 Type 4 (HS Code)
- 5.2.5 Type 5 (HS Code)
- 5.3 Import Analysis – Segment
- 5.3.1 Type 1 (HS Code)
- 5.3.2 Type 2 (HS Code)
- 5.3.3 Type 3 (HS Code)
- 5.3.4 Type 4 (HS Code)
- 5.3.5 Type 5 (HS Code)
- 5.4 Average Unit Trade Prices
- 5.4.1 Average Export Price – Segment & Country
- 5.4.2 Average Import Price – Segment & Source Country
- 5.4.3 Price Trends (2024)
- 5.5 Key Trade Route Analysis
- 5.5.1 Trade Route 1
- 5.5.2 Trade Route 2
- 5.5.3 Trade Route 3
- 5.5.4 Trade Route 4
- 5.5.5 Trade Route 5
- 5.6 Trade Policy Impact Assessment
- 5.6.1 US Anti-Dumping & Section 301 Tariffs
- 5.6.2 EU Customs Union Impact
- 5.6.3 Major Free Trade Agreements
- 5.6.4 USMCA Rules of Origin
Note: Trade policy analysis will be included only where relevant to the Plasma Surface Treatment Equipment market.
Chapter 6. Competitive Landscape & Company Benchmarking
- 6.1 Plasma Surface Treatment Equipment Market Concentration & Structure
- 6.1.1 Herfindahl-Hirschman Index (HHI) – vs. 2024
- 6.1.2 Tier 1, Tier 2 & Tier 3 Market Structure
- 6.1.3 Global, Regional & Local Player Dynamics
- 6.2 Plasma Surface Treatment Equipment Market Share Analysis – 2024
- 6.2.1 Global Revenue Share by Company
- 6.2.2 Global Volume Share by Company
- 6.2.3 Regional Revenue Share
- 6.2.4 Market Share Evolution ( vs. 2024)
- 6.2.5 OEM Segment Share by Company
- 6.2.6 Replacement Segment Share by Company
- 6.3 Production/Delivery Capacity & Facility Analysis
- 6.3.1 Global Installed Capacity
- 6.3.2 Capacity Utilization Rates
- 6.3.3 Production/Output Volume
- 6.3.4 Facility Locations & Capacity Map
- 6.3.5 Planned Capacity Additions
- 6.4 Plasma Surface Treatment Equipment Competitive Benchmarking Matrix
- 6.4.1 Revenue, Volume, CAGR & Profitability Comparison
- 6.4.2 Channel Revenue Mix
- 6.4.3 Geographic Revenue Exposure
- 6.4.4 R&D Intensity
- 6.4.5 Sustainability Maturity
- 6.5 Strategic Developments in Plasma Surface Treatment Equipment (Last 24 Months)
- 6.5.1 Mergers, Acquisitions & Divestments
- 6.5.2 New Plasma Surface Treatment Equipment Launches
- 6.5.3 Facility Expansions
- 6.5.4 Strategic Alliances, Joint Ventures & Partnerships
- 6.5.5 Distribution Expansion & Market Entry
- 6.5.6 Sustainability & ESG Initiatives
- 6.6 Competitive Strategy Mapping
- 6.6.1 Leader, Challenger, Follower & Niche Classification
- 6.6.2 Pricing Strategy Comparison
- 6.6.3 Channel Strategy Matrix
Note: Strategic developments are included based on their materiality and the availability of reliable information.
Chapter 7. Global Plasma Surface Treatment Equipment Market – By Distribution Channel
- 7.1 Segment Overview
- 7.1.1 Volume & Revenue Split by Channel (2024 & 2032)
- 7.1.2 Channel Mix Evolution (2024-2032)
Chapter 8. Regional Market Analysis – Global Overview
- 8.1 Global Regional Overview
- 8.1.1 Regional Volume Share
- 8.1.2 Regional Revenue Share
- 8.1.3 Regional Volume by Region
- 8.1.4 Regional Revenue by Region
- 8.1.5 Regional Forecast Through 2032
- 8.2 Cross-Regional Segment Analysis
- 8.2.1 By Distribution Channel
- 8.2.2 By Brand/Price Tier
Chapter 9. North America Plasma Surface Treatment Equipment Market
- 9.1 United States
- 9.2 Canada
- 9.3 Mexico
Chapter 10. Europe Plasma Surface Treatment Equipment Market
- 10.1 Germany
- 10.2 France
- 10.3 Italy
- 10.4 United Kingdom
- 10.5 Spain
- 10.6 Poland
- 10.7 Russia
- 10.8 Netherlands
- 10.9 Belgium
- 10.10 Sweden
- 10.11 Denmark
- 10.12 Norway
- 10.13 Rest of Europe
Chapter 11. Asia Pacific Plasma Surface Treatment Equipment Market
- 11.1 China
- 11.2 India
- 11.3 Japan
- 11.4 South Korea
- 11.5 Thailand
- 11.6 Indonesia
- 11.7 Vietnam
- 11.8 Malaysia
- 11.9 Australia
- 11.10 Rest of Asia Pacific
Chapter 12. Latin America Plasma Surface Treatment Equipment Market
- 12.1 Brazil
- 12.2 Argentina
- 12.3 Colombia
- 12.4 Chile
- 12.5 Rest of Latin America
Chapter 13. Middle East Plasma Surface Treatment Equipment Market
- 13.1 Saudi Arabia
- 13.2 United Arab Emirates
- 13.3 Turkey
- 13.4 Israel
- 13.5 Iran
- 13.6 Rest of the Middle East
Chapter 14. Africa Plasma Surface Treatment Equipment Market
- 14.1 South Africa
- 14.2 Egypt
- 14.3 Nigeria
- 14.4 Morocco
- 14.5 Rest of Africa
Chapter 15. Plasma Surface Treatment Equipment Company Profiles
- 15.1 [Company 01]
- 15.1.1 Company Overview
- 15.1.2 Key Management Personnel
- 15.1.3 Products & Services Portfolio
- 15.1.4 Financial Performance
- 15.1.5 Key Market Focus & Geographic Presence
- 15.1.6 Recent Developments & Strategic Initiatives
Note: The company profile list is preliminary and may change based on research findings, market developments, data availability, and client requirements.
Chapter 16. Appendices
- Appendix A – List of Abbreviations & Acronyms
- Appendix B – Industry Classification Code Reference – Full Series
- Appendix C – Production & Capacity Data Tables
- Appendix D – End-Use & Demand Base Tables
- Appendix E – Consumption & Replacement Rate Assumptions
- Appendix F – ASP Reference Tables
- Appendix G – Manufacturing & Facility Database
- Appendix H – Import-Export Data Tables
- Appendix I – Regulatory Summary Tables
- Appendix J – Primary Research Participant List (Anonymized)
- Appendix K – Primary Research Questionnaire Framework
- Appendix L – Data Sources & Bibliography
- Appendix M – Market Size Divergence & Source Comparison
Chapter 17. Research Methodology
- 17.1 Research Framework & Philosophy
- 17.2 Secondary Research – Sources, Hierarchy & Data Extraction
- 17.3 Data Modeling – Bottom-Up & Top-Down Market Sizing
- 17.4 Primary Research – Stakeholder Framework, LOI & Sample Sizes
- 17.5 Forecast Methodology – Regression, Scenario & Sensitivity Analysis
- 17.6 Quality Control – Four-Layer Validation Framework
- 17.7 Limitations & Standard Assumptions
- 17.8 Disclaimer
