
Market Overview
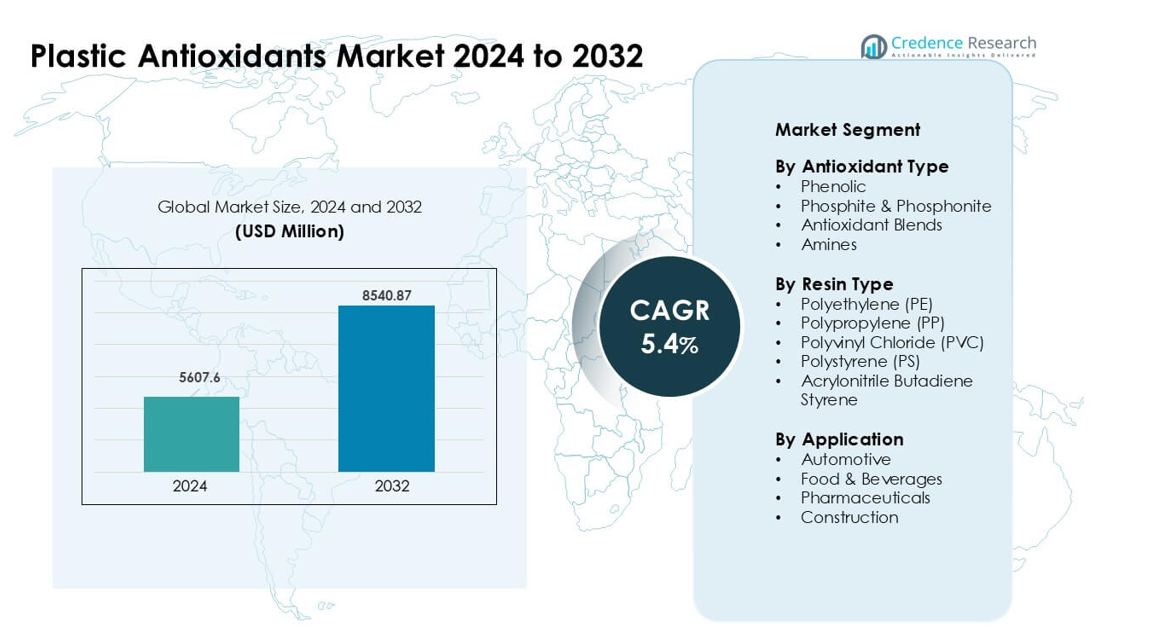
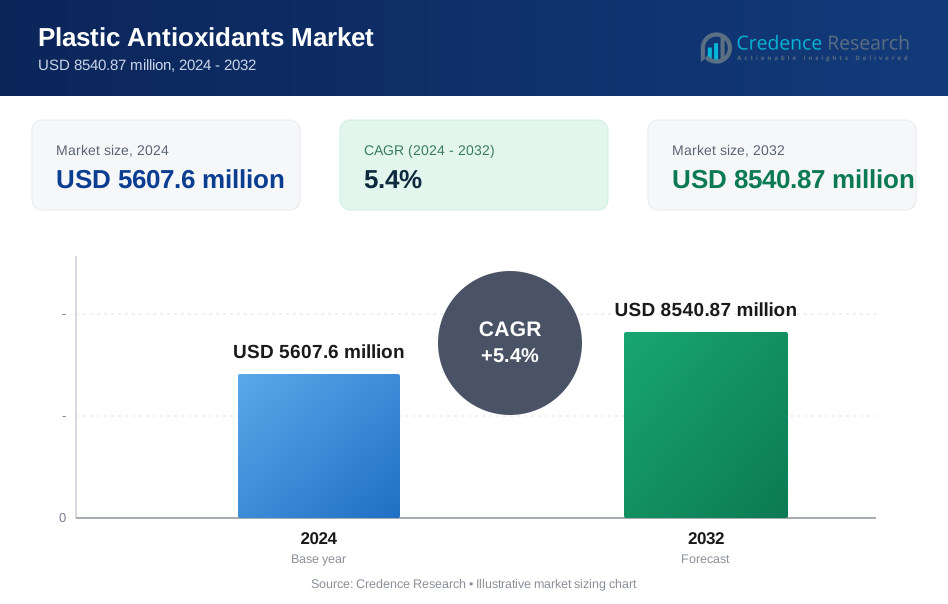
Plastic Antioxidants Market was valued at USD 5607.6 million in 2024 and is anticipated to reach USD 8540.87 million by 2032, growing at a CAGR of 5.4% during the forecast period.
| REPORT ATTRIBUTE | DETAILS |
|---|---|
| Historical Period | 2020-2023 |
| Base Year | 2024 |
| Forecast Period | 2025-2032 |
| Plastic Antioxidants Market Size 2024 | USD 5607.6 million |
| Plastic Antioxidants Market, CAGR | 5.4% |
| Plastic Antioxidants Market Size 2032 | USD 8540.87 million |
The Plastic Antioxidants Market is shaped by major players such as Lanxess AG, Astra Polymers, Avient Corporation, Clariant AG, Tosaf Compounds Ltd., 3V Sigma USA, SONGWON, Dover Chemical Corporation, Syensqo, and BASF SE. These companies compete through advanced stabilizer technologies that improve polymer durability, heat resistance, and processing performance across packaging, automotive, construction, and electronics industries. Asia Pacific remained the leading region in 2024 with about 38% share, supported by strong polymer manufacturing capacity, rapid industrial expansion, and high consumption of PE, PP, PVC, and ABS products.
Market Insights
- The Plastic Antioxidants Market reached USD 6 million in 2024 and is projected to hit USD 8540.87 million by 2032, growing at a CAGR of 5.4%.
- Demand grew due to rising consumption of PP and PE, with PP holding about 38% share as manufacturers sought stronger thermal and oxidative stability in packaging and automotive parts.
- Blended antioxidants gained momentum as converters needed balanced performance for high-temperature processing, long-life films, and recyclable polymers.
- Competition intensified among major players offering advanced phenolic and phosphite systems, while producers focused on low-toxicity and high-purity formulations to meet evolving regulations.
- Asia Pacific led the global market with nearly 38% share, supported by strong polymer production in China, India, and South Korea, while North America and Europe followed due to high adoption in packaging, automotive, and construction applications.
Market Segmentation Analysis:
By Antioxidant Type
Phenolic antioxidants held the dominant position in 2024 with nearly 42% share. These stabilizers offered strong resistance against thermal oxidation during processing, which kept usage high across packaging and automotive parts. Their broad compatibility with major polymers also supported wide adoption in extrusion and molding lines. Phosphite and phosphonite grades grew due to stronger demand for secondary stabilizers in high-temperature applications. Antioxidant blends gained traction as converters sought balanced performance for long shelf-life films. Amines saw steady use in industrial products that needed strong heat stability under harsh operating conditions.
- For instance, the commercial phenolic antioxidant Irganox 1010 (molecular weight 1178 g/mol) is widely used in PP and PE to provide long-term thermal and oxidative stability.
By Resin Type
Polypropylene (PP) led this segment in 2024 with about 38% share. PP required antioxidants to prevent degradation during molding, which supported consistent usage in packaging, consumer goods, and automotive components. Polyethylene (PE) followed due to strong consumption in films exposed to heat and light. PVC adoption rose across construction and medical items that relied on stabilizers to maintain clarity and strength. Polystyrene saw moderate demand in rigid packaging. ABS used antioxidants to enhance durability in electronics and appliance housings, which kept demand steady across manufacturing hubs.
- For instance, antioxidant additive packages (phenolic + secondary phosphite) developed for PE films such as those by specialist additive suppliers help maintain melt flow index and prevent gel formation during film extrusion and subsequent processing, thus supporting stable PE film production.
By Application
Automotive remained the leading application in 2024 with roughly 34% share. Vehicle makers used antioxidants to protect PP, ABS, and PE parts from heat and oxidation under long operating cycles. Food and beverage packaging expanded due to higher demand for long-life films and rigid containers. Pharmaceuticals adopted antioxidants for medical packaging that required high purity and stability. Construction applications grew as PVC pipes, profiles, and insulation materials needed improved weather and heat resistance. Rising polymer use across infrastructure and mobility supported strong antioxidant consumption across all end-use sectors.
Key Growth Drivers
Rising Polymer Consumption Across Packaging and Automotive Industries
Growing use of PE, PP, PVC, and ABS in large-scale packaging and automotive manufacturing drives steady demand for plastic antioxidants. Packagers rely on antioxidants to prevent thermal and oxidative degradation during extrusion, molding, and extended storage. Automotive suppliers use stabilizers to keep interior trims, under-the-hood parts, and lightweight composites durable under heat and vibration. Rising global production of flexible films, rigid containers, and engineered polymer parts strengthens the need for long-lasting stabilization systems. The shift toward lightweight vehicles further increases polymer content, which boosts antioxidant consumption across OEM and aftermarket applications.
- For instance, as reported in a 2024 review, some modern cars use up to roughly 426 pounds (≈ 193 kg) of plastics and composites underscoring how heavily polymers feature in automotive components such as bumpers, instrument panels, battery housings, and interior trims.
Increasing Focus on Material Durability and Performance
Industries seek longer product lifecycles, which increases interest in stabilizers that provide strong resistance to heat, oxygen, and UV exposure. Manufacturers use antioxidants to improve mechanical strength, color stability, and processing efficiency of polymers, especially in high-temperature and high-stress environments. Demand rises from construction, medical, and consumer goods sectors where materials must retain integrity over years of use. Companies also adopt advanced blends that combine phenolic and phosphite chemistries for improved performance. This focus on durability supports adoption in electrical housings, insulation materials, appliance components, and long-life packaging formats.
- For instance, chemical suppliers such as Vinati Organics highlight how their phosphite-based secondary antioxidants and phenolic primary antioxidants deliver stable melt flow and prevent discoloration in polymers like PE, PP, PVC, and PU under high-temperature processing thereby extending the usable life of products used in construction, automotive, and packaging applications.
Expansion of High-Performance and Specialty Polymers
Growth in electronics, medical devices, and advanced manufacturing fuels consumption of specialty polymers that require high-grade antioxidants. These materials need protection during complex processing steps such as compounding, injection molding, and high-temperature fabrication. Demand rises for stabilizers that offer low volatility, high purity, and strong thermal resistance. Semiconductor packaging, EV components, and high-precision engineering goods increasingly rely on antioxidants to retain dimensional accuracy and long-term performance. Expanding investment in specialty resins across Asia and North America boosts the adoption of next-generation antioxidant formulations tailored for niche and high-stress applications.
Key Trend & Opportunity
Shift Toward Sustainable and Low-Toxicity Antioxidant Solutions
Manufacturers move toward eco-friendly stabilizers as regulations tighten around toxic additives and VOC emissions. This shift opens opportunities for bio-based phenolics, non-ylated antioxidants, and safer phosphites that meet global compliance. Increasing demand for recyclable packaging strengthens the need for stabilizers that do not hinder polymer recovery. Companies invest in cleaner formulations that extend material life while supporting circular economy goals. Growing adoption of green packaging solutions in food, beverage, and personal care products drives innovation in low-toxicity, high-purity antioxidant systems suited for sensitive applications and regulated environments.
- For instance, Researchers are actively developing and incorporating natural antioxidants (e.g., from green tea, rosemary, olive leaf extracts) into bio-based polymer matrices (e.g., PLA, starch, cellulose) to create active and sustainable packaging.
Rising Adoption of Antioxidant Blends for Customized Performance
Converters increasingly use antioxidant blends to achieve balanced stability during processing and long-term use. These blends offer synergistic effects by combining primary phenolic stabilizers with secondary phosphites or phosphonites. Demand grows for tailored solutions that optimize melt flow, reduce discoloration, and improve resistance to thermal aging. Opportunities rise in films, pipes, automotive interiors, and electrical components where single-type antioxidants cannot meet complex performance needs. The trend also supports expanded R&D investments aimed at designing application-specific formulations that improve reliability across multiple resin systems.
- For instance, some polymer-additive suppliers now market blend formulations that combine hindered-phenol antioxidants with phosphite secondary stabilizers to deliver both processing stability (during high-temperature extrusion) and long-term thermal/oxidative resistance enabling plastics to withstand extended use in demanding conditions without significant discoloration or mechanical degradation.
Key Challenge
Volatile Raw Material Costs and Supply Constraints
Antioxidant production depends on petrochemical derivatives that face price fluctuations due to crude oil volatility, logistics disruptions, and geopolitical risks. These cost swings strain margins for additive suppliers and polymer processors, especially in price-sensitive sectors like packaging. Supply chain disruptions also affect availability of key intermediates used in phenolic and phosphite antioxidants. Manufacturers often struggle to balance cost-effective sourcing with performance requirements. Small and mid-size processors face greater pressure as they cannot easily absorb rising input costs, which limits broader adoption of premium antioxidant solutions.
Regulatory Pressure on Hazardous Additives and Environmental Impact
Global regulations increasingly restrict antioxidant chemistries linked to toxicity, migration, or environmental harm. The EU, U.S., and several Asian countries enforce strict limits on additives used in food-contact materials and medical packaging. Compliance challenges force manufacturers to reformulate products and invest in safer alternatives, which raises development costs. Some widely used stabilizers face scrutiny regarding microplastic generation, health risks, and end-of-life disposal concerns. These regulatory pressures slow market expansion and require continuous innovation to maintain performance while meeting evolving safety standards and sustainability expectations.
Regional Analysis
North America
North America held about 32% share in 2024, driven by strong demand from packaging, automotive, and construction industries. The region used high-performance phenolic and phosphite antioxidants to improve polymer stability in films, bottles, and molded components. Growth remained supported by advanced recycling programs that increased the need for stabilizers during reprocessing. The U.S. led consumption due to large-scale manufacturing of PE, PP, and ABS products. Rising use of lightweight automotive materials and strict quality standards in food packaging further boosted antioxidant adoption across major production hubs.
Europe
Europe accounted for nearly 27% share in 2024, supported by strict regulations that encouraged the use of high-purity, low-toxicity antioxidant systems. Demand grew from automotive suppliers, flexible packaging producers, and construction material manufacturers seeking longer product life and improved thermal resistance. Germany, Italy, and France remained key contributors due to strong polymer processing capacities. Sustainability targets accelerated the shift toward recyclable plastics, which increased the use of stabilizers compatible with circular economy goals. Rising production of specialty polymers also strengthened antioxidant adoption across regional industries.
Asia Pacific
Asia Pacific dominated the market in 2024 with roughly 38% share, supported by large-scale polymer production in China, India, Japan, and South Korea. Rapid expansion in packaging, automotive, electronics, and construction industries increased demand for antioxidants across multiple resin systems. Manufacturers used phenolic and phosphite blends to enhance heat resistance and durability in high-volume processing environments. Growth in e-commerce and food packaging boosted consumption of PE and PP films, while rising automotive output strengthened ABS and PP stabilization needs. Strong investments in advanced manufacturing further accelerated regional growth.
Latin America
Latin America held close to 6% share in 2024, with demand concentrated in Brazil and Mexico. Packaging producers used antioxidants to improve film clarity and maintain strength in high-temperature conditions. Automotive and appliance manufacturers increased use of stabilized PP and ABS components to enhance durability. Construction expansion supported PVC and PE consumption that required oxidation control. Economic recovery and rising urban infrastructure projects boosted polymer demand, while the region’s growing food and beverage sector strengthened adoption of stabilized plastics used in containers and logistics packaging.
Middle East & Africa
The Middle East & Africa region captured around 5% share in 2024, driven by expanding polymer production in Saudi Arabia, the UAE, and South Africa. Local converters relied on antioxidants to improve stability during high-temperature extrusion and molding. Packaging and construction sectors remained major contributors as PE and PVC consumption increased. Infrastructure development and industrial growth supported demand for durable polymer components. Rising investment in petrochemical facilities improved access to raw materials, which boosted antioxidant integration into regional manufacturing. Growth continued as more industries adopted polymer-based solutions requiring long-term oxidative protection.
Market Segmentations:
By Antioxidant Type
- Phenolic
- Phosphite & Phosphonite
- Antioxidant Blends
- Amines
By Resin Type
- Polyethylene (PE)
- Polypropylene (PP)
- Polyvinyl Chloride (PVC)
- Polystyrene (PS)
- Acrylonitrile Butadiene Styrene
By Application
- Automotive
- Food & Beverages
- Pharmaceuticals
- Construction
By Geography
- North America
- U.S.
- Canada
- Mexico
- Europe
- Germany
- France
- U.K.
- Italy
- Spain
- Rest of Europe
- Asia Pacific
- China
- Japan
- India
- South Korea
- South-east Asia
- Rest of Asia Pacific
- Latin America
- Brazil
- Argentina
- Rest of Latin America
- Middle East & Africa
- GCC Countries
- South Africa
- Rest of the Middle East and Africa
Competitive Landscape
The Plastic Antioxidants Market features strong competition among leading companies such as Lanxess AG, Astra Polymers, Avient Corporation, Clariant AG, Tosaf Compounds Ltd., 3V Sigma USA, SONGWON, Dover Chemical Corporation, Syensqo, and BASF SE. These players focus on advanced phenolic, phosphite, and blended antioxidant systems that enhance polymer durability during processing and long-term use. Global manufacturers invest in R&D to create high-purity, low-toxicity stabilizers that meet rising regulatory and sustainability requirements. Many companies expand through strategic partnerships with polymer processors to supply tailored solutions for packaging, automotive, electronics, and construction. Regional production facilities help reduce lead times and support localized demand. With growing interest in recyclable and high-performance polymers, competitors continue to innovate stabilization technologies that improve heat resistance, color retention, and reprocessing efficiency.
Key Player Analysis
- Lanxess AG
- Astra Polymers
- Avient Corporation
- Clariant AG
- Tosaf Compounds Ltd.
- 3V Sigma USA
- SONGWON
- Dover Chemical Corporation
- Syensqo
- BASF SE
Recent Developments
- In September 2025, Dover Chemical Corporation introduced DoverCycle™, extending the Doverphos® LGP-12 liquid phosphite antioxidant platform to improve stabilization and processing of high-PIR/PCR recycled polyolefins, especially films and molded parts.
- In August 2025, BASF SE expanded its VALERAS® plastic additives platform for K 2025, adding Tinuvin® NOR® 112 and a new HALS concept to enhance greenhouse film resistance to UV, heat and agrochemicals in agricultural plastics.
- In October 2024, Syensqo showcased its CYASORB® and CYASORB CYNERGY SOLUTIONS® polymer stabilizers at Fakuma 2024, emphasizing benzotriazole-free UV stabilizer systems that protect plastics from degradation while complying with upcoming regulatory requirements
Report Coverage
The research report offers an in-depth analysis based on Antioxidant Type, Resin Type, Application and Geography. It details leading market players, providing an overview of their business, product offerings, investments, revenue streams, and key applications. Additionally, the report includes insights into the competitive environment, SWOT analysis, current market trends, as well as the primary drivers and constraints. Furthermore, it discusses various factors that have driven market expansion in recent years. The report also explores market dynamics, regulatory scenarios, and technological advancements that are shaping the industry. It assesses the impact of external factors and global economic changes on market growth. Lastly, it provides strategic recommendations for new entrants and established companies to navigate the complexities of the market.
Future Outlook
- Demand will rise as packaging and automotive sectors expand their polymer usage.
- Antioxidant blends will gain wider adoption for balanced thermal and oxidative stability.
- Bio-based and low-toxicity antioxidants will grow due to stricter global regulations.
- Recycling processes will drive higher use of stabilizers to enhance recycled polymer quality.
- Advanced antioxidants will support growth in electronics, EV components, and specialty polymers.
- Manufacturers will invest in high-purity formulations for food, medical, and sensitive applications.
- Asia Pacific will strengthen its lead as polymer production and processing capacities grow.
- Automation in compounding and molding will increase demand for efficient, heat-stable additives.
- Companies will expand regional production to reduce supply risks and improve cost efficiency.
- R&D activity will accelerate as industries seek long-life, high-performance materials across applications.
Request a Free Sample
Fill in your details and we'll send you a free sample report.
- Sample data tables & charts
- Research methodology
Need a Custom Version of This Report?
Tailor the scope, geography, or segments to your exact requirements.
- Custom geography or segment scope
- Direct access to our analyst team
Frequently Asked Questions
What is the current market size for Plastic Antioxidants Market, and what is its projected size in 2032?
At what Compound Annual Growth Rate is Plastic Antioxidants Market projected to grow between 2024 and 2032?
Which Plastic Antioxidants Market segment held the largest share in 2024?
What are the primary factors fueling the growth of Plastic Antioxidants Market?
Who are the leading companies in Plastic Antioxidants Market?
Table of Content
Chapter 1. Report Introduction
- 1.1 Report Description & Purpose
- 1.1.1 Report Title & Market Definition
- 1.1.2 Unique Selling Propositions (USP) & Key Differentiators
- 1.1.3 Value Proposition for Stakeholders
- 1.2 Research Objectives
- 1.2.1 Market Sizing Objectives (Volume & Revenue)
- 1.2.2 Segmentation Objectives
- 1.2.3 Competitive Intelligence Objectives
- 1.2.4 Forecast & Scenario Objectives
- 1.3 Report Scope
- 1.3.1 Plastic Antioxidants Scope – Types & Subtypes Covered
- 1.3.2 Geographic Scope – Regions & Countries Covered
- 1.3.3 Historical Period, Base Year & Forecast Period (2024; forecast to 2032)
- 1.3.4 Inclusions & Exclusions
- 1.4 HS Code & Classification Framework
- 1.5 Currency, Units & Pricing Basis
- 1.6 Target Stakeholders
- 1.7 Limitations & Assumptions
Chapter 2. Executive Summary
- 2.1 Global Plastic Antioxidants Market Snapshot
- 2.1.1 Market Size – Historical (2024) & Forecast (2024-2032) (2024: USD 5607.6 million → 2032: USD 8540.87 million)
- 2.1.2 Volume & Revenue – Global Totals
- 2.1.3 Key Market Highlights – Top Five Facts
- 2.2 Plastic Antioxidants Market Segmentation Snapshot
- 2.2.1 Market Split by Region – 2024 vs. 2032
- 2.3 Competitive Snapshot
- 2.3.1 Top 10 Players by Revenue Share – 2024
- 2.3.2 Top 10 Players by Volume Share – 2024
- 2.3.3 Recent Strategic Developments (18-Month Summary)
- 2.4 Key Investment Highlights & Strategic Conclusions
Chapter 3. Plastic Antioxidants Market Dynamics & Industry Analysis
- 3.1 Market Overview & Context
- 3.1.1 Plastic Antioxidants Market Position in the Broader Automotive Value Chain
- 3.1.2 OEM vs. Replacement Market Dynamics
- 3.1.3 Market Maturity & Development Stage by Region
- 3.2 Plastic Antioxidants Market Drivers
- 3.3 Plastic Antioxidants Market Restraints & Challenges
- 3.4 Plastic Antioxidants Market Opportunities
- 3.5 Porter's Five Forces Analysis
- 3.5.1 Threat of New Entrants
- 3.5.2 Bargaining Power of Suppliers
- 3.5.3 Bargaining Power of Buyers
- 3.5.4 Threat of Substitutes
- 3.5.5 Competitive Rivalry – Intensity Assessment
- 3.6 Plastic Antioxidants Value Chain Analysis
- 3.6.1 Upstream – Raw Material/Input Suppliers
- 3.6.1.1 Raw Material/Input 1
- 3.6.1.2 Raw Material/Input 2
- 3.6.1.3 Raw Material/Input 3
- 3.6.2 Midstream – Production/Manufacturing/Service Delivery
- 3.6.2.1 Production/Process Overview
- 3.6.2.2 Key Facility Locations & Capacity by Manufacturer
- 3.6.3 Downstream – Distribution & End Consumer
- 3.6.3.1 Primary Channel – B2B/OEM
- 3.6.3.2 Secondary Channels – Dealer, Retail, Online, Direct
- 3.6.4 Value Chain Profitability Analysis
- 3.6.1 Upstream – Raw Material/Input Suppliers
- 3.7 PESTEL Analysis
- 3.7.1 Political Factors
- 3.7.2 Economic Factors
- 3.7.3 Social Factors
- 3.7.4 Technological Factors
- 3.7.5 Environmental Factors
- 3.7.6 Legal Factors
- 3.8 Plastic Antioxidants Supply Chain Analysis
- 3.8.1 Raw Material/Input Supply Risk Assessment
- 3.8.2 Manufacturing Concentration Risk (Geographic Exposure)
- 3.8.3 Trade Disruption Impact Analysis
- 3.9 Regulatory & Policy Landscape
Note: The regulatory and policy landscape section covers regulations based on their applicability to the market, Plastic Antioxidants category, geography, and scope of the study. Only regulatory frameworks with a material impact on operations, compliance, trade, sustainability, or market access are analyzed in detail.
Chapter 4. Key Investment Pockets & Opportunity Analysis
- 4.1 Plastic Antioxidants Market Attractiveness Analysis
- 4.1.1 By Region – Investment Attractiveness Matrix (Volume × CAGR)
- 4.2 Absolute Revenue Growth Opportunity
- 4.2.1 By Region – Absolute USD Growth Through 2032
- 4.3 Incremental Volume Opportunity
- 4.3.1 By Region – Incremental Volume Through 2032
- 4.3.2 Segment – Incremental Volume
- 4.4 Emerging Submarket Opportunity Deep Dive (Subject to Applicability)
- 4.5 Emerging Market Opportunity Scorecards
- 4.5.1 United States
- 4.5.2 Europe
- 4.5.3 Asia
- 4.5.4 Middle East & Africa
Note: Emerging Market Opportunity Scorecards will be included based on relevance and strategic importance. Regions listed are indicative and may vary depending on data availability and market dynamics.
Chapter 5. Plastic Antioxidants Import-Export Analysis & Trade Flows
- 5.1 Global Trade Overview
- 5.1.1 Global Export Value by Country (2024)
- 5.1.2 Global Export Volume by Country (2024)
- 5.1.3 Global Import Value by Country (2024)
- 5.1.4 Global Import Volume by Country (2024)
- 5.1.5 Net Trade Balance by Country (2024)
- 5.2 Export Analysis – Segment
- 5.2.1 Type 1 (HS Code)
- 5.2.2 Type 2 (HS Code)
- 5.2.3 Type 3 (HS Code)
- 5.2.4 Type 4 (HS Code)
- 5.2.5 Type 5 (HS Code)
- 5.3 Import Analysis – Segment
- 5.3.1 Type 1 (HS Code)
- 5.3.2 Type 2 (HS Code)
- 5.3.3 Type 3 (HS Code)
- 5.3.4 Type 4 (HS Code)
- 5.3.5 Type 5 (HS Code)
- 5.4 Average Unit Trade Prices
- 5.4.1 Average Export Price – Segment & Country
- 5.4.2 Average Import Price – Segment & Source Country
- 5.4.3 Price Trends (2024)
- 5.5 Key Trade Route Analysis
- 5.5.1 Trade Route 1
- 5.5.2 Trade Route 2
- 5.5.3 Trade Route 3
- 5.5.4 Trade Route 4
- 5.5.5 Trade Route 5
- 5.6 Trade Policy Impact Assessment
- 5.6.1 US Anti-Dumping & Section 301 Tariffs
- 5.6.2 EU Customs Union Impact
- 5.6.3 Major Free Trade Agreements
- 5.6.4 USMCA Rules of Origin
Note: Trade policy analysis will be included only where relevant to the Plastic Antioxidants market.
Chapter 6. Competitive Landscape & Company Benchmarking
- 6.1 Plastic Antioxidants Market Concentration & Structure
- 6.1.1 Herfindahl-Hirschman Index (HHI) – vs. 2024
- 6.1.2 Tier 1, Tier 2 & Tier 3 Market Structure
- 6.1.3 Global, Regional & Local Player Dynamics
- 6.2 Plastic Antioxidants Market Share Analysis – 2024
- 6.2.1 Global Revenue Share by Company
- 6.2.2 Global Volume Share by Company
- 6.2.3 Regional Revenue Share
- 6.2.4 Market Share Evolution ( vs. 2024)
- 6.2.5 OEM Segment Share by Company
- 6.2.6 Replacement Segment Share by Company
- 6.3 Production/Delivery Capacity & Facility Analysis
- 6.3.1 Global Installed Capacity
- 6.3.2 Capacity Utilization Rates
- 6.3.3 Production/Output Volume
- 6.3.4 Facility Locations & Capacity Map
- 6.3.5 Planned Capacity Additions
- 6.4 Plastic Antioxidants Competitive Benchmarking Matrix
- 6.4.1 Revenue, Volume, CAGR & Profitability Comparison
- 6.4.2 Channel Revenue Mix
- 6.4.3 Geographic Revenue Exposure
- 6.4.4 R&D Intensity
- 6.4.5 Sustainability Maturity
- 6.5 Strategic Developments in Plastic Antioxidants (Last 24 Months)
- 6.5.1 Mergers, Acquisitions & Divestments
- 6.5.2 New Plastic Antioxidants Launches
- 6.5.3 Facility Expansions
- 6.5.4 Strategic Alliances, Joint Ventures & Partnerships
- 6.5.5 Distribution Expansion & Market Entry
- 6.5.6 Sustainability & ESG Initiatives
- 6.6 Competitive Strategy Mapping
- 6.6.1 Leader, Challenger, Follower & Niche Classification
- 6.6.2 Pricing Strategy Comparison
- 6.6.3 Channel Strategy Matrix
Note: Strategic developments are included based on their materiality and the availability of reliable information.
Chapter 7. Global Plastic Antioxidants Market – By Distribution Channel
- 7.1 Segment Overview
- 7.1.1 Volume & Revenue Split by Channel (2024 & 2032)
- 7.1.2 Channel Mix Evolution (2024-2032)
Chapter 8. Regional Market Analysis – Global Overview
- 8.1 Global Regional Overview
- 8.1.1 Regional Volume Share
- 8.1.2 Regional Revenue Share
- 8.1.3 Regional Volume by Region
- 8.1.4 Regional Revenue by Region
- 8.1.5 Regional Forecast Through 2032
- 8.2 Cross-Regional Segment Analysis
- 8.2.1 By Distribution Channel
- 8.2.2 By Brand/Price Tier
Chapter 9. North America Plastic Antioxidants Market
- 9.1 United States
- 9.2 Canada
- 9.3 Mexico
Chapter 10. Europe Plastic Antioxidants Market
- 10.1 Germany
- 10.2 France
- 10.3 Italy
- 10.4 United Kingdom
- 10.5 Spain
- 10.6 Poland
- 10.7 Russia
- 10.8 Netherlands
- 10.9 Belgium
- 10.10 Sweden
- 10.11 Denmark
- 10.12 Norway
- 10.13 Rest of Europe
Chapter 11. Asia Pacific Plastic Antioxidants Market
- 11.1 China
- 11.2 India
- 11.3 Japan
- 11.4 South Korea
- 11.5 Thailand
- 11.6 Indonesia
- 11.7 Vietnam
- 11.8 Malaysia
- 11.9 Australia
- 11.10 Rest of Asia Pacific
Chapter 12. Latin America Plastic Antioxidants Market
- 12.1 Brazil
- 12.2 Argentina
- 12.3 Colombia
- 12.4 Chile
- 12.5 Rest of Latin America
Chapter 13. Middle East Plastic Antioxidants Market
- 13.1 Saudi Arabia
- 13.2 United Arab Emirates
- 13.3 Turkey
- 13.4 Israel
- 13.5 Iran
- 13.6 Rest of the Middle East
Chapter 14. Africa Plastic Antioxidants Market
- 14.1 South Africa
- 14.2 Egypt
- 14.3 Nigeria
- 14.4 Morocco
- 14.5 Rest of Africa
Chapter 15. Plastic Antioxidants Company Profiles
- 15.1 [Company 01]
- 15.1.1 Company Overview
- 15.1.2 Key Management Personnel
- 15.1.3 Products & Services Portfolio
- 15.1.4 Financial Performance
- 15.1.5 Key Market Focus & Geographic Presence
- 15.1.6 Recent Developments & Strategic Initiatives
Note: The company profile list is preliminary and may change based on research findings, market developments, data availability, and client requirements.
Chapter 16. Appendices
- Appendix A – List of Abbreviations & Acronyms
- Appendix B – Industry Classification Code Reference – Full Series
- Appendix C – Production & Capacity Data Tables
- Appendix D – End-Use & Demand Base Tables
- Appendix E – Consumption & Replacement Rate Assumptions
- Appendix F – ASP Reference Tables
- Appendix G – Manufacturing & Facility Database
- Appendix H – Import-Export Data Tables
- Appendix I – Regulatory Summary Tables
- Appendix J – Primary Research Participant List (Anonymized)
- Appendix K – Primary Research Questionnaire Framework
- Appendix L – Data Sources & Bibliography
- Appendix M – Market Size Divergence & Source Comparison
Chapter 17. Research Methodology
- 17.1 Research Framework & Philosophy
- 17.2 Secondary Research – Sources, Hierarchy & Data Extraction
- 17.3 Data Modeling – Bottom-Up & Top-Down Market Sizing
- 17.4 Primary Research – Stakeholder Framework, LOI & Sample Sizes
- 17.5 Forecast Methodology – Regression, Scenario & Sensitivity Analysis
- 17.6 Quality Control – Four-Layer Validation Framework
- 17.7 Limitations & Standard Assumptions
- 17.8 Disclaimer
