
Market Overview:
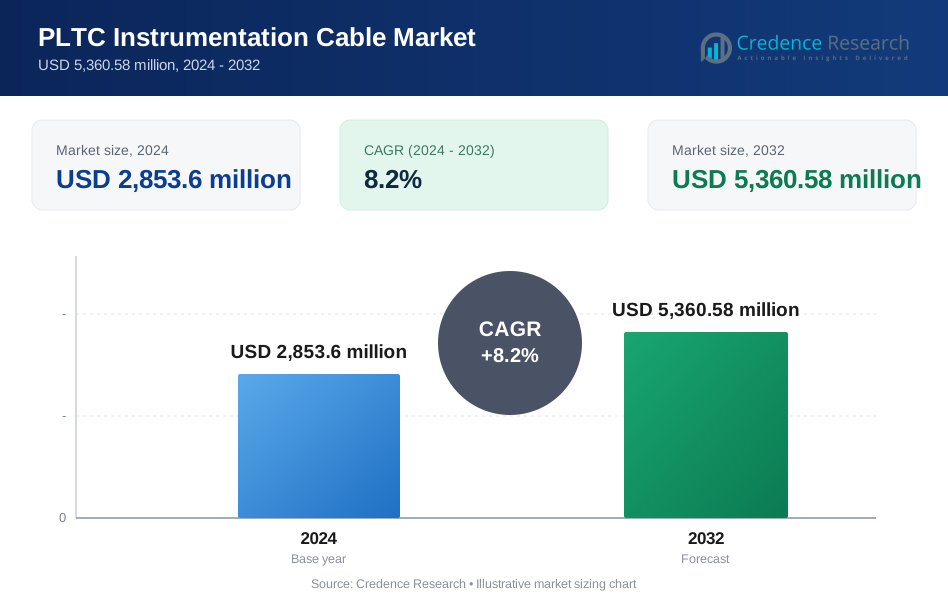
The global PLTC instrumentation cable market was valued at USD 2,853.6 million in 2024 and is projected to reach USD 5,360.58 million by 2032, expanding at a CAGR of 8.2% during the forecast period (2025–2032).
| REPORT ATTRIBUTE | DETAILS |
|---|---|
| Historical Period | 2020-2023 |
| Base Year | 2024 |
| Forecast Period | 2025-2032 |
| PLTC Instrumentation Cable Market Size 2024 | USD 2,853.6 million |
| PLTC Instrumentation Cable Market, CAGR | 8.2% |
| PLTC Instrumentation Cable Market Size 2032 | USD 5,360.58 million |
The PLTC instrumentation cable market features strong competition among major players including Fujikura, Lapp Group, CommScope, Hellenic Group, Kabelwerk Eupen, Belden, Furukawa Electric, Helukabel, Leoni, and Elsewedy Electric, each advancing portfolios with durable insulation materials, enhanced EMI shielding, and compliance-driven certified cable solutions. These companies serve diverse industrial automation, energy, oil & gas, and process control applications through global distribution networks and region-specific manufacturing capabilities. Asia Pacific leads the market with approximately 38% share, driven by rapid industrialization and infrastructure expansion, followed by North America holding around 32%, supported by modernization of automation assets and stringent safety standards.

Market Insights:
- The PLTC instrumentation cable market was valued at USD 2853.6 million in 2024 and is projected to reach USD 5360.58 million by 2032, expanding at a 8.2% CAGR during 2025–2032.
- Growth is driven by increasing industrial automation, modernization of process plants, and safety-compliant cabling requirements in hazardous and mission-critical environments across oil & gas, chemicals, utilities, and manufacturing.
- Rising adoption of IIoT-enabled sensors, remote monitoring systems, and durable specialty-jacketed cables designed for corrosion, heat, and EMI resistance is shaping product innovation.
- The market reflects competitive participation from global cable manufacturers focused on UL/IEC compliance, enhanced shielding materials, and expanded footprints in fast-growing industrial regions.
- Asia Pacific holds 38% market share, leading adoption, followed by North America at 32%; meanwhile, overall shielded pairs/triads dominate by type, driven by cost-efficient deployment and standard instrumentation loop requirements.
Market Segmentation Analysis:
By Type
Within PLTC instrumentation cables, overall shielded pairs/triads remain the dominant sub-segment, accounting for the larger market share due to their cost efficiency, simplified cable design, and suitability for standard analog signal transmission in industrial environments. These configurations are widely adopted in moderate noise applications such as control wiring and general instrumentation loops, where full pair isolation is not critical. Meanwhile, individual and overall shielded pairs record steady demand growth as industries operate near variable-frequency drives, high-power motors, and digitally controlled production lines that require improved crosstalk prevention and enhanced electromagnetic interference (EMI) suppression.
- For instance, Belden’s PLTC-rated 3106A overall-shielded twisted pair cable features 100% aluminum/polyester foil shielding plus a 65% tinned copper braid with a 22 AWG conductor designed for low-voltage control signals.
By End Use
Across end-use industries, oil & gas represents the leading application segment, holding the dominant share, driven by hazardous-area certified cable requirements and expanding investments in pipeline monitoring, refinery upgrades, and offshore platforms. Chemical facilities demonstrate significant utilization due to continuous-process plants requiring corrosion-resistant instrumentation cabling. Process automation emerges as a fast-rising adopter as industries deploy PLC-based automated control architectures. Manufacturing maintains consistent demand across assembly lines and robotics, but growth momentum strongly favors sectors modernizing legacy assets—supporting long-term reliance on PLTC cables for secure low-voltage signaling in mission-critical environments.
- For instance, Nexans’ fire-resistant instrumentation cable used in offshore platforms is engineered with mica tape insulation capable of withstanding 850°C for 120 minutes, supporting emergency shutdown systems. Chemical facilities also deploy PLTC cabling due to continuous-process environments requiring corrosion resistance.
Key Growth Drivers:
Expansion of Industrial Automation Infrastructure
The shift toward digitally enabled production environments strongly drives demand for PLTC instrumentation cables, particularly as industries expand automation layers to enhance precision, reduce manual labor, and optimize resource utilization. Programmable logic controllers (PLCs), distributed control systems (DCS), and sensor-integrated machinery depend on reliable low-voltage communication, where PLTC cables ensure noise-resistant transmission. Increased adoption of IoT-enabled monitoring in manufacturing, utilities, and process industries strengthens this requirement, particularly for real-time diagnostics, predictive maintenance, and asset performance management. As legacy plants modernize to achieve Industry 4.0 readiness, these cables serve as essential connectivity components, enabling integration across both analog and digital control environments.
- For instance, Siemens’ SIMATIC S7 PLC platform supports the deployment of thousands of I/O points through multiple distributed I/O systems(such as the ET 200MP series), which connect to the central controller via industrial networks like PROFINET, requiring robust cabling to maintain signal integrity across extended plant layouts.
Stringent Safety Standards in Hazardous and Mission-Critical Environments
Enhanced regulatory focus on safety compliance in oil & gas, chemical, and energy sectors supports market growth for PLTC instrumentation cables. Classified locations dealing with flammable vapors, corrosive emissions, or high-temperature operation require certified PLTC cables to mitigate risks associated with electrical faults, EMI interference, or signal disruption. Adoption of fire-retardant insulation, chemical-resistant jacketing, and advanced shielding aligns with evolving NEC, ANSI/ISA, and IEC directives. Growing investment in leak detection systems, shutdown mechanisms, and refinery monitoring increases cable density across field instrumentation networks. Compliance-driven replacements within aging pipelines and brownfield facilities further accelerate demand, ensuring safer operational continuity.
- For instance, Hellenic Cables manufactures fire-resistant instrumentation cables tested to maintain circuit integrity for 120 minutes at 850°C under IEC 60331 conditions, ensuring safe operation during critical events.
Modernization of Energy, Utility, and Process Infrastructure
Large-scale capital expenditure on utility grid upgrades, renewable energy integration, and wastewater automation continues to boost PLTC cable deployment. Renewable systems including biofuel processing, thermal plants, and green hydrogen pilots depend heavily on instrumentation networks for temperature, pressure, and flow control. The transition toward smart substations and digital grid monitoring further reinforces need for shielded, interference-resistant cabling. Emerging investments in water treatment, desalination, and environmental monitoring mandate durable cable solutions capable of withstanding moisture ingress, chemical exposure, and extended outdoor operation. As governments prioritize sustainability, infrastructure modernization supports long-term and diversified consumption of PLTC instrumentation cabling.
Key Trends & Opportunities:
Growing Integration of PLTC Cables with Smart Sensors and IIoT Field Devices
The proliferation of intelligent sensors, edge-processing modules, and cloud-enabled condition monitoring systems presents new opportunities for PLTC cable manufacturers. While wireless communication adoption is rising, wired connectivity remains preferred in hazardous or EMI-prone locations where signal reliability is critical. PLTC cables increasingly support hybrid analog/digital architectures coexisting within facilities undergoing phased modernization. The trend toward remote diagnostics and autonomous machine feedback loops boosts demand for cables that support advanced shielding architectures and futureproof communication interfaces. Manufacturers offering IIoT-compatible cable lines with extended lifecycle and enhanced data integrity stand to benefit.
- For instance, "Honeywell's smart field instrumentation solutions support integration with a wide array of connected sensing points globally, often using the HART protocol (Highway Addressable Remote Transducer).
Demand for High-Endurance, Specialty-Jacketed, and Environment-Specific Cabling
The market is witnessing accelerated demand for PLTC cables engineered for extreme temperatures, corrosive industrial atmospheres, moisture-laden sites, and UV-exposed installations. Chemical processing units, offshore rigs, and waste treatment operations require cable jackets that resist abrasion, oil penetration, and environmental degradation. This trend creates opportunities for halogen-free, low-smoke, and recyclable polymers aligned with sustainability mandates. As industries pursue longer maintenance cycles and reduced operational downtime, premium high-durability cabling can command value-based pricing. Cable manufacturers developing specialized formulations tailored to niche environments are positioned to capture growth in high-performance segments.
- For instance, Helukabel’s MULTIFLEX 512®-PUR cable is engineered for high mechanical stress in continuous-motion systems like robotic and automated conveyor environments. The shielded version, MULTIFLEX 512®-C-PUR, has been tested in Helukabel’s own test laboratories to withstand approximately 10 million alternating bending cyclesunder specific conditions (such as a minimum bending radius of 7.5x the outer diameter in moving applications), which ensures reliable performance in multi-shift operations.
Key Challenges:
Competition from Alternative Communication Technologies and Protocols
Although PLTC cables remain integral for instrumentation, the market faces rising competition from industrial wireless communications and fiber-optic networks offering higher bandwidth and remote configuration benefits. Facilities adopting AI-driven analytics and cloud aggregation may prioritize high-speed digital connectivity, reducing reliance on copper-based PLTC solutions in selected applications. Additionally, proprietary communication protocols and industrial Ethernet standards are reshaping network designs in advanced manufacturing ecosystems. Cable providers must address this challenge through value-added features such as improved EMI protection, digital compatibility, and longer service cycles to retain market relevance.
Raw Material Price Volatility and Cost Pressures
Fluctuations in copper, aluminum, polymer insulation, and specialty chemical feedstocks directly impact production costs for PLTC instrumentation cables. Price instability affects profit margins, particularly in large-scale utility and industrial procurement cycles where contracts are cost-sensitive and long-term. Supply chain disruptions and geopolitical trade constraints intensify volatility in metal-based materials, leading to inventory risks and extended lead times. Manufacturers must mitigate these challenges by optimizing material utilization, diversifying supplier bases, and developing alternative conductors or jacketing solutions without compromising safety and performance requirements.
Regional Analysis:
North America
North America holds approximately 32% market share in the PLTC instrumentation cable sector, supported by extensive automation across oil & gas, chemicals, utilities, and advanced manufacturing. The United States leads adoption due to modernization of shale extraction facilities, increased pipeline safety programs, and expansion of smart grid infrastructure. Regulatory compliance with NEC, NFPA, and UL standards reinforces demand for certified PLTC cables in hazardous and mission-critical environments. Canada’s investment in mining automation and renewable energy integration further contributes to steady consumption, solidifying North America as a key market for high-performance instrumentation cabling solutions.
Europe
Europe accounts for around 24% market share, driven by process automation maturity and stringent industrial safety mandates. Strong adoption across petrochemicals, pharmaceutical production, water treatment, and green hydrogen pilot plants supports demand for shielded, corrosion-resistant PLTC cables. The region’s decarbonization agenda accelerates upgrades in power distribution monitoring and industrial digitalization. Germany, France, and the U.K. lead implementation, while Eastern Europe demonstrates rising consumption as manufacturing relocates and refinery modernization progresses. Compliance with IEC and REACH standards shapes material selection and product innovation, positioning Europe as a hub for sustainable specialty-jacketed cable solutions.
Asia Pacific
Asia Pacific represents the largest share at approximately 38%, driven by rapid industrialization, energy infrastructure expansion, and growth of chemical and manufacturing clusters. China and India lead ongoing investments in process automation, renewable generation, and petrochemical capacity additions. Southeast Asia further boosts adoption through LNG terminals, fertilizer plants, and wastewater treatment upgrades. The region’s cost-optimized engineering base supports high-volume procurement, compelling suppliers to balance performance standards with pricing competitiveness. With public and private capital committed to upgrading industrial safety and automation resilience, Asia Pacific continues to drive volume demand for PLTC instrumentation cables.
Latin America
Latin America holds nearly 4% of market share, supported primarily by oil & gas and mining-focused automation programs in Brazil, Mexico, and Argentina. Increasing safety audits in offshore operations, pipeline monitoring, and refining activities drives adoption of certified PLTC cabling for low-voltage control loops. Investment in water treatment and food-processing facilities indicates emerging multi-industry demand. However, procurement cycles remain sensitive to macroeconomic fluctuations, requiring suppliers to compete through value-engineered solutions. Upgrades in copper mining operations, fertilizer plants, and ethanol production facilities signal moderate long-term growth potential.
Middle East & Africa
Middle East & Africa account for approximately 2% market share, primarily concentrated in large oil & gas and petrochemical megaprojects across Saudi Arabia, UAE, and Qatar. Demand centers on high-temperature and corrosion-resistant PLTC cables suitable for offshore, desert, and refinery environments. Africa’s adoption remains nascent but gradually increases through power generation and mining automation initiatives in South Africa and West Africa. Infrastructure modernizations and national energy diversification agendas provide incremental opportunities; however, reliance on cyclical hydrocarbon investments limits sustained growth momentum compared to other global regions.
Market Segmentations:
By Type
- Overall shielded pairs/triads
- Individual and overall shielded pairs
By End Use
- Oil & gas
- Chemical
- Process automation
- Manufacturing
By Geography
- North America
- U.S.
- Canada
- Mexico
- Europe
- Germany
- France
- U.K.
- Italy
- Spain
- Rest of Europe
- Asia Pacific
- China
- Japan
- India
- South Korea
- South-east Asia
- Rest of Asia Pacific
- Latin America
- Brazil
- Argentina
- Rest of Latin America
- Middle East & Africa
- GCC Countries
- South Africa
- Rest of the Middle East and Africa
Competitive Landscape:
The PLTC instrumentation cable market is characterized by the presence of established global electrical cable manufacturers, regional specialists, and vertically integrated suppliers serving process industries. Competition centers on certification compliance, EMI shielding performance, material durability, signal integrity, and the ability to support both analog and digitally evolving automation architectures. Leading players differentiate through fire-resistant compounds, chemical-resistant jacketing, halogen-free designs, and cables engineered for hazardous or harsh outdoor environments. Strategic initiatives include capacity expansion, partnerships with automation OEMs, and development of cables compatible with IIoT-enabled sensors and control systems. Price competitiveness remains essential in high-volume procurements, while customized, high-endurance cabling benefits from value-based pricing strategies in oil & gas, chemical, utilities, and renewable infrastructure. The market continues to consolidate around suppliers capable of offering broad product portfolios, global certification coverage, and responsive supply chains aligned with modernization and industrial safety priorities.
Key Player Analysis:
- Fujikura
- Lapp Group
- CommScope
- Hellenic Group
- Kabelwerk Eupen
- Belden
- Furukawa Electric
- Helukabel
- Leoni
- Elsewedy Electric
Recent Developments:
- In September 2025, Fujikura published a press release (News No. 506) announcing the world’s first 13,824-fiber SWR™/WTC™ cable, marking a milestone in high-density fiber-optic cable offerings.
- In 2025, Kabelwerk Eupen Eupen Cable (the cable division of Kabelwerk Eupen) confirmed its participation in the upcoming PMRExpo 2025 (scheduled for November in Cologne), demonstrating commitment to industrial and infrastructure cabling sectors; the company continues to highlight its broad “control and instrumentation cables” portfolio alongside low- and medium-voltage products.
- In 2024, Lapp Group the company released its full regional catalogue (Asia-Pacific 2024), reflecting updated product lines suggesting continued market coverage and renewed cataloguing for customers, though no specific PLTC-instrumentation-cable news was found.
Report Coverage:
The research report offers an in-depth analysis based on Type, End-Use and Geography. It details leading market players, providing an overview of their business, product offerings, investments, revenue streams, and key applications. Additionally, the report includes insights into the competitive environment, SWOT analysis, current market trends, as well as the primary drivers and constraints. Furthermore, it discusses various factors that have driven market expansion in recent years. The report also explores market dynamics, regulatory scenarios, and technological advancements that are shaping the industry. It assesses the impact of external factors and global economic changes on market growth. Lastly, it provides strategic recommendations for new entrants and established companies to navigate the complexities of the market.
Future Outlook:
- Demand will rise as industrial automation expands across manufacturing, energy, and utilities.
- Adoption of IIoT-connected instrumentation will drive higher reliance on shielded, interference-resistant cabling.
- Safety-certified cables will gain priority in hazardous environments such as refineries, chemical plants, and offshore platforms.
- Material innovation will focus on halogen-free, recyclable, and low-smoke cable compounds.
- Increased use of data-driven maintenance will require cables with longer lifecycle performance.
- Emerging renewable and hydrogen projects will create new application avenues.
- Fiber and wireless alternatives will coexist but not fully replace PLTC solutions in high-risk zones.
- Large-scale infrastructure upgrades will support sustained replacement demand.
- Suppliers will expand regional manufacturing to reduce logistics and cost pressures.
- Custom, application-specific cable designs will become a competitive differentiator.
Request a Free Sample
Fill in your details and we'll send you a free sample report.
- Sample data tables & charts
- Research methodology
Need a Custom Version of This Report?
Tailor the scope, geography, or segments to your exact requirements.
- Custom geography or segment scope
- Direct access to our analyst team
Frequently Asked Questions
What is the current market size for the PLTC instrumentation cable market, and what is its projected size in 2032?
At what Compound Annual Growth Rate is the PLTC instrumentation cable market projected to grow between 2024 and 2032?
Which PLTC instrumentation cable segment held the largest share in 2024?
What are the primary factors fueling the growth of the PLTC instrumentation cable market?
Who are the leading companies in the PLTC instrumentation cable market?
Table of Content
Chapter 1. Report Introduction
- 1.1 Report Description & Purpose
- 1.1.1 Report Title & Market Definition
- 1.1.2 Unique Selling Propositions (USP) & Key Differentiators
- 1.1.3 Value Proposition for Stakeholders
- 1.2 Research Objectives
- 1.2.1 Market Sizing Objectives (Volume & Revenue)
- 1.2.2 Segmentation Objectives
- 1.2.3 Competitive Intelligence Objectives
- 1.2.4 Forecast & Scenario Objectives
- 1.3 Report Scope
- 1.3.1 PLTC Instrumentation Cable Scope – Types & Subtypes Covered
- 1.3.2 Geographic Scope – Regions & Countries Covered
- 1.3.3 Historical Period, Base Year & Forecast Period (2024; forecast to 2032)
- 1.3.4 Inclusions & Exclusions
- 1.4 HS Code & Classification Framework
- 1.5 Currency, Units & Pricing Basis
- 1.6 Target Stakeholders
- 1.7 Limitations & Assumptions
Chapter 2. Executive Summary
- 2.1 Global PLTC Instrumentation Cable Market Snapshot
- 2.1.1 Market Size – Historical (2024) & Forecast (2024-2032) (2024: USD 2,853.6 million → 2032: USD 5,360.58 million)
- 2.1.2 Volume & Revenue – Global Totals
- 2.1.3 Key Market Highlights – Top Five Facts
- 2.2 PLTC Instrumentation Cable Market Segmentation Snapshot
- 2.2.1 Market Split by Region – 2024 vs. 2032
- 2.3 Competitive Snapshot
- 2.3.1 Top 10 Players by Revenue Share – 2024
- 2.3.2 Top 10 Players by Volume Share – 2024
- 2.3.3 Recent Strategic Developments (18-Month Summary)
- 2.4 Key Investment Highlights & Strategic Conclusions
Chapter 3. PLTC Instrumentation Cable Market Dynamics & Industry Analysis
- 3.1 Market Overview & Context
- 3.1.1 PLTC Instrumentation Cable Market Position in the Broader Automotive Value Chain
- 3.1.2 OEM vs. Replacement Market Dynamics
- 3.1.3 Market Maturity & Development Stage by Region
- 3.2 PLTC Instrumentation Cable Market Drivers
- 3.3 PLTC Instrumentation Cable Market Restraints & Challenges
- 3.4 PLTC Instrumentation Cable Market Opportunities
- 3.5 Porter's Five Forces Analysis
- 3.5.1 Threat of New Entrants
- 3.5.2 Bargaining Power of Suppliers
- 3.5.3 Bargaining Power of Buyers
- 3.5.4 Threat of Substitutes
- 3.5.5 Competitive Rivalry – Intensity Assessment
- 3.6 PLTC Instrumentation Cable Value Chain Analysis
- 3.6.1 Upstream – Raw Material/Input Suppliers
- 3.6.1.1 Raw Material/Input 1
- 3.6.1.2 Raw Material/Input 2
- 3.6.1.3 Raw Material/Input 3
- 3.6.2 Midstream – Production/Manufacturing/Service Delivery
- 3.6.2.1 Production/Process Overview
- 3.6.2.2 Key Facility Locations & Capacity by Manufacturer
- 3.6.3 Downstream – Distribution & End Consumer
- 3.6.3.1 Primary Channel – B2B/OEM
- 3.6.3.2 Secondary Channels – Dealer, Retail, Online, Direct
- 3.6.4 Value Chain Profitability Analysis
- 3.6.1 Upstream – Raw Material/Input Suppliers
- 3.7 PESTEL Analysis
- 3.7.1 Political Factors
- 3.7.2 Economic Factors
- 3.7.3 Social Factors
- 3.7.4 Technological Factors
- 3.7.5 Environmental Factors
- 3.7.6 Legal Factors
- 3.8 PLTC Instrumentation Cable Supply Chain Analysis
- 3.8.1 Raw Material/Input Supply Risk Assessment
- 3.8.2 Manufacturing Concentration Risk (Geographic Exposure)
- 3.8.3 Trade Disruption Impact Analysis
- 3.9 Regulatory & Policy Landscape
Note: The regulatory and policy landscape section covers regulations based on their applicability to the market, PLTC Instrumentation Cable category, geography, and scope of the study. Only regulatory frameworks with a material impact on operations, compliance, trade, sustainability, or market access are analyzed in detail.
Chapter 4. Key Investment Pockets & Opportunity Analysis
- 4.1 PLTC Instrumentation Cable Market Attractiveness Analysis
- 4.1.1 By Region – Investment Attractiveness Matrix (Volume × CAGR)
- 4.2 Absolute Revenue Growth Opportunity
- 4.2.1 By Region – Absolute USD Growth Through 2032
- 4.3 Incremental Volume Opportunity
- 4.3.1 By Region – Incremental Volume Through 2032
- 4.3.2 Segment – Incremental Volume
- 4.4 Emerging Submarket Opportunity Deep Dive (Subject to Applicability)
- 4.5 Emerging Market Opportunity Scorecards
- 4.5.1 United States
- 4.5.2 Europe
- 4.5.3 Asia
- 4.5.4 Middle East & Africa
Note: Emerging Market Opportunity Scorecards will be included based on relevance and strategic importance. Regions listed are indicative and may vary depending on data availability and market dynamics.
Chapter 5. PLTC Instrumentation Cable Import-Export Analysis & Trade Flows
- 5.1 Global Trade Overview
- 5.1.1 Global Export Value by Country (2024)
- 5.1.2 Global Export Volume by Country (2024)
- 5.1.3 Global Import Value by Country (2024)
- 5.1.4 Global Import Volume by Country (2024)
- 5.1.5 Net Trade Balance by Country (2024)
- 5.2 Export Analysis – Segment
- 5.2.1 Type 1 (HS Code)
- 5.2.2 Type 2 (HS Code)
- 5.2.3 Type 3 (HS Code)
- 5.2.4 Type 4 (HS Code)
- 5.2.5 Type 5 (HS Code)
- 5.3 Import Analysis – Segment
- 5.3.1 Type 1 (HS Code)
- 5.3.2 Type 2 (HS Code)
- 5.3.3 Type 3 (HS Code)
- 5.3.4 Type 4 (HS Code)
- 5.3.5 Type 5 (HS Code)
- 5.4 Average Unit Trade Prices
- 5.4.1 Average Export Price – Segment & Country
- 5.4.2 Average Import Price – Segment & Source Country
- 5.4.3 Price Trends (2024)
- 5.5 Key Trade Route Analysis
- 5.5.1 Trade Route 1
- 5.5.2 Trade Route 2
- 5.5.3 Trade Route 3
- 5.5.4 Trade Route 4
- 5.5.5 Trade Route 5
- 5.6 Trade Policy Impact Assessment
- 5.6.1 US Anti-Dumping & Section 301 Tariffs
- 5.6.2 EU Customs Union Impact
- 5.6.3 Major Free Trade Agreements
- 5.6.4 USMCA Rules of Origin
Note: Trade policy analysis will be included only where relevant to the PLTC Instrumentation Cable market.
Chapter 6. Competitive Landscape & Company Benchmarking
- 6.1 PLTC Instrumentation Cable Market Concentration & Structure
- 6.1.1 Herfindahl-Hirschman Index (HHI) – vs. 2024
- 6.1.2 Tier 1, Tier 2 & Tier 3 Market Structure
- 6.1.3 Global, Regional & Local Player Dynamics
- 6.2 PLTC Instrumentation Cable Market Share Analysis – 2024
- 6.2.1 Global Revenue Share by Company
- 6.2.2 Global Volume Share by Company
- 6.2.3 Regional Revenue Share
- 6.2.4 Market Share Evolution ( vs. 2024)
- 6.2.5 OEM Segment Share by Company
- 6.2.6 Replacement Segment Share by Company
- 6.3 Production/Delivery Capacity & Facility Analysis
- 6.3.1 Global Installed Capacity
- 6.3.2 Capacity Utilization Rates
- 6.3.3 Production/Output Volume
- 6.3.4 Facility Locations & Capacity Map
- 6.3.5 Planned Capacity Additions
- 6.4 PLTC Instrumentation Cable Competitive Benchmarking Matrix
- 6.4.1 Revenue, Volume, CAGR & Profitability Comparison
- 6.4.2 Channel Revenue Mix
- 6.4.3 Geographic Revenue Exposure
- 6.4.4 R&D Intensity
- 6.4.5 Sustainability Maturity
- 6.5 Strategic Developments in PLTC Instrumentation Cable (Last 24 Months)
- 6.5.1 Mergers, Acquisitions & Divestments
- 6.5.2 New PLTC Instrumentation Cable Launches
- 6.5.3 Facility Expansions
- 6.5.4 Strategic Alliances, Joint Ventures & Partnerships
- 6.5.5 Distribution Expansion & Market Entry
- 6.5.6 Sustainability & ESG Initiatives
- 6.6 Competitive Strategy Mapping
- 6.6.1 Leader, Challenger, Follower & Niche Classification
- 6.6.2 Pricing Strategy Comparison
- 6.6.3 Channel Strategy Matrix
Note: Strategic developments are included based on their materiality and the availability of reliable information.
Chapter 7. Global PLTC Instrumentation Cable Market – By Distribution Channel
- 7.1 Segment Overview
- 7.1.1 Volume & Revenue Split by Channel (2024 & 2032)
- 7.1.2 Channel Mix Evolution (2024-2032)
Chapter 8. Regional Market Analysis – Global Overview
- 8.1 Global Regional Overview
- 8.1.1 Regional Volume Share
- 8.1.2 Regional Revenue Share
- 8.1.3 Regional Volume by Region
- 8.1.4 Regional Revenue by Region
- 8.1.5 Regional Forecast Through 2032
- 8.2 Cross-Regional Segment Analysis
- 8.2.1 By Distribution Channel
- 8.2.2 By Brand/Price Tier
Chapter 9. North America PLTC Instrumentation Cable Market
- 9.1 United States
- 9.2 Canada
- 9.3 Mexico
Chapter 10. Europe PLTC Instrumentation Cable Market
- 10.1 Germany
- 10.2 France
- 10.3 Italy
- 10.4 United Kingdom
- 10.5 Spain
- 10.6 Poland
- 10.7 Russia
- 10.8 Netherlands
- 10.9 Belgium
- 10.10 Sweden
- 10.11 Denmark
- 10.12 Norway
- 10.13 Rest of Europe
Chapter 11. Asia Pacific PLTC Instrumentation Cable Market
- 11.1 China
- 11.2 India
- 11.3 Japan
- 11.4 South Korea
- 11.5 Thailand
- 11.6 Indonesia
- 11.7 Vietnam
- 11.8 Malaysia
- 11.9 Australia
- 11.10 Rest of Asia Pacific
Chapter 12. Latin America PLTC Instrumentation Cable Market
- 12.1 Brazil
- 12.2 Argentina
- 12.3 Colombia
- 12.4 Chile
- 12.5 Rest of Latin America
Chapter 13. Middle East PLTC Instrumentation Cable Market
- 13.1 Saudi Arabia
- 13.2 United Arab Emirates
- 13.3 Turkey
- 13.4 Israel
- 13.5 Iran
- 13.6 Rest of the Middle East
Chapter 14. Africa PLTC Instrumentation Cable Market
- 14.1 South Africa
- 14.2 Egypt
- 14.3 Nigeria
- 14.4 Morocco
- 14.5 Rest of Africa
Chapter 15. PLTC Instrumentation Cable Company Profiles
- 15.1 [Company 01]
- 15.1.1 Company Overview
- 15.1.2 Key Management Personnel
- 15.1.3 Products & Services Portfolio
- 15.1.4 Financial Performance
- 15.1.5 Key Market Focus & Geographic Presence
- 15.1.6 Recent Developments & Strategic Initiatives
Note: The company profile list is preliminary and may change based on research findings, market developments, data availability, and client requirements.
Chapter 16. Appendices
- Appendix A – List of Abbreviations & Acronyms
- Appendix B – Industry Classification Code Reference – Full Series
- Appendix C – Production & Capacity Data Tables
- Appendix D – End-Use & Demand Base Tables
- Appendix E – Consumption & Replacement Rate Assumptions
- Appendix F – ASP Reference Tables
- Appendix G – Manufacturing & Facility Database
- Appendix H – Import-Export Data Tables
- Appendix I – Regulatory Summary Tables
- Appendix J – Primary Research Participant List (Anonymized)
- Appendix K – Primary Research Questionnaire Framework
- Appendix L – Data Sources & Bibliography
- Appendix M – Market Size Divergence & Source Comparison
Chapter 17. Research Methodology
- 17.1 Research Framework & Philosophy
- 17.2 Secondary Research – Sources, Hierarchy & Data Extraction
- 17.3 Data Modeling – Bottom-Up & Top-Down Market Sizing
- 17.4 Primary Research – Stakeholder Framework, LOI & Sample Sizes
- 17.5 Forecast Methodology – Regression, Scenario & Sensitivity Analysis
- 17.6 Quality Control – Four-Layer Validation Framework
- 17.7 Limitations & Standard Assumptions
- 17.8 Disclaimer
