
Market Overview
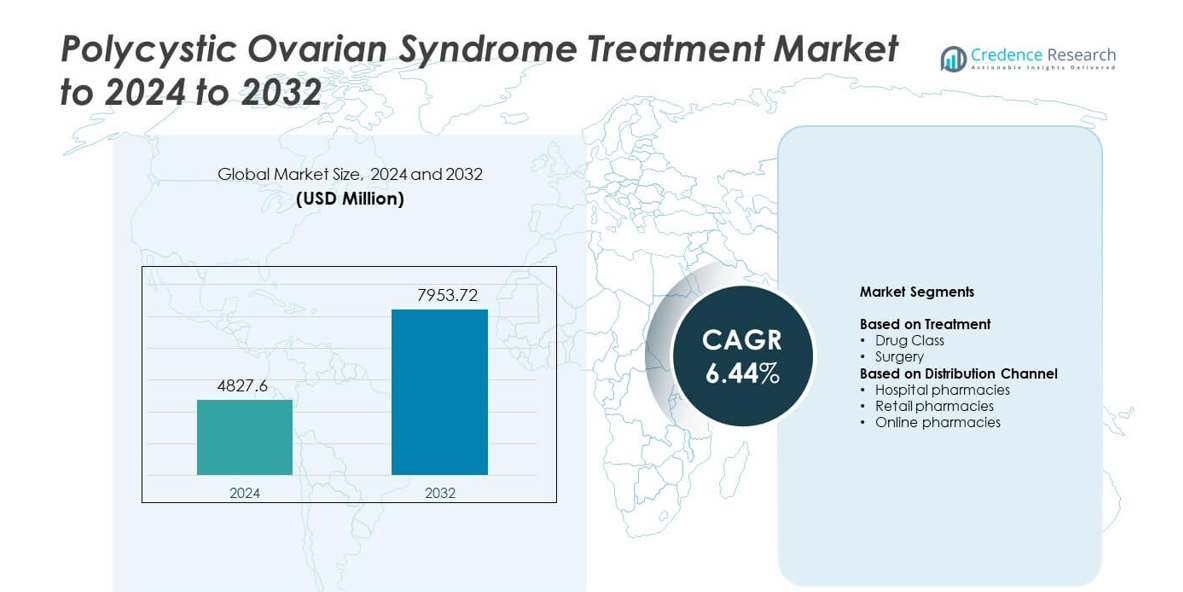
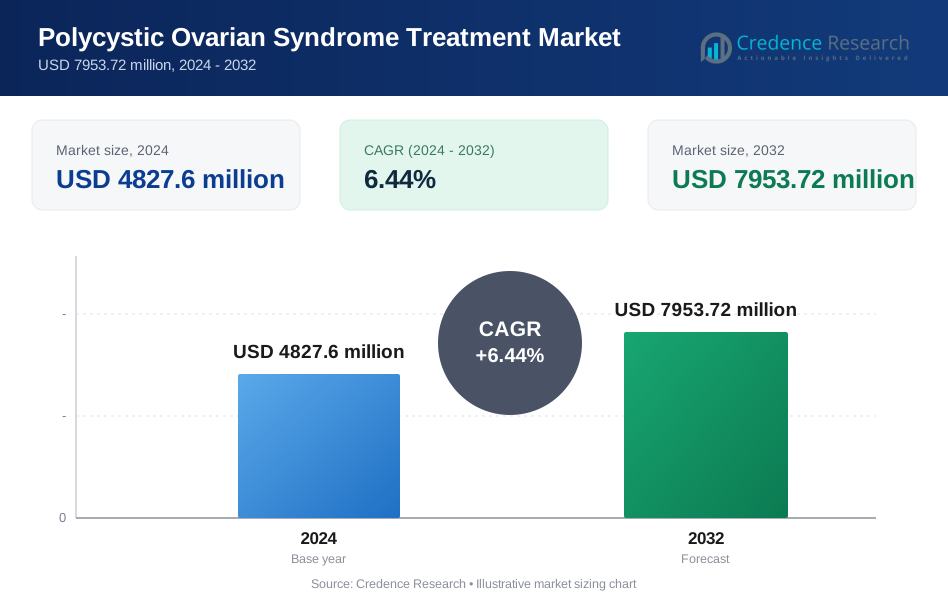
Polycystic Ovarian Syndrome Treatment Market size was valued USD 4827.6 million in 2024 and is anticipated to reach USD 7953.72 million by 2032, at a CAGR of 6.44% during the forecast period.
| REPORT ATTRIBUTE | DETAILS |
|---|---|
| Historical Period | 2020-2023 |
| Base Year | 2024 |
| Forecast Period | 2025-2032 |
| Polycystic Ovarian Syndrome Treatment Market Size 2024 | USD 4827.6 million |
| Polycystic Ovarian Syndrome Treatment Market, CAGR | 6.44% |
| Polycystic Ovarian Syndrome Treatment Market Size 2032 | USD 7953.72 million |
The Polycystic Ovarian Syndrome Treatment Market features active participation from companies such as Celmatix Inc., Abbott, Teva Pharmaceutical Industries Ltd, AstraZeneca, BioSyent Pharma Inc, Pfizer, Inc, Sanofi, Bayer AG, Bristol Myers Squibb Company, and Merck KGaA. These firms expanded access to hormonal therapies, metabolic regulators, and personalized treatment tools that support reproductive and endocrine health. Strong clinical adoption and rising diagnosis rates reinforced competitive activity across hospital and retail channels. North America led the market in 2024 with a 39% share, supported by advanced healthcare systems and broad therapeutic availability, while Europe followed with a 31% share driven by structured reproductive health frameworks and consistent treatment uptake.
Market Insights
- The Polycystic Ovarian Syndrome Treatment Market was valued at USD 4827.6 million in 2024 and is projected to reach USD 7953.72 million by 2032, expanding at a CAGR of 6.44%. • Growing diagnosis rates and rising use of hormonal and metabolic therapies drive stronger adoption across primary and specialist care, with drug class holding about 78% share in 2024. • Digital health tools, remote monitoring, and greater focus on metabolic management shape emerging trends that enhance long-term treatment engagement. • Competition intensifies as global pharmaceutical companies expand therapeutic portfolios and strengthen research programs targeting hormonal and metabolic pathways. • North America led the market with 39% share in 2024, followed by Europe at 31% and Asia Pacific at 22%, supported by higher treatment access, broader awareness, and expanding care frameworks across hospital, retail, and online channels.
Market Segmentation Analysis:
By Treatment
Drug class held the dominant share in 2024 with about 78% of the Polycystic Ovarian Syndrome Treatment Market. Demand stayed high because patients relied on hormonal therapies, insulin-sensitizing agents, and combined oral contraceptives to manage irregular cycles, hyperandrogenism, and metabolic imbalance. Wider prescribing support and updated clinical guidelines strengthened drug uptake across primary and specialty care. Surgery accounted for a smaller share due to its limited use and preference for minimally invasive options only in treatment-resistant cases. Rising awareness of early medical intervention helped drug class remain the leading category.
- For instance, Bayer currently reports that its contraceptive products were used by around 42 million women in low- and middle-income countries in 2022
By Distribution Channel
Hospital pharmacies led this segment in 2024 with nearly 46% share. Strong dominance came from higher patient footfall, structured diagnosis pathways, and greater access to specialist-recommended therapies. Hospital settings also ensured better availability of prescription drugs used for endocrine, metabolic, and reproductive management. Retail pharmacies followed due to broad community access and rising treatment adherence. Online pharmacies grew at a steady pace as patients used digital platforms for refills and home-delivery support. Strengthened clinical oversight helped hospital pharmacies maintain the top position.
- For instance, CVS Health reported that in 2023 its Pharmacy & Consumer Wellness segment filled more than 1.6 billion prescriptions and its Health Services segment processed about 2.3 billion pharmacy claims
Key Growth Drivers
Rising global prevalence of metabolic and hormonal disorders
Growing rates of insulin resistance, obesity, and hormonal imbalance increased PCOS diagnoses across all age groups. More women sought early medical care as symptoms became widely recognized in reproductive health programs. Healthcare systems expanded screening efforts, which increased treatment initiation and long-term management. These factors strengthened demand for drug-based therapies and specialist consultations. Rising awareness supported higher adoption of evidence-based treatment guidelines.
- For instance, Novo Nordisk stated that in 2024 its treatments were used by 43.0 million people living with diabetes and 2.2 million people living with obesity, underlining the growing clinical burden of metabolic diseases linked to PCOS.
Expansion of therapeutic options and clinical guidelines
New treatment pathways improved patient outcomes through targeted hormonal regulation, enhanced metabolic control, and individualized dosing. Updated clinical guidelines promoted broader use of insulin sensitizers and combination therapies. Pharmaceutical companies advanced research pipelines for hormonal agents and metabolic regulators. These developments supported better symptom management and higher adherence across primary and specialty care settings. Improved clinical clarity helped accelerate therapy uptake.
- For instance, Organon has committed with partners to help prevent 120 million unintended pregnancies by 2030 through expanded contraceptive access programs, reflecting industry-driven efforts to broaden women’s hormonal care choices.
Growing access to women’s health services
Investment in women-centric healthcare improved diagnostic capacity and specialist availability across hospitals and clinics. Awareness campaigns encouraged early consultations for irregular cycles, infertility concerns, and endocrine symptoms. Better insurance coverage expanded access to prescription therapies and regular monitoring. Digital health programs also increased continuous care for chronic PCOS symptoms. This strengthened long-term treatment engagement and sustained market growth.
Key Trends & Opportunities
Rising adoption of digital health and remote monitoring
Virtual consultations and women’s health apps enabled continuous management of hormonal fluctuations and metabolic patterns. Patients tracked symptoms, medication routines, and lifestyle adjustments through integrated platforms. Providers used remote data to fine-tune therapy plans and improve adherence. Demand for digital-care models rose as younger patients preferred accessible and flexible support tools. This trend opened new opportunities for treatment personalization.
- For instance, Teladoc Health’s filings note that as of recent reports, its virtual care platforms provided access to nearly 94 million U.S. Integrated Care members during 2024, and the company projects this number to grow to approximately 101 to 103 million U.S. Integrated Care members for the full year of 2025.
Growing focus on metabolic health management
PCOS care expanded beyond reproductive symptoms toward comprehensive metabolic control. Clinicians emphasized insulin sensitivity, weight management, and cardiovascular risk monitoring. Pharmaceutical innovation progressed around metabolic pathways, creating room for advanced insulin-sensitizing drugs. Lifestyle-based programs supported improved treatment outcomes. This shift created strong opportunities in both drug development and integrated care models.
- For instance, Eli Lilly reported clinical trial results in which tirzepatide achieved mean body-weight reductions of up to 16 kilograms over 52 weeks in adults with obesity, showing strong pharmacologic impact on metabolic risk factors relevant to PCOS patients.
Increasing interest in minimally invasive surgical approaches
Patients seeking alternatives to long-term medication adoption showed rising interest in selective surgical interventions. Laparoscopic ovarian drilling gained clinical attention for treatment-resistant cases. Technological improvements reduced recovery time and enhanced precision. These methods offered new therapeutic choices while maintaining safety. Expanding surgical capabilities created additional opportunity for specialized centers.
Key Challenges
Limited long-term treatment adherence
Many patients struggled with prolonged medication use due to symptom fluctuation, side effects, and inconsistent follow-up. Irregular adherence affected treatment outcomes and increased relapse risk. Healthcare systems lacked uniform counseling programs to support sustained management. This challenge restricted consistent market expansion and highlighted the need for stronger patient support models.
Significant unmet need in personalized therapy
PCOS symptoms vary widely, making standard treatment pathways less effective for many patients. Limited availability of individualized hormonal and metabolic solutions slowed therapeutic progress. Clinicians often relied on trial-and-error dosing, which increased treatment delays. Lack of biomarker-based treatment guidance hindered precision therapy adoption. This gap created a major challenge for optimized patient outcomes.
Regional Analysis
North America
North America held the largest share of about 39% in the Polycystic Ovarian Syndrome Treatment Market in 2024. Strong diagnostic awareness, advanced reproductive health services, and wide adoption of hormonal and metabolic therapies supported regional leadership. Patients accessed structured care pathways through specialized clinics and endocrinology centers. Insurance coverage improved treatment continuity, while research programs expanded therapeutic options. High engagement with digital health tools strengthened long-term management and supported stable market expansion across the United States and Canada.
Europe
Europe accounted for nearly 31% share in 2024, driven by strong clinical guidelines, well-established women’s health frameworks, and consistent adoption of prescription therapies. Public healthcare systems improved access to hormonal and insulin-sensitizing drugs. Increased screening for reproductive and metabolic disorders supported early diagnosis. Rising uptake of lifestyle-based programs and metabolic monitoring enhanced treatment outcomes. Countries such as Germany, the United Kingdom, France, and Italy contributed strongly to regional growth, supported by expanding patient awareness and structured specialist networks.
Asia Pacific
Asia Pacific captured about 22% share in 2024 and showed the fastest growth due to rising PCOS prevalence, increasing obesity rates, and expanding healthcare access. Urban centers in China, India, Japan, and South Korea saw higher diagnosis rates as women accessed reproductive health consultations. Growing investments in digital platforms improved treatment continuity, especially for chronic metabolic symptoms. Regional pharmaceutical production also enhanced drug availability. Economic growth and better insurance coverage supported a wider patient base seeking long-term management.
Latin America
Latin America held approximately 5% share in 2024, supported by growing recognition of hormonal and metabolic disorders among reproductive-age women. Countries such as Brazil, Mexico, and Argentina expanded screening through public health programs. Access to hormonal therapies increased as retail and hospital pharmacies improved distribution. Rising awareness of fertility concerns encouraged early specialist visits. Economic constraints limited therapy adoption in rural areas, yet urban healthcare upgrades helped the region maintain steady progress.
Middle East & Africa
Middle East & Africa accounted for around 3% share in 2024, influenced by gradual improvements in reproductive health services and growing public awareness. Urban hospitals in the Gulf region enhanced access to hormonal and metabolic treatments. Adoption remained slower in lower-income regions due to limited specialist availability. Lifestyle changes increased risk factors such as obesity, which raised diagnostic rates. International collaborations and digital healthcare expansion supported incremental growth across key markets in the region.
Market Segmentations:
By Treatment
- Drug Class
- Surgery
By Distribution Channel
- Hospital pharmacies
- Retail pharmacies
- Online pharmacies
By Geography
- North America
- U.S.
- Canada
- Mexico
- Europe
- Germany
- France
- U.K.
- Italy
- Spain
- Rest of Europe
- Asia Pacific
- China
- Japan
- India
- South Korea
- South-east Asia
- Rest of Asia Pacific
- Latin America
- Brazil
- Argentina
- Rest of Latin America
- Middle East & Africa
- GCC Countries
- South Africa
- Rest of the Middle East and Africa
Competitive Landscape
The Polycystic Ovarian Syndrome Treatment Market is shaped by key players such as Celmatix Inc., Abbott, Teva Pharmaceutical Industries Ltd, AstraZeneca, BioSyent Pharma Inc, Pfizer, Inc, Sanofi, Bayer AG, Bristol Myers Squibb Company, and Merck KGaA. These companies advanced therapeutic access through broader development of hormonal agents, metabolic regulators, and combination therapies designed to support long-term symptom control. Market participants expanded research programs targeting endocrine and metabolic pathways to improve treatment outcomes. Digital engagement platforms strengthened patient adherence and supported remote care models across global markets. Firms also invested in strategic partnerships with clinics and reproductive health networks to expand treatment reach. Strong competition encouraged ongoing innovation, improved drug availability, and wider adoption of evidence-based clinical protocols.
Key Player Analysis
- Celmatix Inc.
- Abbott
- Teva Pharmaceutical Industries Ltd
- AstraZeneca
- BioSyent Pharma Inc
- Pfizer, Inc
- Sanofi
- Bayer AG
- Bristol Myers Squibb Company
- Merck KGaA
Recent Developments
- In 2024, Bayer AG introduced an integrated treatment approach for Polycystic Ovarian Syndrome (PCOS) that combines lifestyle management with targeted medications to address metabolic and reproductive aspects.
- In 2023, Celmatix Inc. Launched a new PCOS drug development program targeting melatonin receptors outside the central nervous system (CNS) to restore ovarian function, moving beyond symptom management to address the underlying cause.
- In 2023, BioSyent Pharma Inc Launched Inofolic across the Canadian market, a natural health product in soft-gel capsule form that combines myo-inositol and folic acid to help women manage a variety of PCOS symptoms.
Report Coverage
The research report offers an in-depth analysis based on Treatment, Distribution Channel and Geography. It details leading market players, providing an overview of their business, product offerings, investments, revenue streams, and key applications. Additionally, the report includes insights into the competitive environment, SWOT analysis, current market trends, as well as the primary drivers and constraints. Furthermore, it discusses various factors that have driven market expansion in recent years. The report also explores market dynamics, regulatory scenarios, and technological advancements that are shaping the industry. It assesses the impact of external factors and global economic changes on market growth. Lastly, it provides strategic recommendations for new entrants and established companies to navigate the complexities of the market.
Future Outlook
- Demand for hormonal and metabolic therapies will rise as diagnosis rates increase.
- Digital health tools will support continuous monitoring and improve long-term care.
- Research will expand targeted therapies focused on metabolic and endocrine pathways.
- Adoption of personalized treatment plans will grow across specialist clinics.
- Minimally invasive surgical options will gain traction for treatment-resistant cases.
- Awareness programs will expand early diagnosis among adolescent and adult women.
- Healthcare systems will strengthen insurance coverage for chronic PCOS management.
- Partnerships between pharma companies and clinics will accelerate therapy accessibility.
- Lifestyle-focused treatment models will integrate more with clinical care pathways.
- Global investment in women’s health will drive steady market expansion.
Request a Free Sample
Fill in your details and we'll send you a free sample report.
- Sample data tables & charts
- Research methodology
Need a Custom Version of This Report?
Tailor the scope, geography, or segments to your exact requirements.
- Custom geography or segment scope
- Direct access to our analyst team
Frequently Asked Questions
What is the current market size for the Polycystic Ovarian Syndrome Treatment Market, and what is its projected size in 2032?
At what Compound Annual Growth Rate is the Polycystic Ovarian Syndrome Treatment Market projected to grow between 2024 and 2032?
Which Polycystic Ovarian Syndrome Treatment Market segment held the largest share in 2024?
What are the primary factors fueling the growth of the Polycystic Ovarian Syndrome Treatment Market?
Who are the leading companies in the Polycystic Ovarian Syndrome Treatment Market?
Table of Content
Chapter 1. Report Introduction
- 1.1 Report Description & Purpose
- 1.1.1 Report Title & Market Definition
- 1.1.2 Unique Selling Propositions (USP) & Key Differentiators
- 1.1.3 Value Proposition for Stakeholders
- 1.2 Research Objectives
- 1.2.1 Market Sizing Objectives (Volume & Revenue)
- 1.2.2 Segmentation Objectives
- 1.2.3 Competitive Intelligence Objectives
- 1.2.4 Forecast & Scenario Objectives
- 1.3 Report Scope
- 1.3.1 Polycystic Ovarian Syndrome Treatment Scope – Types & Subtypes Covered
- 1.3.2 Geographic Scope – Regions & Countries Covered
- 1.3.3 Historical Period, Base Year & Forecast Period (2024; forecast to 2032)
- 1.3.4 Inclusions & Exclusions
- 1.4 HS Code & Classification Framework
- 1.5 Currency, Units & Pricing Basis
- 1.6 Target Stakeholders
- 1.7 Limitations & Assumptions
Chapter 2. Executive Summary
- 2.1 Global Polycystic Ovarian Syndrome Treatment Market Snapshot
- 2.1.1 Market Size – Historical (2024) & Forecast (2024-2032) (2024: USD 4827.6 million → 2032: USD 7953.72 million)
- 2.1.2 Volume & Revenue – Global Totals
- 2.1.3 Key Market Highlights – Top Five Facts
- 2.2 Polycystic Ovarian Syndrome Treatment Market Segmentation Snapshot
- 2.2.1 Market Split by Region – 2024 vs. 2032
- 2.3 Competitive Snapshot
- 2.3.1 Top 10 Players by Revenue Share – 2024
- 2.3.2 Top 10 Players by Volume Share – 2024
- 2.3.3 Recent Strategic Developments (18-Month Summary)
- 2.4 Key Investment Highlights & Strategic Conclusions
Chapter 3. Polycystic Ovarian Syndrome Treatment Market Dynamics & Industry Analysis
- 3.1 Market Overview & Context
- 3.1.1 Polycystic Ovarian Syndrome Treatment Market Position in the Broader Automotive Value Chain
- 3.1.2 OEM vs. Replacement Market Dynamics
- 3.1.3 Market Maturity & Development Stage by Region
- 3.2 Polycystic Ovarian Syndrome Treatment Market Drivers
- 3.3 Polycystic Ovarian Syndrome Treatment Market Restraints & Challenges
- 3.4 Polycystic Ovarian Syndrome Treatment Market Opportunities
- 3.5 Porter's Five Forces Analysis
- 3.5.1 Threat of New Entrants
- 3.5.2 Bargaining Power of Suppliers
- 3.5.3 Bargaining Power of Buyers
- 3.5.4 Threat of Substitutes
- 3.5.5 Competitive Rivalry – Intensity Assessment
- 3.6 Polycystic Ovarian Syndrome Treatment Value Chain Analysis
- 3.6.1 Upstream – Raw Material/Input Suppliers
- 3.6.1.1 Raw Material/Input 1
- 3.6.1.2 Raw Material/Input 2
- 3.6.1.3 Raw Material/Input 3
- 3.6.2 Midstream – Production/Manufacturing/Service Delivery
- 3.6.2.1 Production/Process Overview
- 3.6.2.2 Key Facility Locations & Capacity by Manufacturer
- 3.6.3 Downstream – Distribution & End Consumer
- 3.6.3.1 Primary Channel – B2B/OEM
- 3.6.3.2 Secondary Channels – Dealer, Retail, Online, Direct
- 3.6.4 Value Chain Profitability Analysis
- 3.6.1 Upstream – Raw Material/Input Suppliers
- 3.7 PESTEL Analysis
- 3.7.1 Political Factors
- 3.7.2 Economic Factors
- 3.7.3 Social Factors
- 3.7.4 Technological Factors
- 3.7.5 Environmental Factors
- 3.7.6 Legal Factors
- 3.8 Polycystic Ovarian Syndrome Treatment Supply Chain Analysis
- 3.8.1 Raw Material/Input Supply Risk Assessment
- 3.8.2 Manufacturing Concentration Risk (Geographic Exposure)
- 3.8.3 Trade Disruption Impact Analysis
- 3.9 Regulatory & Policy Landscape
Note: The regulatory and policy landscape section covers regulations based on their applicability to the market, Polycystic Ovarian Syndrome Treatment category, geography, and scope of the study. Only regulatory frameworks with a material impact on operations, compliance, trade, sustainability, or market access are analyzed in detail.
Chapter 4. Key Investment Pockets & Opportunity Analysis
- 4.1 Polycystic Ovarian Syndrome Treatment Market Attractiveness Analysis
- 4.1.1 By Region – Investment Attractiveness Matrix (Volume × CAGR)
- 4.2 Absolute Revenue Growth Opportunity
- 4.2.1 By Region – Absolute USD Growth Through 2032
- 4.3 Incremental Volume Opportunity
- 4.3.1 By Region – Incremental Volume Through 2032
- 4.3.2 Segment – Incremental Volume
- 4.4 Emerging Submarket Opportunity Deep Dive (Subject to Applicability)
- 4.5 Emerging Market Opportunity Scorecards
- 4.5.1 United States
- 4.5.2 Europe
- 4.5.3 Asia
- 4.5.4 Middle East & Africa
Note: Emerging Market Opportunity Scorecards will be included based on relevance and strategic importance. Regions listed are indicative and may vary depending on data availability and market dynamics.
Chapter 5. Polycystic Ovarian Syndrome Treatment Import-Export Analysis & Trade Flows
- 5.1 Global Trade Overview
- 5.1.1 Global Export Value by Country (2024)
- 5.1.2 Global Export Volume by Country (2024)
- 5.1.3 Global Import Value by Country (2024)
- 5.1.4 Global Import Volume by Country (2024)
- 5.1.5 Net Trade Balance by Country (2024)
- 5.2 Export Analysis – Segment
- 5.2.1 Type 1 (HS Code)
- 5.2.2 Type 2 (HS Code)
- 5.2.3 Type 3 (HS Code)
- 5.2.4 Type 4 (HS Code)
- 5.2.5 Type 5 (HS Code)
- 5.3 Import Analysis – Segment
- 5.3.1 Type 1 (HS Code)
- 5.3.2 Type 2 (HS Code)
- 5.3.3 Type 3 (HS Code)
- 5.3.4 Type 4 (HS Code)
- 5.3.5 Type 5 (HS Code)
- 5.4 Average Unit Trade Prices
- 5.4.1 Average Export Price – Segment & Country
- 5.4.2 Average Import Price – Segment & Source Country
- 5.4.3 Price Trends (2024)
- 5.5 Key Trade Route Analysis
- 5.5.1 Trade Route 1
- 5.5.2 Trade Route 2
- 5.5.3 Trade Route 3
- 5.5.4 Trade Route 4
- 5.5.5 Trade Route 5
- 5.6 Trade Policy Impact Assessment
- 5.6.1 US Anti-Dumping & Section 301 Tariffs
- 5.6.2 EU Customs Union Impact
- 5.6.3 Major Free Trade Agreements
- 5.6.4 USMCA Rules of Origin
Note: Trade policy analysis will be included only where relevant to the Polycystic Ovarian Syndrome Treatment market.
Chapter 6. Competitive Landscape & Company Benchmarking
- 6.1 Polycystic Ovarian Syndrome Treatment Market Concentration & Structure
- 6.1.1 Herfindahl-Hirschman Index (HHI) – vs. 2024
- 6.1.2 Tier 1, Tier 2 & Tier 3 Market Structure
- 6.1.3 Global, Regional & Local Player Dynamics
- 6.2 Polycystic Ovarian Syndrome Treatment Market Share Analysis – 2024
- 6.2.1 Global Revenue Share by Company
- 6.2.2 Global Volume Share by Company
- 6.2.3 Regional Revenue Share
- 6.2.4 Market Share Evolution ( vs. 2024)
- 6.2.5 OEM Segment Share by Company
- 6.2.6 Replacement Segment Share by Company
- 6.3 Production/Delivery Capacity & Facility Analysis
- 6.3.1 Global Installed Capacity
- 6.3.2 Capacity Utilization Rates
- 6.3.3 Production/Output Volume
- 6.3.4 Facility Locations & Capacity Map
- 6.3.5 Planned Capacity Additions
- 6.4 Polycystic Ovarian Syndrome Treatment Competitive Benchmarking Matrix
- 6.4.1 Revenue, Volume, CAGR & Profitability Comparison
- 6.4.2 Channel Revenue Mix
- 6.4.3 Geographic Revenue Exposure
- 6.4.4 R&D Intensity
- 6.4.5 Sustainability Maturity
- 6.5 Strategic Developments in Polycystic Ovarian Syndrome Treatment (Last 24 Months)
- 6.5.1 Mergers, Acquisitions & Divestments
- 6.5.2 New Polycystic Ovarian Syndrome Treatment Launches
- 6.5.3 Facility Expansions
- 6.5.4 Strategic Alliances, Joint Ventures & Partnerships
- 6.5.5 Distribution Expansion & Market Entry
- 6.5.6 Sustainability & ESG Initiatives
- 6.6 Competitive Strategy Mapping
- 6.6.1 Leader, Challenger, Follower & Niche Classification
- 6.6.2 Pricing Strategy Comparison
- 6.6.3 Channel Strategy Matrix
Note: Strategic developments are included based on their materiality and the availability of reliable information.
Chapter 7. Global Polycystic Ovarian Syndrome Treatment Market – By Distribution Channel
- 7.1 Segment Overview
- 7.1.1 Volume & Revenue Split by Channel (2024 & 2032)
- 7.1.2 Channel Mix Evolution (2024-2032)
Chapter 8. Regional Market Analysis – Global Overview
- 8.1 Global Regional Overview
- 8.1.1 Regional Volume Share
- 8.1.2 Regional Revenue Share
- 8.1.3 Regional Volume by Region
- 8.1.4 Regional Revenue by Region
- 8.1.5 Regional Forecast Through 2032
- 8.2 Cross-Regional Segment Analysis
- 8.2.1 By Distribution Channel
- 8.2.2 By Brand/Price Tier
Chapter 9. North America Polycystic Ovarian Syndrome Treatment Market
- 9.1 United States
- 9.2 Canada
- 9.3 Mexico
Chapter 10. Europe Polycystic Ovarian Syndrome Treatment Market
- 10.1 Germany
- 10.2 France
- 10.3 Italy
- 10.4 United Kingdom
- 10.5 Spain
- 10.6 Poland
- 10.7 Russia
- 10.8 Netherlands
- 10.9 Belgium
- 10.10 Sweden
- 10.11 Denmark
- 10.12 Norway
- 10.13 Rest of Europe
Chapter 11. Asia Pacific Polycystic Ovarian Syndrome Treatment Market
- 11.1 China
- 11.2 India
- 11.3 Japan
- 11.4 South Korea
- 11.5 Thailand
- 11.6 Indonesia
- 11.7 Vietnam
- 11.8 Malaysia
- 11.9 Australia
- 11.10 Rest of Asia Pacific
Chapter 12. Latin America Polycystic Ovarian Syndrome Treatment Market
- 12.1 Brazil
- 12.2 Argentina
- 12.3 Colombia
- 12.4 Chile
- 12.5 Rest of Latin America
Chapter 13. Middle East Polycystic Ovarian Syndrome Treatment Market
- 13.1 Saudi Arabia
- 13.2 United Arab Emirates
- 13.3 Turkey
- 13.4 Israel
- 13.5 Iran
- 13.6 Rest of the Middle East
Chapter 14. Africa Polycystic Ovarian Syndrome Treatment Market
- 14.1 South Africa
- 14.2 Egypt
- 14.3 Nigeria
- 14.4 Morocco
- 14.5 Rest of Africa
Chapter 15. Polycystic Ovarian Syndrome Treatment Company Profiles
- 15.1 [Company 01]
- 15.1.1 Company Overview
- 15.1.2 Key Management Personnel
- 15.1.3 Products & Services Portfolio
- 15.1.4 Financial Performance
- 15.1.5 Key Market Focus & Geographic Presence
- 15.1.6 Recent Developments & Strategic Initiatives
Note: The company profile list is preliminary and may change based on research findings, market developments, data availability, and client requirements.
Chapter 16. Appendices
- Appendix A – List of Abbreviations & Acronyms
- Appendix B – Industry Classification Code Reference – Full Series
- Appendix C – Production & Capacity Data Tables
- Appendix D – End-Use & Demand Base Tables
- Appendix E – Consumption & Replacement Rate Assumptions
- Appendix F – ASP Reference Tables
- Appendix G – Manufacturing & Facility Database
- Appendix H – Import-Export Data Tables
- Appendix I – Regulatory Summary Tables
- Appendix J – Primary Research Participant List (Anonymized)
- Appendix K – Primary Research Questionnaire Framework
- Appendix L – Data Sources & Bibliography
- Appendix M – Market Size Divergence & Source Comparison
Chapter 17. Research Methodology
- 17.1 Research Framework & Philosophy
- 17.2 Secondary Research – Sources, Hierarchy & Data Extraction
- 17.3 Data Modeling – Bottom-Up & Top-Down Market Sizing
- 17.4 Primary Research – Stakeholder Framework, LOI & Sample Sizes
- 17.5 Forecast Methodology – Regression, Scenario & Sensitivity Analysis
- 17.6 Quality Control – Four-Layer Validation Framework
- 17.7 Limitations & Standard Assumptions
- 17.8 Disclaimer
