
Market Overview
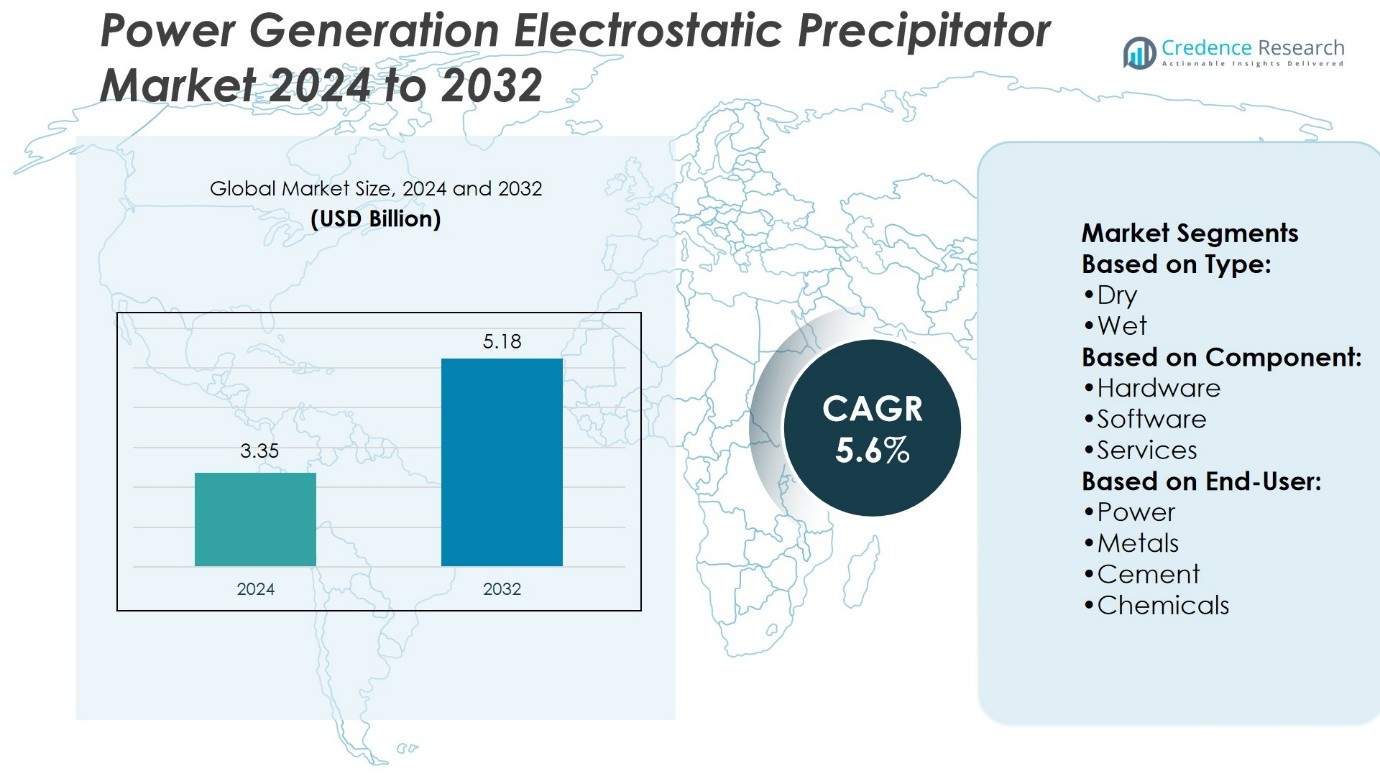
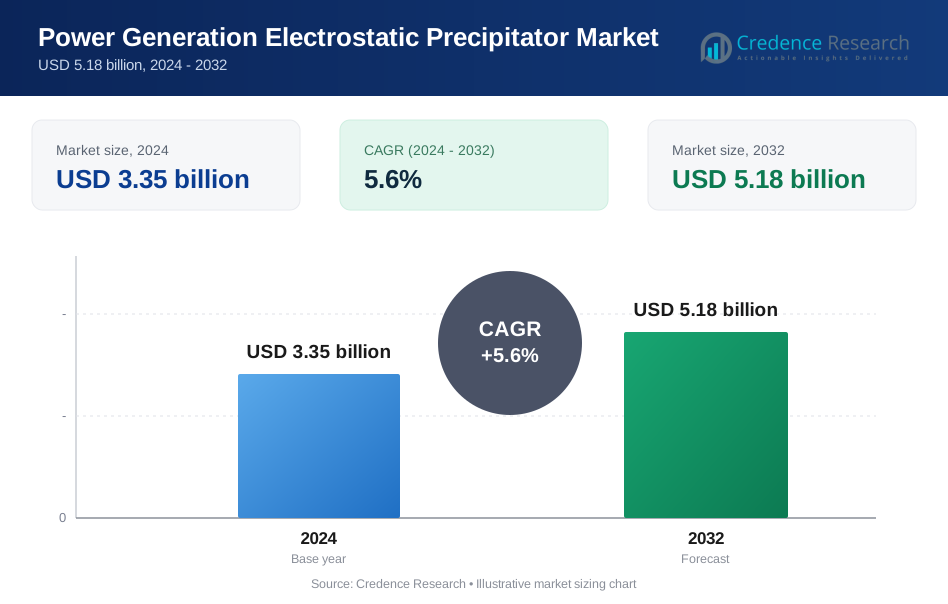
Power Generation Electrostatic Precipitator Market size was valued at USD 3.35 billion in 2024 and is anticipated to reach USD 5.18 billion by 2032, at a CAGR of 5.6% during the forecast period.
| REPORT ATTRIBUTE | DETAILS |
|---|---|
| Historical Period | 2020-2024 |
| Base Year | 2024 |
| Forecast Period | 2025-2032 |
| Power Generation Electrostatic Precipitator Market Size 2024 | USD 3.35 Billion |
| Power Generation Electrostatic Precipitator Market, CAGR | 5.6% |
| Power Generation Electrostatic Precipitator Market Size 2032 | USD 5.18 Billion |
The Power Generation Electrostatic Precipitator Market grows steadily, driven by stricter environmental regulations and rising global energy demand. Governments enforce emission standards that compel utilities to adopt advanced particulate control systems, ensuring compliance and public health protection. It benefits from large-scale retrofitting projects in aging power plants and expanding installations in emerging economies with coal-based generation. Trends highlight the shift toward hybrid technologies that combine electrostatic and fabric filtration for higher efficiency. Digital integration, including real-time monitoring and predictive maintenance, further enhances performance. The market continues to evolve with sustainability goals, promoting energy-efficient and eco-friendly designs.
The Power Generation Electrostatic Precipitator Market shows strong regional variation, with Asia-Pacific leading due to heavy reliance on coal power, followed by steady demand in North America and Europe driven by strict emission norms. Latin America and the Middle East & Africa present emerging opportunities through industrial expansion and modernization projects. Key players strengthen market presence through innovation, retrofitting services, and global networks, with competition shaped by both multinational leaders and regional firms offering cost-effective and localized solutions.
Market Insights
- Power Generation Electrostatic Precipitator Market size was valued at USD 3.35 billion in 2024 and is anticipated to reach USD 5.18 billion by 2032, at a CAGR of 5.6%.
- Stricter environmental regulations and rising energy demand drive consistent adoption across power generation facilities.
- Hybrid systems that combine electrostatic and fabric filtration are gaining momentum for higher efficiency.
- Competition remains strong, with multinational leaders focusing on innovation and regional firms offering cost-effective solutions.
- High capital costs and complex installation requirements act as restraints in price-sensitive markets.
- Asia-Pacific leads the market with heavy reliance on coal-based power, followed by North America and Europe with strong regulatory enforcement.
- Latin America and the Middle East & Africa provide emerging opportunities through industrial expansion and modernization efforts.
Market Drivers
Stringent Environmental Regulations Driving Demand
The Power Generation Electrostatic Precipitator Market grows steadily as governments enforce stricter emission norms for coal-fired and thermal power plants. Regulatory authorities mandate advanced particulate collection technologies to minimize air pollution from power stations. It enables plants to meet compliance requirements while sustaining operations in regulated regions. Industries adopt electrostatic precipitators to ensure lower emissions of fine dust and harmful particulates. Compliance with international environmental frameworks strengthens adoption across developing and developed economies. Regulatory pressure continues to anchor long-term demand.
- For instance, Mitsubishi Hitachi Power Systems developed an advanced dry electrostatic precipitator system capable of reducing particulate matter emissions to below 20 mg/Nm³ at large-scale coal plants exceeding capacity, meeting European Industrial Emissions Directive (IED) standards.
Rising Energy Production and Infrastructure Expansion
Growing global energy needs drive investment in large-scale power generation projects, directly supporting demand for electrostatic precipitators. Expanding industrialization and urbanization require reliable electricity supply, which increases reliance on coal and fossil-based plants. It creates consistent requirements for emission control equipment to safeguard surrounding air quality. Developing countries in Asia-Pacific lead new installations as they expand energy infrastructure to meet rapid consumption growth. Strong electricity demand combined with public health concerns sustains technology deployment. The rising build-out of power plants amplifies market opportunities.
- For instance, KC Cottrell India commissioned a electrostatic precipitator system at the Barh Super Thermal Power Project in Bihar, designed to handle over 3.9 million cubic meters of flue gas per hour while achieving particulate emission levels below 30 mg/Nm³.
Emphasis on Sustainable Operations and Efficiency
Power producers focus on technologies that enhance efficiency while limiting environmental impacts, making electrostatic precipitators essential. It provides reliable dust removal with low pressure drop, ensuring high operational efficiency for power plants. Operators invest in advanced systems that combine superior filtration with energy savings. This dual focus on cost reduction and emission control drives replacement and upgrade demand. Companies integrate automation and digital monitoring to improve performance and reduce downtime. The pursuit of sustainable yet efficient operations reinforces adoption.
Technological Advancements and Retrofitting Initiatives
Rapid innovations in electrostatic precipitator design encourage utilities to upgrade existing systems. The Power Generation Electrostatic Precipitator Market benefits from modular, high-capacity units that address ultra-fine particulates effectively. It supports retrofitting projects in aging power plants, extending equipment life while enhancing emission performance. Manufacturers develop systems with higher collection efficiency and reduced maintenance requirements. Investments in hybrid solutions that integrate bag filters with precipitators also gain traction. Continuous technological progress ensures adaptability to evolving energy landscapes and emission standards.
Market Trends
Increasing Adoption of Hybrid and Advanced Filtration Technologies
The Power Generation Electrostatic Precipitator Market witnesses a steady trend toward hybrid systems that combine electrostatic and fabric filtration. Utilities prefer these solutions for their ability to capture fine particulates with higher efficiency. It addresses limitations of conventional units by ensuring compliance with stringent emission standards. Operators value the adaptability of hybrid precipitators in diverse fuel conditions. Manufacturers focus on integrating advanced filter media with proven electrostatic designs. This trend strengthens market positioning in both retrofit and new installation projects.
- For instance, ANDRITZ GROUP supplied its advanced hybrid ESP–fabric filter system for the 1,320 MW Tanjung Bin Power Plant in Malaysia, achieving particulate matter emissions of less than 20 mg/Nm³ while handling flue gas volume.
Growing Digital Integration and Predictive Maintenance Solutions
The industry advances through digitalization, with plants adopting smart monitoring and predictive maintenance tools. It enables operators to track particulate levels, energy consumption, and equipment performance in real time. Predictive analytics reduces unplanned downtime and extends component life. Utilities benefit from lower operating costs and improved compliance certainty. Software-enabled control systems enhance responsiveness during peak operations. The growing emphasis on digital integration shapes a more data-driven approach in emission management.
- For instance, PPC Industries supplied and installed electrostatic precipitators at the 1,200 MW Mahan Power Plant in Madhya Pradesh, designed to handle 4.5 million cubic meters of flue gas per hour while ensuring particulate matter.
Rising Investments in Retrofitting and Modernization Projects
A strong trend in the market centers on retrofitting aging power plants with upgraded electrostatic precipitators. It extends equipment life while supporting stricter emission compliance. Governments in emerging economies encourage modernization to balance energy supply with environmental protection. Utilities prioritize system upgrades to avoid penalties and reduce environmental risks. Manufacturers introduce modular solutions that allow cost-efficient installation in existing facilities. The rise of retrofitting projects ensures consistent demand for advanced precipitator technologies.
Emphasis on Sustainability and Cleaner Energy Transition
The Power Generation Electrostatic Precipitator Market aligns with global trends toward sustainable energy transition. It plays a vital role in reducing harmful emissions from conventional power generation during the gradual shift to renewables. Utilities adopt systems that minimize ecological impact while maintaining energy security. Investment in cleaner coal technologies supports ongoing demand for efficient precipitators. Manufacturers highlight eco-friendly designs that reduce water and energy consumption. The trend underscores the balance between sustainability goals and the need for stable electricity supply.
Market Challenges Analysis
High Capital Costs and Complex Installation Requirements
The Power Generation Electrostatic Precipitator Market faces significant challenges due to high initial investment and complex installation processes. Electrostatic precipitators require advanced materials, precise engineering, and specialized construction, which raise overall project costs. It limits adoption in smaller or budget-constrained power plants that often opt for lower-cost alternatives. Long installation timelines disrupt plant operations and reduce operational flexibility. Utilities weigh these financial and technical hurdles before committing to large-scale deployment. The high cost factor continues to act as a restraint in markets where funding remains limited.
Competition from Alternative Emission Control Technologies
Growing competition from alternative emission control solutions creates pressure on electrostatic precipitator demand. It includes technologies such as baghouse filters and scrubbers that offer cost-efficient performance under certain conditions. Power producers evaluate these alternatives for easier maintenance and reduced space requirements. Rapid advancements in fabric filtration efficiency challenge the dominance of precipitators in fine particulate collection. Regulatory bodies in some regions encourage adoption of alternatives that better align with local infrastructure. This trend restricts market expansion and forces manufacturers to innovate continuously to remain competitive.
Market Opportunities
Expansion in Emerging Economies and Rising Energy Demand
The Power Generation Electrostatic Precipitator Market holds significant opportunities in rapidly industrializing regions with rising energy needs. Emerging economies continue to depend on coal and thermal power plants, creating steady demand for effective emission control solutions. It enables power producers to meet stricter air quality standards while supporting grid reliability. Governments in Asia-Pacific and parts of Africa invest heavily in electricity generation, which boosts the requirement for advanced precipitators. Strong urbanization trends amplify the pressure on energy infrastructure, further driving equipment adoption. The expansion of power generation capacity in these regions opens long-term opportunities for manufacturers.
Innovation in Green Technologies and Sustainable Solutions
Growing emphasis on sustainability encourages utilities to adopt eco-efficient electrostatic precipitators with advanced designs. The Power Generation Electrostatic Precipitator Market benefits from innovation that reduces water use, optimizes power consumption, and enhances particulate removal efficiency. It creates opportunities for manufacturers to deliver systems that align with global decarbonization targets. Hybrid models that combine fabric filters with precipitators present new growth avenues in markets focused on cleaner operations. Integration of digital monitoring and automation strengthens efficiency while lowering operational costs. Continuous advancements in green technologies ensure that electrostatic precipitators remain relevant in a transitioning energy landscape.
Market Segmentation Analysis:
By Type
The Power Generation Electrostatic Precipitator Market is segmented into dry and wet systems, each serving distinct operational needs. Dry precipitators dominate due to their wide use in coal-fired power plants, offering high collection efficiency for large volumes of flue gas. It is cost-effective, durable, and suitable for plants handling higher particulate loads. Wet precipitators, while smaller in share, gain importance in applications where sticky or fine particulates need removal. They are particularly effective in plants operating with high sulfur fuels and industries sensitive to acid mist. This balance ensures both dry and wet technologies continue to address varied environmental and operational requirements.
- For instance, FLSmidth supplied dry electrostatic precipitators for The Mundra UMPP, located in Gujarat, is a 4,000 MW coal-fired power plant owned by CGPL, a subsidiary of Tata Power.
By Component
The market divides into hardware, software, and services, with hardware representing the largest segment due to its role in building core collection systems. High demand for discharge electrodes, collecting plates, and control devices supports this dominance. Software adoption rises as plants integrate digital monitoring, predictive maintenance, and emission tracking tools. It enhances system performance while reducing operational downtime. Services gain traction with retrofitting, maintenance, and performance optimization contracts from utilities aiming to extend equipment life. The growing combination of hardware strength and software intelligence sets a clear direction for market growth.
- For instance, Hitachi Power Systems, through their Moving Electrode Electrostatic Precipitator (MEEP), supplied an advanced system to Vedanta's Sterlite Aluminum Smelter in Jharsuguda, Odisha. This system was designed to process 2.7 million cubic meters of flue gas per hour, a significant feat that effectively manages emissions.
By End-User
End-user analysis highlights power generation as the primary sector, driven by strict emission norms and ongoing reliance on coal-based energy in many regions. It remains the largest adopter, ensuring consistent demand for electrostatic precipitators across developed and emerging economies. Metals and cement industries also play a crucial role, requiring advanced dust collection to comply with workplace and environmental safety standards. The chemicals sector, though smaller, shows steady demand for systems capable of managing corrosive emissions. Each end-user segment contributes to diversifying applications while reinforcing the technology’s role in industrial air quality management. Together, these industries sustain broad adoption and create new opportunities for specialized solutions.
Segments:
Based on Type:
- Dry
- Wet
Based on Component:
- Hardware
- Software
- Services
Based on End-User:
- Power
- Metals
- Cement
- Chemicals
Based on the Geography:
- North America
- U.S.
- Canada
- Mexico
- Europe
- Germany
- France
- U.K.
- Italy
- Spain
- Rest of Europe
- Asia Pacific
- China
- Japan
- India
- South Korea
- South-east Asia
- Rest of Asia Pacific
- Latin America
- Brazil
- Argentina
- Rest of Latin America
- Middle East & Africa
- GCC Countries
- South Africa
- Rest of the Middle East and Africa
Regional Analysis
North America
North America accounts for around 20% of the global Power Generation Electrostatic Precipitator Market share, driven by stringent air quality regulations and established power generation infrastructure. The region enforces strict environmental norms through the U.S. Environmental Protection Agency (EPA) and Canada’s Clean Air initiatives, pushing utilities to adopt advanced emission control systems. It benefits from consistent retrofitting projects in older coal-fired plants and selective investments in natural gas facilities requiring particulate control. While the U.S. leads installations, Canada contributes with modernization of its power and industrial sectors. The region shows steady growth due to ongoing upgrades and integration of digital monitoring technologies. Although the reliance on renewable energy sources is increasing, the requirement for compliance in existing fossil fuel plants sustains the demand for electrostatic precipitators.
Europe
Europe holds about 18% of the market share, shaped by some of the world’s strictest emission reduction policies. The European Union’s Industrial Emissions Directive (IED) sets rigorous particulate and pollutant standards that drive steady adoption. Germany, the United Kingdom, and France remain strong markets due to a mix of retrofitting projects and sustainable industrial operations. It experiences demand from thermal power plants, cement industries, and heavy manufacturing sectors, all required to comply with evolving environmental frameworks. Utilities prioritize efficiency and sustainability, which fuels interest in hybrid electrostatic precipitators that reduce water and energy use. Eastern European countries also witness rising adoption, supported by cross-border funding programs and industrial modernization. This balance of policy enforcement and industrial activity sustains consistent demand across the region.
Asia-Pacific
Asia-Pacific dominates the market with nearly 45% of the global share, making it the largest and fastest-growing regional segment. The region’s reliance on coal-fired power plants in China, India, and Southeast Asia drives large-scale deployment of electrostatic precipitators. It benefits from massive investments in energy infrastructure to meet surging electricity demand caused by urbanization and industrialization. China remains the leading contributor due to government mandates on emission control and continued use of thermal power. India follows with substantial demand from power generation and cement industries, driven by stricter emission policies. Southeast Asian economies expand installations as they balance industrial growth with public health considerations. The strong dominance of Asia-Pacific reflects its dual challenge of ensuring energy security and controlling pollution.
Latin America
Latin America captures roughly 7% of the market share, influenced by moderate industrialization and selective adoption of coal-based power. Brazil and Mexico lead the region, supported by investments in energy and heavy industries such as cement and chemicals. It faces slower adoption compared to Asia-Pacific or Europe due to relatively lenient regulations in some countries and higher reliance on renewables in the long term. However, stricter local laws in urbanized areas encourage installations in power and industrial plants to curb emissions. Retrofitting projects in older facilities gain traction as governments align with international environmental commitments. Growth remains steady but less aggressive than in other regions, offering niche opportunities for service providers and specialized technology suppliers.
Middle East & Africa
The Middle East & Africa region holds about 10% of the global market share, with growth led by expanding energy and industrial sectors. Oil-rich economies in the Gulf invest in electrostatic precipitators to manage emissions from power plants and petrochemical facilities. It also gains momentum in African nations, where rising electricity demand encourages coal and gas power development. South Africa leads adoption due to its dependence on coal power, while Gulf states prioritize compliance to reduce industrial air pollution. Infrastructure development projects and rising energy consumption sustain demand across both subregions. Although renewables gain traction, fossil fuel-based generation remains central, creating consistent opportunities for electrostatic precipitator deployment.
Key Player Analysis
- KC Cottrell India
- Sumitomo Heavy Industries
- ANDRITZ GROUP
- PPC Industries
- Thermax Group
- Enviropol Engineers
- Isgec Heavy Engineering
- Babcock and Wilcox Enterprises
- Hitachi Power Systems
- FLSmidth
Competitive Analysis
The competitive landscape of the Power Generation Electrostatic Precipitator Market include ANDRITZ GROUP, Babcock and Wilcox Enterprises, Enviropol Engineers, FLSmidth, Hitachi Power Systems, Isgec Heavy Engineering, KC Cottrell India, PPC Industries, Sumitomo Heavy Industries, and Thermax Group. The Power Generation Electrostatic Precipitator Market is highly competitive, with companies focusing on advanced technologies, retrofitting services, and sustainable solutions to strengthen their positions. Global and regional participants compete by offering cost-efficient systems that comply with evolving environmental regulations while ensuring operational efficiency. It creates an environment where innovation in hybrid models, digital monitoring, and predictive maintenance plays a critical role in differentiation. Firms also emphasize after-sales service, modular designs, and localized manufacturing to enhance customer value. The competition extends across developed and emerging markets, with demand driven by stricter emission controls and rising electricity consumption. Continuous investment in research and strategic partnerships shapes the long-term outlook of the industry.
Recent Developments
- In February 2025, FLSmidth expanded its network of service centers with a new center in Saudi Arabia's Dammam to meet advanced emission control technologies such as electrostatic precipitators. The expansion aims to increase customer proximity and meet the region's more stringent environmental regulations.
- In February 2024, Valmet shipped electrostatic precipitators to Nordic Paper's Swedish Backhammar recovery boiler, moving towards completion by the end of 2025. The project is one of the steps toward Nordic Paper's drive for competitiveness and sustainability in its Bäckhammar mill, which is mainly focused on unbleached kraft papers produced for packaging.
- In February 2024, Hon'ble Prime Minister Shri Narendra Modi today dedicated NTPC Darlipali Thermal Power Station and the NSPCL Rourkela PP-II Expansion Project. He also laid the foundation for the Stage-III NTPC Talcher Thermal Power Project, which will feature advanced environmental technologies such as efficient electrostatic precipitators, biomass co-firing, flue gas desulphurization, and covered coal storage. These upgrades are designed to reduce coal consumption and lower CO2 emissions.
- In March 2023, ISGEC Heavy Engineering Ltd won a USD 23 million contract with the Maharashtra State Power Generation Company Ltd for upgrading and refurbishing the ESPs for the 2×500 MW Chandrapur thermal power station in Maharashtra.
Market Concentration & Characteristics
The Power Generation Electrostatic Precipitator Market demonstrates a moderately concentrated structure, with a mix of global leaders and strong regional players competing for market share. Large multinational companies dominate high-value projects through advanced technologies, extensive service portfolios, and strong global networks, while regional firms capture opportunities with cost-effective solutions and localized expertise. It is characterized by high entry barriers due to capital-intensive requirements, complex engineering standards, and strict regulatory compliance. Demand is driven by emission control mandates, retrofitting initiatives, and the need for efficient particulate removal in coal and thermal power plants. The market reflects steady growth opportunities, but competition intensifies through innovation in hybrid models, digital integration, and energy-efficient designs. It continues to evolve with sustainability pressures, forcing companies to balance performance, compliance, and affordability across both developed and emerging economies.
Report Coverage
The research report offers an in-depth analysis based on Type, Component, End-User and Geography. It details leading market players, providing an overview of their business, product offerings, investments, revenue streams, and key applications. Additionally, the report includes insights into the competitive environment, SWOT analysis, current market trends, as well as the primary drivers and constraints. Furthermore, it discusses various factors that have driven market expansion in recent years. The report also explores market dynamics, regulatory scenarios, and technological advancements that are shaping the industry. It assesses the impact of external factors and global economic changes on market growth. Lastly, it provides strategic recommendations for new entrants and established companies to navigate the complexities of the market.
Future Outlook
- The market will expand steadily due to ongoing demand for emission control in coal and thermal power plants.
- Stricter environmental regulations will continue to drive adoption across developed and emerging regions.
- Retrofitting of aging plants will create sustained opportunities for advanced precipitator technologies.
- Hybrid systems combining electrostatic and fabric filtration will gain stronger acceptance.
- Digital monitoring and predictive maintenance tools will become standard in new installations.
- Manufacturers will focus on energy-efficient and eco-friendly designs to align with sustainability goals.
- Asia-Pacific will remain the dominant region due to rapid industrialization and high coal dependency.
- Service-based revenue from maintenance and performance optimization will grow consistently.
- Competition will intensify with innovation in modular designs and localized manufacturing.
- The market will retain long-term relevance even as renewable energy adoption rises gradually.
Request a Free Sample
Fill in your details and we'll send you a free sample report.
- Sample data tables & charts
- Research methodology
Need a Custom Version of This Report?
Tailor the scope, geography, or segments to your exact requirements.
- Custom geography or segment scope
- Direct access to our analyst team
Frequently Asked Questions
What is the current market size for Power Generation Electrostatic Precipitator Market, and what is its projected size in 2032?
At what Compound Annual Growth Rate is the Power Generation Electrostatic Precipitator Market projected to grow between 2025 and 2032?
Which Power Generation Electrostatic Precipitator Market segment held the largest share in 2024?
What are the primary factors fueling the growth of the Power Generation Electrostatic Precipitator Market?
Who are the leading companies in the Power Generation Electrostatic Precipitator Market?
Which region commanded the largest share of the Power Generation Electrostatic Precipitator Market in 2024?
Table of Content
Chapter 1. Report Introduction
- 1.1 Report Description & Purpose
- 1.1.1 Report Title & Market Definition
- 1.1.2 Unique Selling Propositions (USP) & Key Differentiators
- 1.1.3 Value Proposition for Stakeholders
- 1.2 Research Objectives
- 1.2.1 Market Sizing Objectives (Volume & Revenue)
- 1.2.2 Segmentation Objectives
- 1.2.3 Competitive Intelligence Objectives
- 1.2.4 Forecast & Scenario Objectives
- 1.3 Report Scope
- 1.3.1 Power Generation Electrostatic Precipitator Scope – Types & Subtypes Covered
- 1.3.2 Geographic Scope – Regions & Countries Covered
- 1.3.3 Historical Period, Base Year & Forecast Period (2024; forecast to 2032)
- 1.3.4 Inclusions & Exclusions
- 1.4 HS Code & Classification Framework
- 1.5 Currency, Units & Pricing Basis
- 1.6 Target Stakeholders
- 1.7 Limitations & Assumptions
Chapter 2. Executive Summary
- 2.1 Global Power Generation Electrostatic Precipitator Market Snapshot
- 2.1.1 Market Size – Historical (2024) & Forecast (2024-2032) (2024: USD 3.35 billion → 2032: USD 5.18 billion)
- 2.1.2 Volume & Revenue – Global Totals
- 2.1.3 Key Market Highlights – Top Five Facts
- 2.2 Power Generation Electrostatic Precipitator Market Segmentation Snapshot
- 2.2.1 Market Split by Region – 2024 vs. 2032
- 2.3 Competitive Snapshot
- 2.3.1 Top 10 Players by Revenue Share – 2024
- 2.3.2 Top 10 Players by Volume Share – 2024
- 2.3.3 Recent Strategic Developments (18-Month Summary)
- 2.4 Key Investment Highlights & Strategic Conclusions
Chapter 3. Power Generation Electrostatic Precipitator Market Dynamics & Industry Analysis
- 3.1 Market Overview & Context
- 3.1.1 Power Generation Electrostatic Precipitator Market Position in the Broader Automotive Value Chain
- 3.1.2 OEM vs. Replacement Market Dynamics
- 3.1.3 Market Maturity & Development Stage by Region
- 3.2 Power Generation Electrostatic Precipitator Market Drivers
- 3.3 Power Generation Electrostatic Precipitator Market Restraints & Challenges
- 3.4 Power Generation Electrostatic Precipitator Market Opportunities
- 3.5 Porter's Five Forces Analysis
- 3.5.1 Threat of New Entrants
- 3.5.2 Bargaining Power of Suppliers
- 3.5.3 Bargaining Power of Buyers
- 3.5.4 Threat of Substitutes
- 3.5.5 Competitive Rivalry – Intensity Assessment
- 3.6 Power Generation Electrostatic Precipitator Value Chain Analysis
- 3.6.1 Upstream – Raw Material/Input Suppliers
- 3.6.1.1 Raw Material/Input 1
- 3.6.1.2 Raw Material/Input 2
- 3.6.1.3 Raw Material/Input 3
- 3.6.2 Midstream – Production/Manufacturing/Service Delivery
- 3.6.2.1 Production/Process Overview
- 3.6.2.2 Key Facility Locations & Capacity by Manufacturer
- 3.6.3 Downstream – Distribution & End Consumer
- 3.6.3.1 Primary Channel – B2B/OEM
- 3.6.3.2 Secondary Channels – Dealer, Retail, Online, Direct
- 3.6.4 Value Chain Profitability Analysis
- 3.6.1 Upstream – Raw Material/Input Suppliers
- 3.7 PESTEL Analysis
- 3.7.1 Political Factors
- 3.7.2 Economic Factors
- 3.7.3 Social Factors
- 3.7.4 Technological Factors
- 3.7.5 Environmental Factors
- 3.7.6 Legal Factors
- 3.8 Power Generation Electrostatic Precipitator Supply Chain Analysis
- 3.8.1 Raw Material/Input Supply Risk Assessment
- 3.8.2 Manufacturing Concentration Risk (Geographic Exposure)
- 3.8.3 Trade Disruption Impact Analysis
- 3.9 Regulatory & Policy Landscape
Note: The regulatory and policy landscape section covers regulations based on their applicability to the market, Power Generation Electrostatic Precipitator category, geography, and scope of the study. Only regulatory frameworks with a material impact on operations, compliance, trade, sustainability, or market access are analyzed in detail.
Chapter 4. Key Investment Pockets & Opportunity Analysis
- 4.1 Power Generation Electrostatic Precipitator Market Attractiveness Analysis
- 4.1.1 By Region – Investment Attractiveness Matrix (Volume × CAGR)
- 4.2 Absolute Revenue Growth Opportunity
- 4.2.1 By Region – Absolute USD Growth Through 2032
- 4.3 Incremental Volume Opportunity
- 4.3.1 By Region – Incremental Volume Through 2032
- 4.3.2 Segment – Incremental Volume
- 4.4 Emerging Submarket Opportunity Deep Dive (Subject to Applicability)
- 4.5 Emerging Market Opportunity Scorecards
- 4.5.1 United States
- 4.5.2 Europe
- 4.5.3 Asia
- 4.5.4 Middle East & Africa
Note: Emerging Market Opportunity Scorecards will be included based on relevance and strategic importance. Regions listed are indicative and may vary depending on data availability and market dynamics.
Chapter 5. Power Generation Electrostatic Precipitator Import-Export Analysis & Trade Flows
- 5.1 Global Trade Overview
- 5.1.1 Global Export Value by Country (2024)
- 5.1.2 Global Export Volume by Country (2024)
- 5.1.3 Global Import Value by Country (2024)
- 5.1.4 Global Import Volume by Country (2024)
- 5.1.5 Net Trade Balance by Country (2024)
- 5.2 Export Analysis – Segment
- 5.2.1 Type 1 (HS Code)
- 5.2.2 Type 2 (HS Code)
- 5.2.3 Type 3 (HS Code)
- 5.2.4 Type 4 (HS Code)
- 5.2.5 Type 5 (HS Code)
- 5.3 Import Analysis – Segment
- 5.3.1 Type 1 (HS Code)
- 5.3.2 Type 2 (HS Code)
- 5.3.3 Type 3 (HS Code)
- 5.3.4 Type 4 (HS Code)
- 5.3.5 Type 5 (HS Code)
- 5.4 Average Unit Trade Prices
- 5.4.1 Average Export Price – Segment & Country
- 5.4.2 Average Import Price – Segment & Source Country
- 5.4.3 Price Trends (2024)
- 5.5 Key Trade Route Analysis
- 5.5.1 Trade Route 1
- 5.5.2 Trade Route 2
- 5.5.3 Trade Route 3
- 5.5.4 Trade Route 4
- 5.5.5 Trade Route 5
- 5.6 Trade Policy Impact Assessment
- 5.6.1 US Anti-Dumping & Section 301 Tariffs
- 5.6.2 EU Customs Union Impact
- 5.6.3 Major Free Trade Agreements
- 5.6.4 USMCA Rules of Origin
Note: Trade policy analysis will be included only where relevant to the Power Generation Electrostatic Precipitator market.
Chapter 6. Competitive Landscape & Company Benchmarking
- 6.1 Power Generation Electrostatic Precipitator Market Concentration & Structure
- 6.1.1 Herfindahl-Hirschman Index (HHI) – vs. 2024
- 6.1.2 Tier 1, Tier 2 & Tier 3 Market Structure
- 6.1.3 Global, Regional & Local Player Dynamics
- 6.2 Power Generation Electrostatic Precipitator Market Share Analysis – 2024
- 6.2.1 Global Revenue Share by Company
- 6.2.2 Global Volume Share by Company
- 6.2.3 Regional Revenue Share
- 6.2.4 Market Share Evolution ( vs. 2024)
- 6.2.5 OEM Segment Share by Company
- 6.2.6 Replacement Segment Share by Company
- 6.3 Production/Delivery Capacity & Facility Analysis
- 6.3.1 Global Installed Capacity
- 6.3.2 Capacity Utilization Rates
- 6.3.3 Production/Output Volume
- 6.3.4 Facility Locations & Capacity Map
- 6.3.5 Planned Capacity Additions
- 6.4 Power Generation Electrostatic Precipitator Competitive Benchmarking Matrix
- 6.4.1 Revenue, Volume, CAGR & Profitability Comparison
- 6.4.2 Channel Revenue Mix
- 6.4.3 Geographic Revenue Exposure
- 6.4.4 R&D Intensity
- 6.4.5 Sustainability Maturity
- 6.5 Strategic Developments in Power Generation Electrostatic Precipitator (Last 24 Months)
- 6.5.1 Mergers, Acquisitions & Divestments
- 6.5.2 New Power Generation Electrostatic Precipitator Launches
- 6.5.3 Facility Expansions
- 6.5.4 Strategic Alliances, Joint Ventures & Partnerships
- 6.5.5 Distribution Expansion & Market Entry
- 6.5.6 Sustainability & ESG Initiatives
- 6.6 Competitive Strategy Mapping
- 6.6.1 Leader, Challenger, Follower & Niche Classification
- 6.6.2 Pricing Strategy Comparison
- 6.6.3 Channel Strategy Matrix
Note: Strategic developments are included based on their materiality and the availability of reliable information.
Chapter 7. Global Power Generation Electrostatic Precipitator Market – By Distribution Channel
- 7.1 Segment Overview
- 7.1.1 Volume & Revenue Split by Channel (2024 & 2032)
- 7.1.2 Channel Mix Evolution (2024-2032)
Chapter 8. Regional Market Analysis – Global Overview
- 8.1 Global Regional Overview
- 8.1.1 Regional Volume Share
- 8.1.2 Regional Revenue Share
- 8.1.3 Regional Volume by Region
- 8.1.4 Regional Revenue by Region
- 8.1.5 Regional Forecast Through 2032
- 8.2 Cross-Regional Segment Analysis
- 8.2.1 By Distribution Channel
- 8.2.2 By Brand/Price Tier
Chapter 9. North America Power Generation Electrostatic Precipitator Market
- 9.1 United States
- 9.2 Canada
- 9.3 Mexico
Chapter 10. Europe Power Generation Electrostatic Precipitator Market
- 10.1 Germany
- 10.2 France
- 10.3 Italy
- 10.4 United Kingdom
- 10.5 Spain
- 10.6 Poland
- 10.7 Russia
- 10.8 Netherlands
- 10.9 Belgium
- 10.10 Sweden
- 10.11 Denmark
- 10.12 Norway
- 10.13 Rest of Europe
Chapter 11. Asia Pacific Power Generation Electrostatic Precipitator Market
- 11.1 China
- 11.2 India
- 11.3 Japan
- 11.4 South Korea
- 11.5 Thailand
- 11.6 Indonesia
- 11.7 Vietnam
- 11.8 Malaysia
- 11.9 Australia
- 11.10 Rest of Asia Pacific
Chapter 12. Latin America Power Generation Electrostatic Precipitator Market
- 12.1 Brazil
- 12.2 Argentina
- 12.3 Colombia
- 12.4 Chile
- 12.5 Rest of Latin America
Chapter 13. Middle East Power Generation Electrostatic Precipitator Market
- 13.1 Saudi Arabia
- 13.2 United Arab Emirates
- 13.3 Turkey
- 13.4 Israel
- 13.5 Iran
- 13.6 Rest of the Middle East
Chapter 14. Africa Power Generation Electrostatic Precipitator Market
- 14.1 South Africa
- 14.2 Egypt
- 14.3 Nigeria
- 14.4 Morocco
- 14.5 Rest of Africa
Chapter 15. Power Generation Electrostatic Precipitator Company Profiles
- 15.1 [Company 01]
- 15.1.1 Company Overview
- 15.1.2 Key Management Personnel
- 15.1.3 Products & Services Portfolio
- 15.1.4 Financial Performance
- 15.1.5 Key Market Focus & Geographic Presence
- 15.1.6 Recent Developments & Strategic Initiatives
Note: The company profile list is preliminary and may change based on research findings, market developments, data availability, and client requirements.
Chapter 16. Appendices
- Appendix A – List of Abbreviations & Acronyms
- Appendix B – Industry Classification Code Reference – Full Series
- Appendix C – Production & Capacity Data Tables
- Appendix D – End-Use & Demand Base Tables
- Appendix E – Consumption & Replacement Rate Assumptions
- Appendix F – ASP Reference Tables
- Appendix G – Manufacturing & Facility Database
- Appendix H – Import-Export Data Tables
- Appendix I – Regulatory Summary Tables
- Appendix J – Primary Research Participant List (Anonymized)
- Appendix K – Primary Research Questionnaire Framework
- Appendix L – Data Sources & Bibliography
- Appendix M – Market Size Divergence & Source Comparison
Chapter 17. Research Methodology
- 17.1 Research Framework & Philosophy
- 17.2 Secondary Research – Sources, Hierarchy & Data Extraction
- 17.3 Data Modeling – Bottom-Up & Top-Down Market Sizing
- 17.4 Primary Research – Stakeholder Framework, LOI & Sample Sizes
- 17.5 Forecast Methodology – Regression, Scenario & Sensitivity Analysis
- 17.6 Quality Control – Four-Layer Validation Framework
- 17.7 Limitations & Standard Assumptions
- 17.8 Disclaimer
