Market Overview
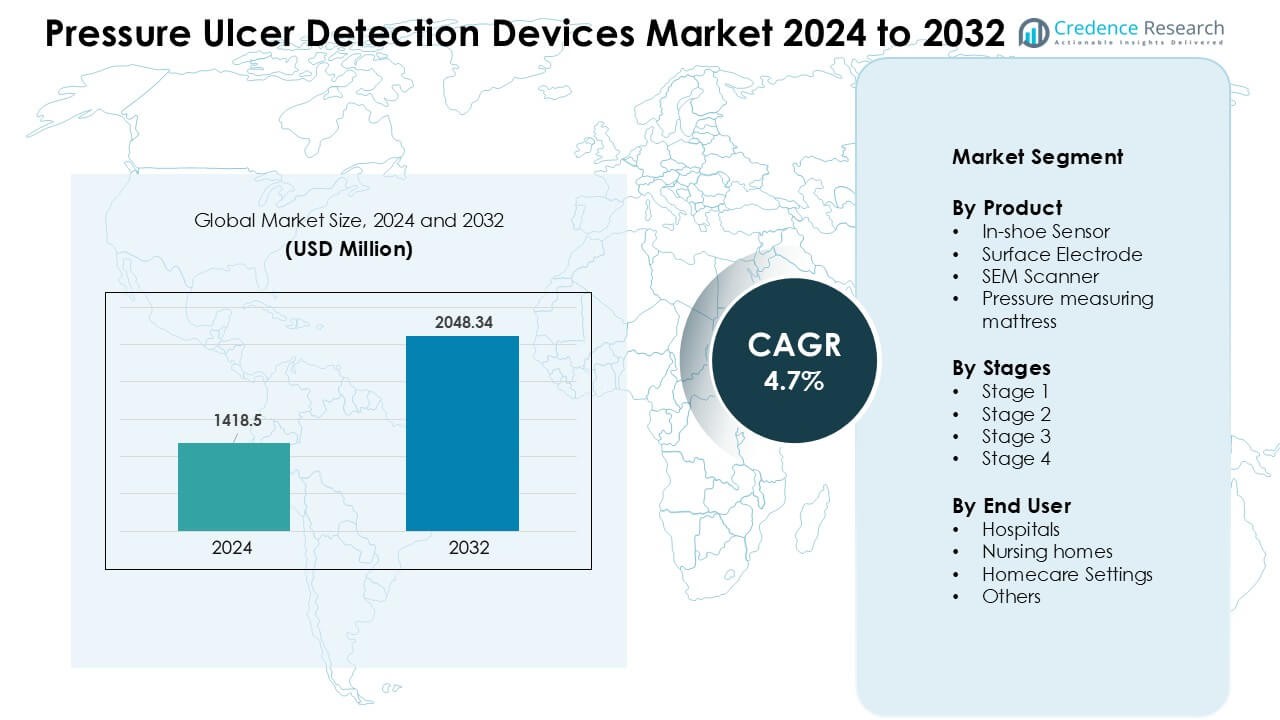
Pressure Ulcer Detection Devices Market was valued at USD 1418.5 million in 2024 and is anticipated to reach USD 2048.34 million by 2032, growing at a CAGR of 4.7 % during the forecast period.
| REPORT ATTRIBUTE |
DETAILS |
| Historical Period |
2020-2023 |
| Base Year |
2024 |
| Forecast Period |
2025-2032 |
| Pressure Ulcer Detection Devices Market Size 2024 |
USD 1418.5 Million |
| Pressure Ulcer Detection Devices Market, CAGR |
4.7 % |
| Pressure Ulcer Detection Devices Market Size 2032 |
USD 2048.34 Million |
The Pressure Ulcer Detection Devices Market is shaped by leading companies such as GE Healthcare, Hill Rom Holdings Inc., Coloplast Group, Pall Hartmann AG, Stryker Corp., 3M Company, Zoll Medical Corporation, Smith and Nephew plc, Cardinal Health, and Medtronic plc. These players compete through advanced pressure-mapping systems, SEM scanners, smart mattresses, and connected monitoring platforms that support early detection and preventive care. Product reliability, digital integration, and strong clinical validation help strengthen their market positions. North America leads the global market with a 38% share in 2024, supported by advanced healthcare infrastructure, strict patient-safety standards, and rapid adoption of digital pressure-monitoring technologies.
Access crucial information at unmatched prices!
Request your sample report today & start making informed decisions powered by Credence Research Inc.!
Download Sample
Market Insights
- The Pressure Ulcer Detection Devices Market was valued at USD 1418.5 million in 2024 and is projected to reach USD 2048.34 million by 2032, growing at a CAGR of 4.7%.
- Growth is driven by rising pressure-ulcer cases, higher elderly populations, and wider use of SEM scanners and pressure-mapping systems, especially in high-risk hospital units.
- Key trends include rapid adoption of AI-enabled monitoring, smart mattresses, and real-time tissue-assessment tools, with in-shoe sensors holding the largest share at 36%.
- Competition remains strong as GE Healthcare, Stryker, 3M, Hill Rom, Coloplast, and Medtronic expand portfolios through digital integration and clinical-validation programs to improve early detection accuracy.
- North America leads the global market with 38% share in 2024, followed by Europe at 29%, while hospitals remain the top end-user segment with 49% due to strict reporting standards and higher adoption of preventive monitoring systems.
 Market Segmentation Analysis:
By Product
In-shoe sensors held the dominant share of about 36% in 2024. These sensors gained strong use because they provide continuous pressure mapping and early warning data for high-risk patients. Healthcare teams prefer in-shoe systems due to real-time alerts, simple setup, and strong accuracy during movement. SEM scanners and pressure-measuring mattresses also grew as hospitals focused on early tissue damage detection and pressure redistribution. Surface electrodes saw steady use in specialized clinical units that monitor localized pressure points.
- For instance, Tekscan’s F-Scan In-Shoe Pressure Mapping System provides real-time plantar pressure measurements at 100 Hz, enabling continuous monitoring and early detection of high-risk areas in diabetic and immobile patients.
By Stages
Stage 2 pressure ulcer detection dominated the market with nearly 42% share in 2024. Hospitals and nursing homes invest heavily in tools that help detect Stage 2 ulcers because early identification reduces treatment cost and avoids progression to severe wounds. Demand grew with rising awareness programs, digital assessment tools, and strict clinical guidelines. Stage 1 detection tools gained traction due to preventive care programs, while Stage 3 and Stage 4 devices saw use in advanced wound care centers managing complex cases.
- For instance, Electrical and electrochemical methods for detecting wound biomarkers are a subject of academic and biomedical research.
By End User
Hospitals led the market with about 49% share in 2024. Hospital units adopted more advanced scanners, smart mattresses, and sensor systems due to rising patient loads and strict pressure injury reporting standards. Strong demand came from ICU, orthopedics, and post-operative units where immobility raises ulcer risk. Nursing homes increased adoption as facilities worked to lower pressure injury rates under regulatory pressure. Homecare settings expanded as more elderly patients used portable sensors for remote monitoring and early risk detection.
Key Growth Drivers
Rising Burden of Pressure Ulcers
Global pressure ulcer cases continue to rise due to aging populations, higher chronic disease rates, and longer hospital stays. Many patients with mobility limits face greater risk, which increases demand for early-detection tools. Hospitals adopt smart sensors, scanners, and digital risk-assessment systems to reduce ulcer progression and meet strict clinical standards. Nursing homes also expand use of detection devices as regulators track pressure injury performance more closely. Homecare users add further demand as families seek simple tools to prevent complications. This wide rise in incidence strengthens the need for continuous monitoring technologies across care settings.
- For instance, in a real-world audit across 15 care sites involving 1,478 patients, use of a sub-epidermal moisture (SEM) Scanner corresponded with an 87.2% reduction in mean hospital-acquired pressure ulcer (HAPU) incidence specifically in the acute care settings.
Shift Toward Early Diagnosis and Prevention
Healthcare systems focus on early prevention rather than late-stage treatment because early detection reduces recovery time, cost, and mortality risk. Many facilities integrate SEM scanners, in-shoe sensors, and smart mattresses to detect tissue stress before visible skin damage appears. Clinical teams value real-time data that supports fast interventions, especially for high-risk patients in ICUs and post-operative wards. Preventive programs drive strong device adoption as hospitals link early detection to lower readmission rates. Digital alerts, trend tracking, and bedside analytics improve care quality and support evidence-based practice. This shift raises consistent demand for predictive pressure-monitoring tools.
- For instance, a machine-learning algorithm built on six consecutive days of daily SEM measurements in 173 patients predicted “heel deep‑tissue injury” events for the next day with 77% sensitivity and 80% specificity offering actionable lead time for preventive interventions.
Integration of Smart Technologies and Digital Workflows
Advanced sensors, wireless connectivity, and cloud-linked platforms shape modern ulcer detection systems. Device makers offer automated pressure mapping, AI-based risk scoring, and continuous monitoring features that help nurses act faster. Many hospitals add these tools to electronic health records for smoother documentation and compliance. Mobile dashboards improve visibility across patient units and support rapid task coordination. Remote monitoring expands as homecare devices transmit alerts to caregivers. This digital shift improves accuracy and reduces manual assessment errors, which encourages faster adoption. Smart technologies help facilities meet quality targets and reduce overall treatment burden.
Key Trends & Opportunities
Expansion of Contactless and Non-Invasive Tools
The market sees fast interest in non-invasive scanners and contactless imaging systems. These tools reduce patient discomfort and support safer monitoring for those with fragile skin. Many hospitals prefer contactless options because they lower infection risk and offer consistent readings across care teams. New sensors also provide faster assessments that reduce staff workload. This trend supports wider adoption in busy wards, emergency units, and long-term care centers.
- For instance, a study using photoacoustic imaging demonstrated a 4.4‑fold increase in detected signal intensity for early (Stage I) tissue damage compared to baseline (no pressure), even before visible ulceration appears and was able to quantify wound depth from about 0.38 mm (Stage I) up to around 2.7 mm (Stage IV) in a lab model.
Growth of Home-Based and Remote Monitoring Solutions
Homecare tools gain traction as more elderly patients remain in home environments. Portable sensors, mobile apps, and remote dashboards allow families and clinicians to track pressure changes in real time. Rising demand for telehealth support drives device makers to offer simple, low-maintenance systems. This trend strengthens adoption outside hospitals and brings steady long-term growth.
Key Challenges
High Cost of Advanced Detection Systems
Many advanced monitoring tools require sizable upfront spending on equipment, software, and training. Smaller hospitals and nursing homes often delay adoption due to budget limits. Maintenance needs, subscription fees, and replacement parts add extra cost pressure. These financial barriers slow penetration in low-resource settings and reduce large-scale deployment. Cost concerns remain a key challenge for widespread adoption.
Shortage of Skilled Clinical Staff
Effective ulcer detection relies on trained teams who can interpret sensor data and act quickly. Many facilities face nursing shortages, which makes consistent monitoring harder. Limited training time and staff fatigue increase the risk of missed assessments. High turnover in nursing homes also affects device use quality. This shortage limits the full benefits of advanced detection systems and slows workflow integration.
Regional Analysis
North America
North America led the Pressure Ulcer Detection Devices Market with about 38% share in 2024. Strong adoption came from advanced hospitals, strict clinical rules, and high spending on patient-monitoring tools. Many providers use SEM scanners, smart mattresses, and sensor systems to cut ulcer rates. The U.S. drives most demand due to large elderly groups and higher chronic illness cases. Canada follows with steady investment in preventive care. Growth remains strong as providers focus on early detection and digital workflows.
Europe
Europe held nearly 29% share in 2024. Countries such as Germany, the U.K., and France support wide use of real-time pressure monitoring because hospitals face strict quality standards. Many facilities deploy risk-assessment tools to cut Stage 2 and Stage 3 ulcers. Nursing homes also expand adoption due to growing elderly populations. EU safety rules push providers toward early prevention devices. Digital integration and training programs support continued expansion across major healthcare systems.
Asia Pacific
Asia Pacific accounted for about 23% share in 2024 and showed the fastest rise. Demand grows as Japan, China, and South Korea see larger elderly groups and longer hospital stays. Many hospitals invest in pressure-mapping systems, scanners, and smart beds to reduce care burden. Rising awareness of early detection boosts adoption in both urban and private facilities. Governments also support patient-safety programs, which strengthens market growth. Homecare users add further demand due to increasing chronic illness cases.
Latin America
Latin America captured roughly 6% share in 2024. Brazil and Mexico lead adoption as hospitals modernize patient-monitoring systems. Growth comes from wider training programs, rising chronic disease rates, and more pressure injury reporting. Many public hospitals still face funding limits, which slows high-end device use. Private facilities adopt scanners and smart mattresses faster due to better resources. Awareness campaigns help expand early detection practices across long-term care centers.
Middle East & Africa
The Middle East & Africa region held about 4% share in 2024. Gulf countries such as the UAE and Saudi Arabia invest in advanced hospital infrastructure and digital detection tools. Many hospitals focus on reducing pressure injuries in surgical and intensive units. Africa sees slow adoption due to budget limits and limited staff training. International health programs support preventive care efforts in select markets. Growth improves as private hospitals adopt portable sensors and mattress-based monitoring systems.
Market Segmentations:
By Product
- In-shoe Sensor
- Surface Electrode
- SEM Scanner
- Pressure measuring mattress
By Stages
- Stage 1
- Stage 2
- Stage 3
- Stage 4
By End User
- Hospitals
- Nursing homes
- Homecare Settings
- Others
By Geography
- North America
- Europe
- Germany
- France
- U.K.
- Italy
- Spain
- Rest of Europe
- Asia Pacific
- China
- Japan
- India
- South Korea
- South-east Asia
- Rest of Asia Pacific
- Latin America
- Brazil
- Argentina
- Rest of Latin America
- Middle East & Africa
- GCC Countries
- South Africa
- Rest of the Middle East and Africa
Competitive Landscape
The Pressure Ulcer Detection Devices Market features strong competition led by major companies such as GE Healthcare, Hill Rom Holdings Inc., Coloplast Group, Pall Hartmann AG, Stryker Corp., 3M Company, Zoll Medical Corporation, Smith and Nephew plc, Cardinal Health, and Medtronic plc. These firms focus on advanced sensors, SEM scanners, pressure-mapping mattresses, and connected monitoring platforms that support early detection and continuous risk assessment. Many players expand portfolios through AI-enabled analytics, wireless connectivity, and integration with hospital information systems. Partnerships with hospitals and long-term care centers help firms improve adoption and validate clinical outcomes. Companies also invest in training programs to support device accuracy and reduce manual assessment errors. Regulatory approvals, product reliability, and digital workflow compatibility influence market leadership. Competitive activity remains high as firms work to improve patient safety performance and meet rising global demand for preventive pressure injury solutions.
Key Player Analysis
- GE Healthcare
- Hill Rom Holdings Inc.
- Coloplast Group
- Pall Hartmann AG
- Stryker Corp.
- 3M Company
- Zoll Medical Corporation
- Smith and Nephew plc
- Cardinal Health
- Medtronic plc
Recent Developments
- In October 2025, PAUL HARTMANN / HARTMANN group hosted the LINK for Wound Healing Congress (Berlin, 23–24 Oct 2025) a major wound-care conference addressing early intervention, wound balance and new approaches (relevant industry event where sensors/diagnostics for pressure injuries are discussed and showcased). HARTMANN continues to publish wound-care and prevention innovations and runs the LINK educational platform.
- In October 2025, GE HealthCare published research describing an AI “Pressure Forecast” model (time-series / neural-network forecasting) aimed at predicting pressure-related risks in hospital settings (up to 72 hours ahead) part of GE’s applied-AI work to predict clinical “pressure” points across hospital systems.
- In October 2024, Coloplast Launched Biatain® Superabsorber in Europe (Oct 2024) and the group also lists Biatain® Silicone Fit as launched in the US in 2024 (advanced wound-dressing portfolio targeted at pressure-injury prevention / management). Coloplast’s 2025 reporting also notes an investigational device under development with an anticipated PMA/FDA submission in the 2025/26 timeframe. These product launches and pipeline activity relate directly to pressure-injury prevention/management.
Shape Your Report to Specific Countries or Regions & Enjoy 30% Off!
Report Coverage
The research report offers an in-depth analysis based on Product, Stages, End-User and Geography. It details leading market players, providing an overview of their business, product offerings, investments, revenue streams, and key applications. Additionally, the report includes insights into the competitive environment, SWOT analysis, current market trends, as well as the primary drivers and constraints. Furthermore, it discusses various factors that have driven market expansion in recent years. The report also explores market dynamics, regulatory scenarios, and technological advancements that are shaping the industry. It assesses the impact of external factors and global economic changes on market growth. Lastly, it provides strategic recommendations for new entrants and established companies to navigate the complexities of the market.
Future Outlook
- Demand will rise as hospitals expand early-detection programs for high-risk patients.
- AI-based pressure-mapping and predictive tools will gain wider integration in clinical workflows.
- Smart mattresses and wearable sensors will become standard in advanced care units.
- Homecare adoption will grow due to rising elderly populations and remote-monitoring needs.
- Contactless and non-invasive scanners will see strong uptake for safer and faster assessment.
- Digital platforms will link detection devices with electronic health records for smoother reporting.
- Training programs will expand as facilities work to improve staff skill and accuracy.
- Device makers will focus on compact, portable systems designed for long-term care centers.
- Partnerships between hospitals and technology providers will support large-scale deployment.
- Emerging markets will see faster adoption as awareness and preventive-care investments increase.


