
Market Overview
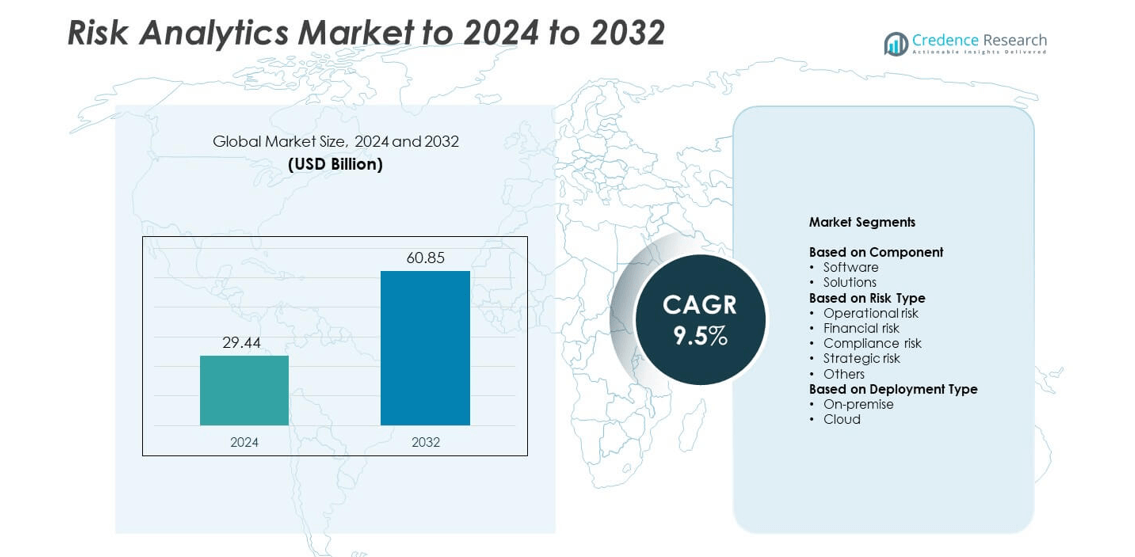
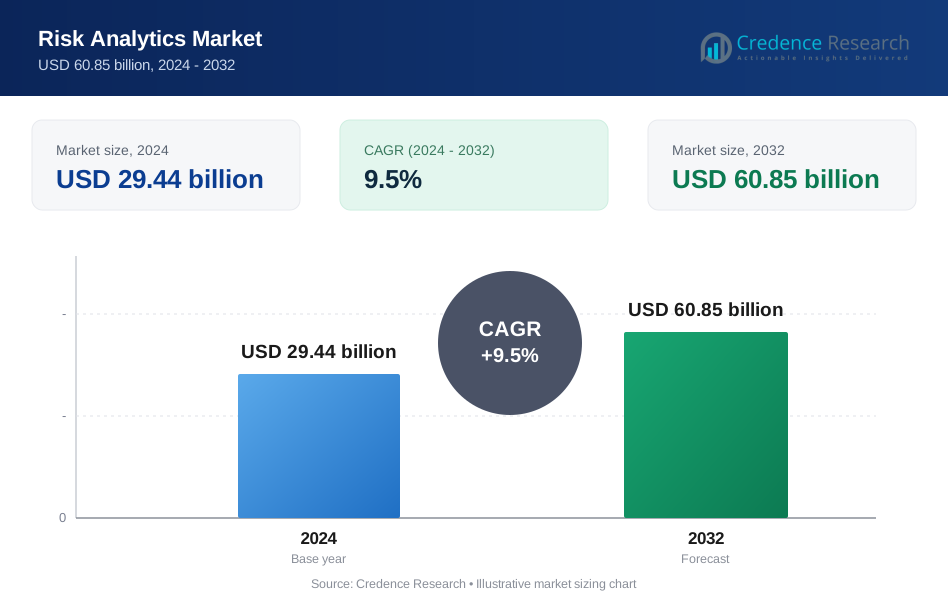
The Risk Analytics Market size was valued at USD 29.44 billion in 2024 and is anticipated to reach USD 60.85 billion by 2032, at a CAGR of 9.5% during the forecast period.
| REPORT ATTRIBUTE | DETAILS |
|---|---|
| Historical Period | 2020-2023 |
| Base Year | 2024 |
| Forecast Period | 2025-2032 |
| Risk Analytics Market Size 2024 | USD 29.44 billion |
| Risk Analytics Market, CAGR | 9.5% |
| Risk Analytics Market Size 2032 | USD 60.85 billion |
The Risk Analytics Market is led by major players such as IBM, Oracle Corporation, SAS Institute, Moody’s Analytics, and FICO, which are driving innovation through AI-enabled analytics, cloud-based risk platforms, and advanced predictive modeling tools. These companies focus on integrated risk management solutions that combine compliance automation, financial risk assessment, and cybersecurity analytics. North America dominated the global market with a 36% share in 2024, supported by strong digital infrastructure and high adoption among financial institutions. Europe followed with a 29% share, driven by strict data governance standards and increasing regulatory compliance initiatives.
Market Insights
- The Risk Analytics Market was valued at USD 29.44 billion in 2024 and is projected to reach USD 60.85 billion by 2032, growing at a CAGR of 9.5%.
- Rising regulatory compliance requirements, growing financial digitalization, and increased adoption of AI-driven analytics tools are key market drivers.
- The software segment led the market with a 63% share, driven by strong demand for predictive and real-time risk modeling solutions.
- The market is highly competitive, with major players investing in AI, machine learning, and cloud-based risk platforms to strengthen their global footprint.
- North America held the largest regional share of 36% in 2024, followed by Europe at 29% and Asia-Pacific at 25%, driven by rapid digital transformation and growing adoption of cloud-based risk management frameworks.
Market Segmentation Analysis:
By Component
The software segment dominated the Risk Analytics Market in 2024 with a 63% share. This dominance is driven by the growing integration of AI, ML, and big data technologies in risk modeling and predictive analytics. Software solutions enable real-time data monitoring, fraud detection, and automated risk assessment across industries such as banking and insurance. The increasing demand for advanced visualization dashboards and cloud-based analytical tools continues to boost adoption. Continuous enhancements in user interfaces and integration capabilities further strengthen software-led risk intelligence frameworks globally.
- For instance, as of August 2024, FICO solutions protect more than 4 billion payment cards worldwide.
By Risk Type
The financial risk segment held the largest share of 41% in 2024, supported by the rising adoption of risk modeling tools in banking, asset management, and fintech sectors. Financial institutions increasingly rely on analytics to identify credit, liquidity, and market risks while ensuring regulatory compliance. The growing complexity of financial transactions and the adoption of Basel III standards have accelerated demand. Advanced tools offering portfolio stress testing and scenario-based forecasting continue to drive investments in financial risk analytics platforms.
- For instance, NICE Actimize monitors over 5 billion transactions per day, with its solutions protecting over 1,000 organizations and safeguarding assets worth over $6 trillion daily.
By Deployment Type
The cloud segment accounted for a dominant 58% share in 2024 due to its scalability, cost-efficiency, and integration flexibility. Enterprises are shifting from on-premise systems to cloud-based risk analytics platforms to enhance agility and reduce infrastructure costs. Cloud deployment supports faster updates, multi-location access, and real-time data synchronization. Increasing adoption of SaaS-based models by BFSI and healthcare organizations further drives growth. The growing emphasis on cybersecurity and encrypted data storage is also strengthening confidence in cloud-driven risk analytics adoption worldwide.
Key Growth Drivers
Rising Demand for Predictive Risk Management
Organizations are increasingly adopting predictive analytics to forecast and mitigate potential business risks. The integration of AI and machine learning enables early detection of anomalies in financial transactions and operational processes. This proactive approach minimizes losses and enhances decision-making accuracy. The expansion of digital ecosystems in sectors such as banking, insurance, and energy further amplifies the need for predictive tools to manage complex data and evolving threats.
- For instance, as of the 2024 fiscal year, Quantexa had over 16,000 active users of its Decision Intelligence Platform.
Increasing Regulatory Compliance Requirements
Growing global regulations like Basel III, GDPR, and SOX have heightened the need for comprehensive risk analytics platforms. Enterprises are implementing advanced compliance analytics tools to meet audit requirements and reduce penalties. Automated compliance monitoring systems streamline data validation, ensuring transparency and traceability. This regulatory pressure drives demand for integrated analytics capable of monitoring real-time risk exposure and aligning reporting practices with global compliance standards.
- For instance, Moody’s Orbis provides data on 600 million+ entities for KYC and due diligence.
Growth in Cloud-Based Analytics Adoption
The rapid shift toward cloud-based architectures is enabling flexible and scalable risk management frameworks. Cloud solutions provide real-time risk assessment and secure access to analytical dashboards across distributed teams. They reduce infrastructure costs while improving data agility and model deployment speed. The rising adoption of SaaS platforms by BFSI, healthcare, and manufacturing sectors continues to strengthen market expansion for cloud-driven risk analytics.
Key Trends & Opportunities
Integration of Artificial Intelligence and Machine Learning
AI and ML technologies are reshaping the risk analytics landscape through automation and advanced pattern recognition. These tools enhance fraud detection, credit scoring, and threat prediction capabilities. Businesses are leveraging AI models for self-learning risk assessments, improving accuracy over time. This trend creates opportunities for vendors offering AI-embedded platforms that deliver deeper insights and faster decision support in high-risk industries.
- For instance, SAS ranked No. 2 in RiskTech100® 2025 and won 6 solution awards.
Expansion of Real-Time Data Analytics
The shift from static to real-time data analytics enables faster identification of emerging threats. Businesses are deploying streaming analytics to track risk indicators and detect anomalies instantly. Industries such as finance and energy benefit from these capabilities to ensure operational continuity. The growing use of IoT and connected systems further expands opportunities for real-time monitoring and predictive control in dynamic environments.
- For instance, Dataminr's AI platform is trusted by thousands of corporate, public sector, and news organizations in more than 100 countries.
Key Challenges
Data Privacy and Security Concerns
The growing volume of sensitive financial and operational data poses significant privacy risks. Breaches and unauthorized access can compromise trust and regulatory compliance. Companies must invest heavily in encryption, secure data pipelines, and governance frameworks. Striking a balance between data transparency and confidentiality remains a persistent challenge, particularly in sectors like banking and healthcare that handle critical information.
Integration Complexity Across Legacy Systems
Many organizations face challenges integrating modern analytics solutions with existing IT infrastructure. Legacy systems often lack compatibility with advanced data analytics platforms, creating inefficiencies and higher operational costs. The migration process requires specialized skills, leading to implementation delays. Ensuring seamless data flow across heterogeneous systems remains a key obstacle in achieving end-to-end risk visibility and automation.
Regional Analysis
North America
North America held the largest share of 36% in the Risk Analytics Market in 2024, driven by the strong presence of major financial institutions and advanced regulatory frameworks. The U.S. leads regional adoption due to high investments in AI-based risk modeling and cybersecurity analytics. Increasing data breaches and the need for predictive compliance tools are fueling demand. The region’s mature cloud infrastructure and presence of leading analytics providers continue to support innovation in financial, operational, and enterprise risk assessment solutions.
Europe
Europe accounted for a 29% share in the global Risk Analytics Market in 2024, supported by stringent data protection laws and rising compliance automation. The region’s focus on GDPR implementation has accelerated demand for governance and fraud detection analytics. Financial and insurance institutions are adopting advanced risk modeling tools to strengthen transparency and reporting accuracy. The United Kingdom, Germany, and France lead regional adoption, with growing emphasis on integrating AI and predictive analytics to improve real-time monitoring and regulatory conformity.
Asia-Pacific
Asia-Pacific captured a 25% share of the Risk Analytics Market in 2024, driven by rapid digitalization and financial sector growth. Emerging economies such as China, India, and Japan are investing heavily in risk assessment technologies to enhance operational resilience. The expansion of fintech ecosystems and increasing cyber threats are key drivers for analytics deployment. Governments in the region are also introducing data governance frameworks, encouraging enterprises to adopt AI-driven and cloud-based analytics solutions for proactive risk management.
Latin America
Latin America represented an 8% share of the global Risk Analytics Market in 2024, led by growing adoption across banking, telecom, and energy sectors. Countries like Brazil and Mexico are investing in predictive analytics to manage credit, compliance, and fraud risks. Regional enterprises are shifting toward cloud-based models to optimize cost and scalability. The need to strengthen data governance and meet international reporting standards continues to fuel adoption, while local vendors are expanding analytics offerings tailored to regional regulatory needs.
Middle East & Africa
The Middle East & Africa accounted for a 6% share of the Risk Analytics Market in 2024, supported by digital transformation initiatives and rising cyber risk awareness. Financial institutions in the UAE, Saudi Arabia, and South Africa are investing in AI-powered analytics for regulatory and operational risk management. Governments are promoting digital infrastructure modernization, encouraging enterprises to integrate predictive risk tools. The increasing reliance on digital banking, coupled with regional cybersecurity mandates, continues to drive gradual but steady adoption across industries.
Market Segmentations:
By Component
- Software
- Solutions
By Risk Type
- Operational risk
- Financial risk
- Compliance risk
- Strategic risk
- Others
By Deployment Type
- On-premise
- Cloud
By Geography
- North America
- U.S.
- Canada
- Europe
- Germany
- France
- Italy
- U.K.
- Russia
- Rest of Europe
- Asia-Pacific
- India
- China
- Japan
- Rest of Asia-Pacific
- Latin America
- Brazil
- Mexico
- Rest of Latin America
- Middle East and Africa
- GCC Countries
- South Africa
- Rest of Middle East and Africa
Competitive Landscape
Key players in the Risk Analytics Market include IBM, Oracle Corporation, SAS Institute, Moody’s Analytics, FICO, Accenture, Fidelity National Information Services, Verisk Analytics, OneSpan, AxiomSL, Gurucul, Risk Edge Solutions, ACL Services Ltd., dba Galvanize, and Eurorisk Systems Ltd. The market is highly competitive, with companies focusing on AI integration, cloud-based platforms, and advanced data visualization tools to enhance risk intelligence. Vendors are prioritizing end-to-end risk management suites that combine predictive analytics, compliance automation, and cybersecurity monitoring. Strategic partnerships with financial institutions and cloud service providers are expanding global reach and improving platform interoperability. Continuous investments in machine learning algorithms, real-time analytics, and scalable architectures are strengthening market positioning. Vendors are also emphasizing user-friendly interfaces and customizable dashboards to address diverse enterprise needs. The increasing demand for automated compliance and multi-domain risk analysis continues to drive innovation and intensify competition among technology providers.
Key Player Analysis
- IBM
- Oracle Corporation
- SAS Institute
- Moody’s Analytics
- FICO
- Accenture
- Fidelity National Information Services
- Verisk Analytics
- OneSpan
- AxiomSL
- Gurucul
- Risk Edge Solutions
- ACL Services Ltd.
- dba Galvanize
- Eurorisk Systems Ltd.
Recent Developments
- In 2025, IBM and Telefónica Tech collaborated to develop security solutions addressing threats posed by future quantum computing, strengthening proactive risk assessments.
- In 2025, FICO Launched "financial foundation models" to bolster its risk analytics offerings.
- In 2023, Moody's and Microsoft announced a strategic partnership to combine Moody's proprietary data and analytics with the power of Microsoft's Azure OpenAI service. The collaboration's aim was to create advanced generative AI-powered solutions for enhanced research and risk assessment
Report Coverage
The research report offers an in-depth analysis based on Component, Risk Type, Deployment Type and Geography. It details leading market players, providing an overview of their business, product offerings, investments, revenue streams, and key applications. Additionally, the report includes insights into the competitive environment, SWOT analysis, current market trends, as well as the primary drivers and constraints. Furthermore, it discusses various factors that have driven market expansion in recent years. The report also explores market dynamics, regulatory scenarios, and technological advancements that are shaping the industry. It assesses the impact of external factors and global economic changes on market growth. Lastly, it provides strategic recommendations for new entrants and established companies to navigate the complexities of the market.
Future Outlook
- Demand for AI-driven predictive risk solutions will continue to rise across industries.
- Cloud-based deployment models will dominate due to scalability and lower operational costs.
- Integration of big data and IoT analytics will enhance real-time risk detection.
- Financial institutions will expand adoption to improve compliance and fraud prevention.
- Regulatory requirements will drive continuous innovation in automated reporting tools.
- Partnerships between analytics vendors and cloud providers will increase global accessibility.
- Cybersecurity risk analytics will gain priority amid growing digital threats.
- SMEs will adopt affordable SaaS-based risk management solutions.
- Advanced visualization dashboards will support faster, data-driven decision-making.
- Emerging economies will witness strong adoption driven by digital transformation initiatives.
Request a Free Sample
Fill in your details and we'll send you a free sample report.
- Sample data tables & charts
- Research methodology
Need a Custom Version of This Report?
Tailor the scope, geography, or segments to your exact requirements.
- Custom geography or segment scope
- Direct access to our analyst team
Frequently Asked Questions
What is the current market size for Risk Analytics Market, and what is its projected size in 2032?
At what Compound Annual Growth Rate is the Risk Analytics Market projected to grow between 2025 and 2032?
Which Risk Analytics Market segment held the largest share in 2024?
What are the primary factors fueling the growth of the Risk Analytics Market?
Who are the leading companies in the Risk Analytics Market?
Which region commanded the largest share of the Risk Analytics Market in 2024?
Table of Content
Chapter 1. Report Introduction
- 1.1 Report Description & Purpose
- 1.1.1 Report Title & Market Definition
- 1.1.2 Unique Selling Propositions (USP) & Key Differentiators
- 1.1.3 Value Proposition for Stakeholders
- 1.2 Research Objectives
- 1.2.1 Market Sizing Objectives (Volume & Revenue) (Volume Where Applicable)
- 1.2.2 Segmentation Objectives
- 1.2.3 Competitive Intelligence Objectives
- 1.2.4 Forecast & Scenario Objectives
- 1.3 Report Scope
- 1.3.1 Risk Analytics Scope – Segments & Subsegments Covered
- 1.3.2 Geographic Scope – Regions & Countries Covered
- 1.3.3 Historical Period, Base Year & Forecast Period (2024; forecast to 2032)
- 1.3.4 Inclusions & Exclusions
- 1.4 Industry Classification & Applicable Codes
- 1.5 Currency, Measurement Units & Valuation Basis
- 1.6 Target Stakeholders
- 1.7 Limitations & Assumptions
Chapter 2. Executive Summary
- 2.1 Global Risk Analytics Market Snapshot
- 2.1.1 Market Size – Historical (2024) & Forecast (2024-2032) (2024: USD 29.44 billion → 2032: USD 60.85 billion)
- 2.1.2 Volume & Revenue – Global Totals (Volume Where Applicable)
- 2.1.3 Key Market Highlights – Top Five Facts
- 2.2 Risk Analytics Market Segmentation Snapshot
- 2.2.1 Market Split by Region – 2024 vs. 2032
- 2.3 Competitive Snapshot
- 2.3.1 Top 10 Players by Revenue Share – 2024
- 2.3.2 Top 10 Players by Volume Share – 2024 (Volume Where Applicable)
- 2.3.3 Recent Strategic Developments (18-Month Summary)
- 2.4 Key Investment Highlights & Strategic Conclusions
Chapter 3. Risk Analytics Market Dynamics & Industry Analysis
- 3.1 Market Overview & Context
- 3.1.1 Risk Analytics Market Position in the Broader Industry Value Chain
- 3.1.2 Demand Structure & Purchasing Dynamics
- 3.1.3 Market Maturity & Development Stage by Region
- 3.2 Risk Analytics Market Drivers
- 3.3 Risk Analytics Market Restraints & Challenges
- 3.4 Risk Analytics Market Opportunities
- 3.5 Porter's Five Forces Analysis
- 3.5.1 Threat of New Entrants
- 3.5.2 Bargaining Power of Suppliers
- 3.5.3 Bargaining Power of Buyers
- 3.5.4 Threat of Substitutes
- 3.5.5 Competitive Rivalry – Intensity Assessment
- 3.6 Risk Analytics Value Chain Analysis
- 3.6.1 Upstream – Key Inputs, Resources & Suppliers
- 3.6.1.1 Key Input/Resource 1
- 3.6.1.2 Key Input/Resource 2
- 3.6.1.3 Key Input/Resource 3
- 3.6.2 Midstream – Core Operations & Value Creation
- 3.6.2.1 Operating Model & Process Overview
- 3.6.2.2 Key Operating Locations & Capabilities by Company
- 3.6.3 Downstream – Market Channels & End Users
- 3.6.3.1 Direct Sales & Customer Engagement Channels
- 3.6.3.2 Indirect Sales, Intermediaries & Partner Channels
- 3.6.4 Value Chain Profitability Analysis
- 3.6.1 Upstream – Key Inputs, Resources & Suppliers
- 3.7 PESTEL Analysis
- 3.7.1 Political Factors
- 3.7.2 Economic Factors
- 3.7.3 Social Factors
- 3.7.4 Technological Factors
- 3.7.5 Environmental Factors
- 3.7.6 Legal Factors
- 3.8 Risk Analytics Supply Chain Analysis
- 3.8.1 Critical Input & Resource Availability Risk Assessment
- 3.8.2 Supplier & Operational Concentration Risk (Geographic Exposure)
- 3.8.3 Supply & Service Disruption Impact Analysis
- 3.9 Regulatory & Policy Landscape
Note: The regulatory and policy landscape section covers regulations based on their applicability to the market, Risk Analytics category, geography, and scope of the study. Only regulatory frameworks with a material impact on operations, compliance, trade, sustainability, or market access are analyzed in detail.
Chapter 4. Key Investment Pockets & Opportunity Analysis
- 4.1 Risk Analytics Market Attractiveness Analysis
- 4.1.1 By Region – Investment Attractiveness Matrix (Market Size × CAGR)
- 4.2 Absolute Revenue Growth Opportunity
- 4.2.1 By Region – Absolute Revenue Growth Through 2032
- 4.3 Incremental Demand Opportunity
- 4.3.1 By Region – Incremental Demand Through 2032
- 4.3.2 Segment – Incremental Demand
- 4.4 Emerging Submarket Opportunity Deep Dive (Subject to Applicability)
- 4.5 Priority Market Opportunity Scorecards
- 4.5.1 United States
- 4.5.2 Europe
- 4.5.3 Asia
- 4.5.4 Middle East & Africa
Note: Priority market opportunity scorecards reflect the geographic scope and strategic relevance of the study. Listed markets are indicative and may be adapted to the industry.
Chapter 5. Risk Analytics Cross-Border Trade & Market Access Analysis
- 5.1 International Trade & Cross-Border Activity Overview
- 5.1.1 Global Export Value by Country (2024)
- 5.1.2 Global Export Volume by Country (2024) (Volume Where Applicable)
- 5.1.3 Global Import Value by Country (2024)
- 5.1.4 Global Import Volume by Country (2024) (Volume Where Applicable)
- 5.1.5 Net Trade Balance by Country (2024)
- 5.2 Export Analysis – Segment
- 5.2.1 Category 1 (Applicable Classification Code)
- 5.2.2 Category 2 (Applicable Classification Code)
- 5.2.3 Category 3 (Applicable Classification Code)
- 5.2.4 Category 4 (Applicable Classification Code)
- 5.2.5 Category 5 (Applicable Classification Code)
- 5.3 Import Analysis – Segment
- 5.3.1 Category 1 (Applicable Classification Code)
- 5.3.2 Category 2 (Applicable Classification Code)
- 5.3.3 Category 3 (Applicable Classification Code)
- 5.3.4 Category 4 (Applicable Classification Code)
- 5.3.5 Category 5 (Applicable Classification Code)
- 5.4 Cross-Border Pricing & Transaction Benchmarks
- 5.4.1 Export Pricing – Segment & Country
- 5.4.2 Import Pricing – Segment & Source Country
- 5.4.3 Price Trends (2024)
- 5.5 Key Cross-Border Trade & Delivery Routes
- 5.5.1 Cross-Border Trade/Delivery Route 1
- 5.5.2 Cross-Border Trade/Delivery Route 2
- 5.5.3 Cross-Border Trade/Delivery Route 3
- 5.5.4 Cross-Border Trade/Delivery Route 4
- 5.5.5 Cross-Border Trade/Delivery Route 5
- 5.6 Trade Policy & Market Access Impact Assessment
- 5.6.1 Tariff & Non-Tariff Barriers
- 5.6.2 Regional Trade & Economic Integration Frameworks
- 5.6.3 Bilateral & Multilateral Trade Agreements
- 5.6.4 Cross-Border Operating, Licensing & Localization Requirements
Note: This chapter applies where cross-border trade or delivery is relevant to Risk Analytics. Goods, services, and digital offerings are assessed using applicable classifications and transaction measures. Import-export volumes, trade balances, and route analyses are included only where meaningful to the market.
Chapter 6. Competitive Landscape & Company Benchmarking
- 6.1 Risk Analytics Market Concentration & Structure
- 6.1.1 Herfindahl-Hirschman Index (HHI) – the historical period vs. 2024
- 6.1.2 Leading, Mid-Sized & Emerging Player Structure
- 6.1.3 Global, Regional & Local Player Dynamics
- 6.2 Risk Analytics Market Share Analysis – 2024
- 6.2.1 Global Revenue Share by Company
- 6.2.2 Global Volume Share by Company (Volume Where Applicable)
- 6.2.3 Regional Revenue Share
- 6.2.4 Market Share Evolution (the historical period vs. 2024)
- 6.2.5 Company Market Share by Key Segment
- 6.2.6 Company Market Share by Customer Group
- 6.3 Operating Scale, Capacity & Infrastructure Analysis
- 6.3.1 Global Operating Scale & Supply Capacity
- 6.3.2 Resource Utilization & Operating Efficiency
- 6.3.3 Output, Service Delivery & Activity Metrics
- 6.3.4 Operating Footprint & Infrastructure Map
- 6.3.5 Planned Operational & Capacity Expansion
- 6.4 Risk Analytics Competitive Benchmarking Matrix
- 6.4.1 Revenue, Growth, Profitability & Operating Metric Comparison
- 6.4.2 Channel Revenue Mix
- 6.4.3 Geographic Revenue Exposure
- 6.4.4 R&D Intensity
- 6.4.5 Sustainability Maturity
- 6.5 Strategic Developments in Risk Analytics (Last 24 Months)
- 6.5.1 Mergers, Acquisitions & Divestments
- 6.5.2 New Products, Services & Solutions in Risk Analytics
- 6.5.3 Operational & Infrastructure Expansions
- 6.5.4 Strategic Alliances, Joint Ventures & Partnerships
- 6.5.5 Distribution Expansion & Market Entry
- 6.5.6 Sustainability & ESG Initiatives
- 6.6 Competitive Strategy Mapping
- 6.6.1 Leader, Challenger, Follower & Niche Classification
- 6.6.2 Pricing Strategy Comparison
- 6.6.3 Channel Strategy Matrix
Note: Strategic developments are included based on their materiality and the availability of reliable information.
Chapter 7. Global Risk Analytics Market – By Sales & Delivery Channel
- 7.1 Segment Overview
- 7.1.1 Volume & Revenue Split by Channel (2024 & 2032) (Volume Where Applicable)
- 7.1.2 Channel Mix Evolution (2024-2032)
Chapter 8. Regional Market Analysis – Global Overview
- 8.1 Global Regional Overview
- 8.1.1 Regional Volume Share (Volume Where Applicable)
- 8.1.2 Regional Revenue Share
- 8.1.3 Regional Volume by Region (Volume Where Applicable)
- 8.1.4 Regional Revenue by Region
- 8.1.5 Regional Forecast Through 2032
- 8.2 Cross-Regional Segment Analysis
- 8.2.1 By Sales & Delivery Channel
- 8.2.2 By Competitive Positioning & Price Tier
Chapter 9. North America Risk Analytics Market
- 9.1 United States
- 9.2 Canada
- 9.3 Mexico
Chapter 10. Europe Risk Analytics Market
- 10.1 Germany
- 10.2 France
- 10.3 Italy
- 10.4 United Kingdom
- 10.5 Spain
- 10.6 Poland
- 10.7 Russia
- 10.8 Netherlands
- 10.9 Belgium
- 10.10 Sweden
- 10.11 Denmark
- 10.12 Norway
- 10.13 Rest of Europe
Chapter 11. Asia Pacific Risk Analytics Market
- 11.1 China
- 11.2 India
- 11.3 Japan
- 11.4 South Korea
- 11.5 Thailand
- 11.6 Indonesia
- 11.7 Vietnam
- 11.8 Malaysia
- 11.9 Australia
- 11.10 Rest of Asia Pacific
Chapter 12. Latin America Risk Analytics Market
- 12.1 Brazil
- 12.2 Argentina
- 12.3 Colombia
- 12.4 Chile
- 12.5 Rest of Latin America
Chapter 13. Middle East Risk Analytics Market
- 13.1 Saudi Arabia
- 13.2 United Arab Emirates
- 13.3 Turkey
- 13.4 Israel
- 13.5 Iran
- 13.6 Rest of the Middle East
Chapter 14. Africa Risk Analytics Market
- 14.1 South Africa
- 14.2 Egypt
- 14.3 Nigeria
- 14.4 Morocco
- 14.5 Rest of Africa
Chapter 15. Risk Analytics Company Profiles
- 15.1 [Company 01]
- 15.1.1 Company Overview
- 15.1.2 Key Management Personnel
- 15.1.3 Products & Services Portfolio
- 15.1.4 Financial Performance
- 15.1.5 Key Market Focus & Geographic Presence
- 15.1.6 Recent Developments & Strategic Initiatives
Note: The company profile list is preliminary and may change based on research findings, market developments, data availability, and client requirements.
Chapter 16. Appendices
- Appendix A – List of Abbreviations & Acronyms
- Appendix B – Industry Classification Code Reference – Full Series
- Appendix C – Supply, Output & Operating Capacity Data Tables
- Appendix D – End-Use & Demand Base Tables
- Appendix E – Demand, Adoption & Usage Assumptions
- Appendix F – Pricing & Revenue Metric Reference Tables
- Appendix G – Company Operations & Infrastructure Database
- Appendix H – Cross-Border Trade & Activity Data Tables (Where Applicable)
- Appendix I – Regulatory Summary Tables
- Appendix J – Primary Research Participant List (Anonymized)
- Appendix K – Primary Research Questionnaire Framework
- Appendix L – Data Sources & Bibliography
- Appendix M – Market Size Divergence & Source Comparison
Chapter 17. Research Methodology
- 17.1 Research Framework & Philosophy
- 17.2 Secondary Research – Sources, Hierarchy & Data Extraction
- 17.3 Data Modeling – Bottom-Up & Top-Down Market Sizing
- 17.4 Primary Research – Stakeholder Framework, LOI & Sample Sizes
- 17.5 Forecast Methodology – Regression, Scenario & Sensitivity Analysis
- 17.6 Quality Control – Four-Layer Validation Framework
- 17.7 Limitations & Standard Assumptions
- 17.8 Disclaimer
