| REPORT ATTRIBUTE |
DETAILS |
| Historical Period |
2020-2023 |
| Base Year |
2024 |
| Forecast Period |
2025-2032 |
| Road Marking Machines Market Size 2024 |
USD 8,281.26 million |
| Road Marking Machines Market, CAGR |
9.36% |
| Road Marking Machines Market Size 2032 |
USD 16,855.92 million |
Market Overview
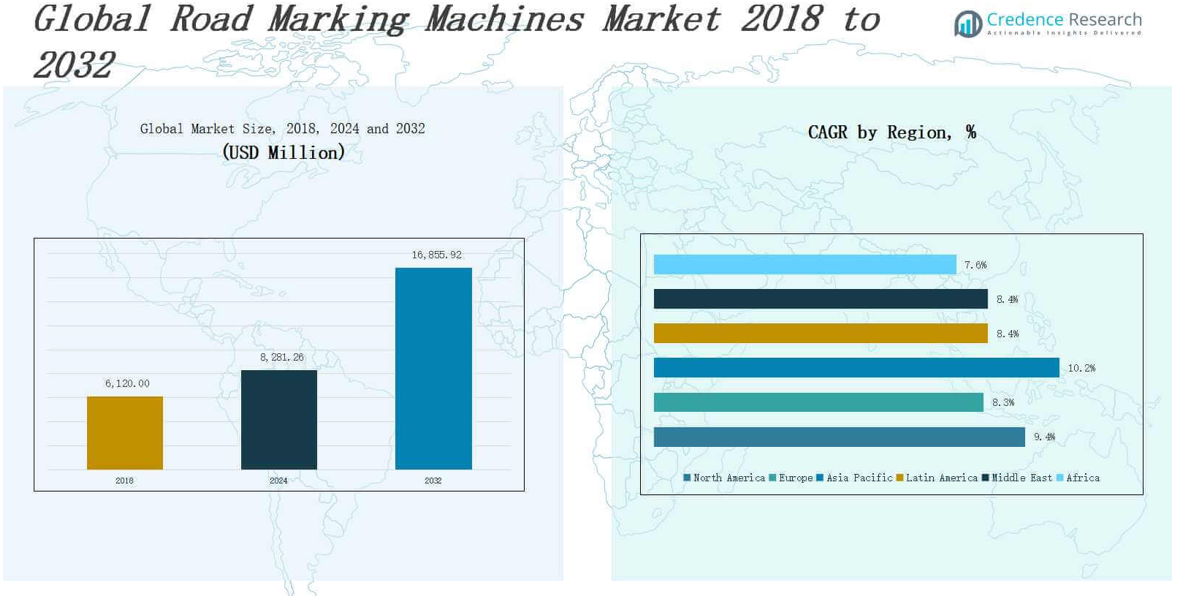
The Road Marking Machines Market size was valued at USD 6,120.00 million in 2018 to USD 8,281.26 million in 2024 and is anticipated to reach USD 16,855.92 million by 2032, at a CAGR of 9.36 % during the forecast period.
The Road Marking Machines Market is experiencing steady growth driven by increasing infrastructure development, rising urbanization, and stringent government regulations mandating road safety enhancements. Expanding investments in highway construction, smart city projects, and roadway maintenance activities across emerging and developed economies are boosting demand for advanced road marking equipment. The market benefits from the growing focus on durable and reflective markings to improve visibility and traffic control, particularly under low-light and adverse weather conditions. Automation and technological advancements, such as GPS-based systems, semi-automatic and self-propelled machines, are gaining traction for improving precision, efficiency, and operational speed. Demand for eco-friendly and thermoplastic road marking materials further supports innovation in machine design. Rising traffic density and a global push for improved transportation networks are creating a favorable environment for manufacturers. Increasing adoption of high-performance striping solutions for airports, parking lots, and industrial zones also contributes to market expansion. The sector shows a clear trend toward customization, portability, and user-friendly features.
The Road Marking Machines Market spans key regions including North America, Europe, Asia Pacific, Latin America, the Middle East, and Africa. Asia Pacific holds the largest market share due to rapid infrastructure growth in China, India, and Southeast Asia. North America and Europe follow, driven by advanced technology adoption and strict road safety regulations. Latin America and the Middle East show steady growth supported by urbanization and national development plans, while Africa emerges with rising demand from transport corridor projects. Key players shaping the competitive landscape include Hofmann, Graco Inc., Borum A/S, TATU Group, RME Road Marking Equipment, STiM Group, Automark Industries (India) Pvt Ltd., Titan Tool Inc., Jiangsu Winfar Transport Facilities Co., Ltd, and Zhengzhou Dayu Machinery Co., Ltd. These companies drive market expansion through innovation, global distribution, and region-specific machine offerings tailored to diverse operational environments.
Market Insights
- The Road Marking Machines Market was valued at USD 6,120.00 million in 2018 and is projected to reach USD 16,855.92 million by 2032, growing at a CAGR of 9.36%.
- Infrastructure growth, smart city development, and strict road safety regulations are fueling global demand for road marking machines across both developed and emerging regions.
- Automation and technology integration such as GPS guidance, laser alignment, and self-propelled systems are transforming operational precision and efficiency.
- Thermoplastic and eco-friendly materials are gaining preference, prompting machine manufacturers to innovate for material compatibility and environmental compliance.
- North America and Europe show strong demand due to mature road infrastructure and regulatory mandates, while Asia Pacific dominates in volume due to large-scale construction and urbanization.
- High equipment costs, maintenance complexity, and the need for skilled operators pose challenges, particularly in budget-sensitive and labor-constrained regions.
- Leading companies such as Hofmann, Graco Inc., Borum A/S, and TATU Group drive market growth through innovation, global outreach, and tailored solutions for diverse regional needs.
Access crucial information at unmatched prices!
Request your sample report today & start making informed decisions powered by Credence Research Inc.!
Download Sample
Market Drivers
Surge in Global Infrastructure Development
The Road Marking Machines Market is gaining momentum due to the rapid expansion of global infrastructure projects. Governments are allocating significant budgets to upgrade highways, rural roads, and expressways to support economic growth and connectivity. It benefits from the steady increase in transportation projects driven by urbanization and population growth. Developing nations in Asia-Pacific and Africa are investing in modernizing road networks, which elevates the demand for efficient marking solutions. The need for well-maintained roads with clear visibility drives adoption of advanced equipment. Road authorities are emphasizing lane demarcation, pedestrian zones, and traffic guidance systems. This infrastructure push establishes a strong foundation for market expansion.
- For instance, in June 2024, EZ Liner‑Arrow showcased its Electra robotic road marking system in Allied Paving Equipment magazine, highlighting improved efficiency and sustainability for upcoming pavement marking projects.
Rising Road Safety Regulations and Standards
The implementation of strict safety regulations is a major driver shaping the Road Marking Machines Market. Governments across the globe are enforcing standards for road visibility, night-time reflectivity, and lane guidance. It encourages the use of high-performance machines capable of applying durable and reflective coatings accurately. Road safety campaigns and accident-reduction targets elevate demand for clear, standardized road markings. Public agencies and municipalities are prioritizing structured lane organization to minimize traffic incidents. This regulatory focus supports consistent demand across new construction and maintenance applications. The market benefits from compliance-driven purchases across both developed and developing regions.
- For instance, Primax Equipment in India offers thermoplastic road marking machines designed for high durability and reflective coatings, directly meeting the demands of highway authorities and municipal corporations for standardized, long-lasting road markings
Technological Advancements in Marking Equipment
Innovation in machine automation, digital control systems, and smart guidance technologies is transforming the Road Marking Machines Market. Equipment now features GPS integration, laser-based alignment, and computer-controlled spray systems to ensure higher precision. It supports faster project completion and reduces human error during application. Manufacturers are developing semi-automatic and self-propelled machines to improve operational efficiency. These advancements reduce downtime, optimize material usage, and extend the lifespan of markings. Contractors and government bodies are shifting toward modern equipment to meet project timelines and safety expectations. The evolution of machine design is reshaping procurement patterns in the industry.
Growing Demand for Thermoplastic and Eco-Friendly Solutions
The shift toward environmentally sustainable and long-lasting materials is positively impacting the Road Marking Machines Market. Thermoplastic markings, known for their durability and reflectivity, are seeing increased adoption in highways, airports, and industrial settings. It requires specialized machines capable of high-temperature operations and consistent application. Demand for water-based and low-VOC paints is rising, encouraging machine innovation for compatibility. Environmental compliance mandates in Europe and North America accelerate the transition to green materials. Market players are aligning product lines with these shifts to gain competitive advantage. The growing preference for sustainable marking practices is driving demand for technically advanced equipment.
Market Trends
Adoption of Automation and Smart Control Systems
Automation is a key trend reshaping the Road Marking Machines Market. Advanced machines now integrate GPS, laser sensors, and computer-controlled systems for higher precision and consistency. It reduces operator dependency while improving efficiency on long or complex road segments. Smart controls support better line alignment, optimal paint usage, and improved safety for both operators and traffic. These systems are particularly valuable for government and private contractors managing large-scale infrastructure projects. Demand is shifting toward self-propelled and driver-assisted models. Automation enhances productivity while lowering long-term operational costs.
- For instance, RoadSky’s driving-type road marking machines are equipped with computerized control systems that enable operators to achieve highly accurate line application on large-scale highway projects, reducing manual intervention and improving speed.
Rising Popularity of Thermoplastic and Durable Marking Applications
The Road Marking Machines Market is witnessing a rising preference for machines compatible with thermoplastic and long-lasting materials. Thermoplastic markings are being widely used on high-traffic routes, airfields, and commercial zones due to their weather resistance and longevity. It pushes the need for machines with robust heating mechanisms, temperature controls, and high-pressure application systems. Manufacturers are introducing machines that support various materials, including cold plastic, epoxy, and waterborne paints. This flexibility allows contractors to meet diverse regulatory and environmental standards. The trend toward longer-lasting markings is driving the development of more sophisticated equipment platforms.
- For instance, the RS-1 Thermoplastic Road Marking Machine by RoadSky features customizable paint tank capacities (100 kg or 200 kg), adjustable marking widths (50 mm to 500 mm), and a service life of 5 to 10 years depending on usage, making it suitable for diverse applications such as highways, airports, and parking lots.
Integration of Eco-Friendly Features and Fuel Efficiency
Sustainability is emerging as a significant trend in the Road Marking Machines Market, driving innovation in fuel-efficient engines and emission-reducing components. It includes hybrid or battery-operated models for urban use where noise and pollution regulations are strict. Manufacturers are also focusing on optimizing fuel consumption through intelligent power management. Environmental concerns are influencing the adoption of water-based paints, prompting machine redesigns for material compatibility. Compact and modular machines with low carbon footprints are gaining popularity in urban maintenance projects. This focus on green technology strengthens brand positioning and regulatory alignment.
Customization and Portability to Suit Urban and Rural Needs
Customizable and portable road marking solutions are gaining traction in the Road Marking Machines Market. Contractors require machines tailored to different project scales, ranging from narrow city lanes to wide national highways. It drives demand for lightweight, easy-to-transport units that offer quick setup and disassembly. Modular components, foldable frames, and adjustable line width features are becoming standard. Urban areas prefer compact machines for maneuverability, while rural projects demand rugged, high-capacity models. Manufacturers are adapting designs based on operational environments and user feedback. The push for tailored solutions reflects growing end-user sophistication and practical field requirements.
Market Challenges Analysis
High Initial Costs and Maintenance Complexity
The Road Marking Machines Market faces challenges due to the high initial investment required for advanced machinery. Small and mid-sized contractors often hesitate to adopt automated or thermoplastic-compatible machines because of capital constraints. It affects market penetration in developing economies where budget allocation for road infrastructure remains limited. Maintenance costs are also substantial, particularly for high-precision systems with digital controls and thermal units. Frequent servicing, part replacements, and operator training further increase operational expenses. These cost-related factors hinder widespread adoption, especially among cost-sensitive users.
Skilled Labor Shortage and Operational Limitations
A shortage of skilled operators poses a significant barrier in the Road Marking Machines Market. Advanced machines require trained personnel for operation, calibration, and troubleshooting, which limits their use in regions with limited technical expertise. It impacts the efficiency and consistency of road marking tasks. Seasonal constraints and unfavorable weather conditions, such as heavy rain or extreme temperatures, further delay field operations. Regulatory differences across countries in terms of marking standards and equipment approval also create complexity for manufacturers. These challenges reduce the pace of technology integration and affect long-term deployment planning.
Market Opportunities
Expansion of Smart City and Highway Projects
The Road Marking Machines Market holds significant opportunity through the growing number of smart city and highway expansion initiatives worldwide. Governments are actively investing in transportation infrastructure that demands efficient and precise road markings for traffic management and safety. It creates demand for advanced, automated machines with GPS and sensor integration. Urban development projects require high-visibility, long-lasting markings across intersections, pedestrian zones, and dedicated lanes. Smart city frameworks prioritize data-driven traffic systems, supporting machines that enable accurate and uniform markings. This expanding project pipeline opens new revenue streams for manufacturers and service providers.
Rising Demand from Emerging Markets
Emerging economies present a strong growth avenue for the Road Marking Machines Market. Infrastructure modernization, rising vehicle density, and growing focus on road safety drive the need for efficient marking solutions in regions like Asia-Pacific, Latin America, and Africa. It benefits from increasing government budgets and international funding directed toward road connectivity. Local contractors seek cost-effective yet capable machines suited for varied terrains and climates. Equipment makers can capture market share by offering durable, easy-to-operate models tailored for regional needs. Expanding dealer networks and aftersales support in these geographies will further accelerate market access.
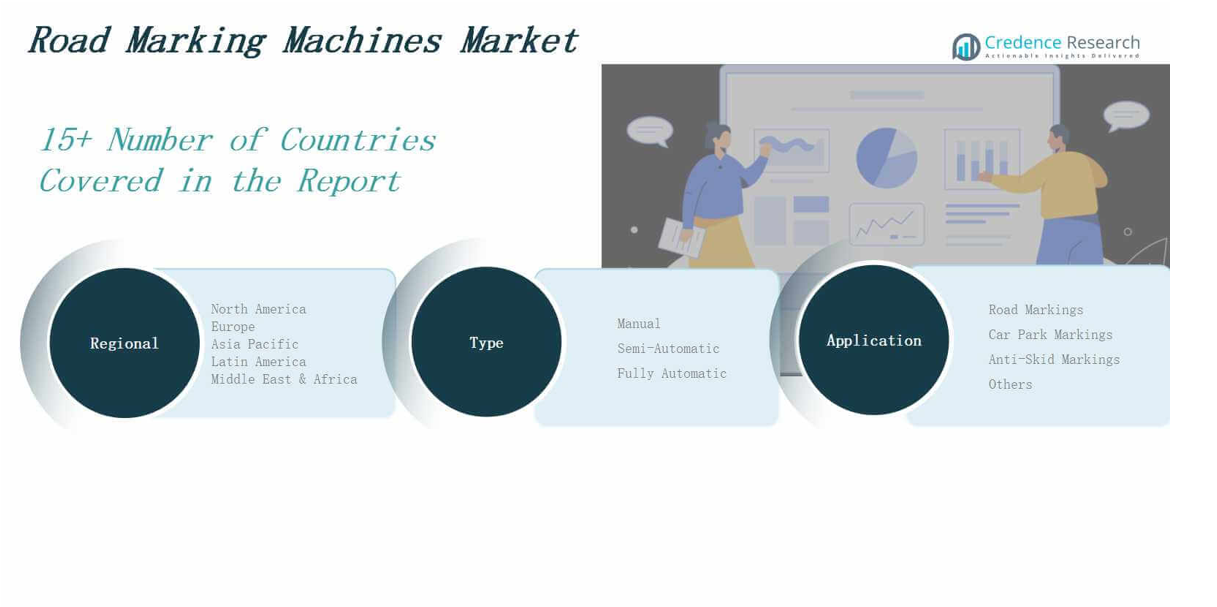
Market Segmentation Analysis:
By Type
The Road Marking Machines Market includes manual, semi-automatic, and fully automatic machines. Manual machines continue to serve small-scale or budget-sensitive projects due to their low cost and simplicity. Semi-automatic machines are gaining traction across mid-scale infrastructure developments, offering a balance between control and efficiency. Fully automatic machines dominate large-scale highway and urban development projects due to their precision, speed, and integration with GPS and sensor technologies. It supports fast application with minimal human error, especially in projects that demand uniformity and high productivity. The shift toward automation is strengthening the demand for fully automatic variants.
- For instance, Vishwakarma Engineering offers a hand-push thermoplastic road marking machine with a 100 kg capacity and LPG heating, suitable for lane and edge marking in city areas, priced around ₹75,000 per unit.
By Application
The Road Marking Machines Market serves diverse applications, including road markings, car park markings, anti-skid markings, and others. Road markings account for the largest share, driven by continuous investments in highways, city roads, and national infrastructure upgrades. Car park markings are expanding due to growing commercial complexes, airports, and residential facilities. Anti-skid markings are critical for safety in high-risk zones such as curves, intersections, and wet areas. It meets specific safety standards to prevent vehicle skidding. The “others” segment includes markings for industrial floors, sports grounds, and logistics hubs, contributing to niche but growing demand segments.
- For instance, Sherwin-Williams Company supplies marking materials used in major highway projects across the US, supporting ongoing investments in national infrastructure upgrades.
Segments:
Based on Type
- Manual
- Semi-Automatic
- Fully Automatic
Based on Application
- Road Markings
- Car Park Markings
- Anti-Skid Markings
- Others
Based on Region
- North America
- Europe
- Germany
- France
- U.K.
- Italy
- Spain
- Rest of Europe
- Asia Pacific
- China
- Japan
- India
- South Korea
- South-east Asia
- Rest of Asia Pacific
- Latin America
- Brazil
- Argentina
- Rest of Latin America
- Middle East & Africa
- GCC Countries
- South Africa
- Rest of the Middle East and Africa
Regional Analysis
North America
The North America Road Marking Machines Market size was valued at USD 1,585.08 million in 2018 to USD 2,108.36 million in 2024 and is anticipated to reach USD 4,283.12 million by 2032, at a CAGR of 9.4% during the forecast period. North America holds a significant share of the global market due to high investment in highway infrastructure, urban development, and maintenance projects. The U.S. leads the region with strong regulatory enforcement and emphasis on road safety, which boosts demand for fully automatic and thermoplastic-capable machines. It benefits from advanced technology integration, including GPS-enabled and self-propelled systems. Public-private partnerships and state-level initiatives fuel consistent equipment procurement. The mature road network and rising traffic volumes ensure a steady replacement and maintenance cycle. North America accounts for a considerable portion of global revenue share due to its well-established infrastructure ecosystem.
Europe
The Europe Road Marking Machines Market size was valued at USD 1,211.76 million in 2018 to USD 1,554.99 million in 2024 and is anticipated to reach USD 2,928.76 million by 2032, at a CAGR of 8.3% during the forecast period. Europe shows strong demand driven by stringent safety norms, smart city programs, and sustainable transport infrastructure. It adopts advanced road marking technologies, including eco-friendly and low-VOC systems. Countries like Germany, France, and the UK prioritize durable and high-visibility road markings. The region supports automation and electric-powered machines due to environmental policies. High-quality standards and regulations encourage continuous upgrades in public road maintenance. Europe holds a notable share of the global market with emphasis on innovation and compliance.
Asia Pacific
The Asia Pacific Road Marking Machines Market size was valued at USD 2,374.56 million in 2018 to USD 3,302.94 million in 2024 and is anticipated to reach USD 7,168.84 million by 2032, at a CAGR of 10.2% during the forecast period. Asia Pacific dominates the global market with the highest share, driven by large-scale urbanization and massive investments in road connectivity. China, India, and Southeast Asia contribute significantly through rapid infrastructure development. It demands both entry-level and high-performance machines to support a wide range of projects. Government initiatives like smart cities and expressway expansions fuel procurement. Rising population and vehicle ownership intensify the need for effective traffic control. The region remains the fastest-growing in terms of both volume and value.
Latin America
The Latin America Road Marking Machines Market size was valued at USD 335.38 million in 2018 to USD 448.76 million in 2024 and is anticipated to reach USD 837.23 million by 2032, at a CAGR of 8.2% during the forecast period. Latin America shows gradual growth with rising investments in transportation infrastructure and urban mobility programs. Brazil and Mexico lead regional demand, supported by public safety initiatives and road network expansion. It gains momentum from increased focus on pedestrian safety, organized traffic flow, and city modernization. Mid-range semi-automatic machines dominate the procurement landscape. Local governments prioritize cost-effective solutions with basic automation. The market exhibits steady potential through regional partnerships and infrastructure upgrades.
Middle East
The Middle East Road Marking Machines Market size was valued at USD 332.32 million in 2018 to USD 429.74 million in 2024 and is anticipated to reach USD 815.92 million by 2032, at a CAGR of 8.4% during the forecast period. The Middle East market is shaped by national development visions, high-profile infrastructure projects, and highway modernization plans. Countries like the UAE, Saudi Arabia, and Qatar invest heavily in smart transport corridors and expressways. It supports demand for high-performance machines, especially those compatible with thermoplastic and reflective markings. Regional governments are focusing on traffic efficiency and safety in urban and desert environments. Growing logistics infrastructure and airport development also boost machine deployment. The Middle East maintains stable demand, backed by strategic urban expansion.
Africa
The Africa Road Marking Machines Market size was valued at USD 280.91 million in 2018 to USD 436.46 million in 2024 and is anticipated to reach USD 822.05 million by 2032, at a CAGR of 8.1% during the forecast period. Africa presents emerging opportunities driven by cross-border road projects, economic corridors, and urban expansion. South Africa, Egypt, and Kenya are key markets investing in better road visibility and maintenance. It favors simple and durable machines suited for varying terrain and climate. Government collaborations with global infrastructure bodies are supporting procurement. Demand is rising in rural development programs and transport safety initiatives. The market holds long-term growth potential with gradual adoption of semi-automatic and automatic models.
Shape Your Report to Specific Countries or Regions & Enjoy 30% Off!
Key Player Analysis
- Hofmann
- Borum A/S
- Graco Inc.
- RME Road Marking Equipment
- STiM Group
- Zhengzhou Dayu Machinery Co., Lt
- Automark Industries (India) Pvt Ltd.
- Titan Tool Inc.
- TATU Group
- Jiangsu Winfar Transport Facilities Co., Ltd
Competitive Analysis
The Road Marking Machines Market features a moderately consolidated landscape, led by established players offering diverse machine portfolios and strong global distribution networks. Companies like Hofmann, Graco Inc., Borum A/S, and TATU Group compete on performance, durability, and automation capabilities. It witnesses intense competition in product innovation, particularly in thermoplastic and GPS-enabled systems. Regional manufacturers focus on affordability and customization to meet local demands, especially in emerging markets. Leading players invest in R&D to enhance machine efficiency, reduce emissions, and integrate smart control systems. Strategic collaborations and aftersales service differentiation play a key role in sustaining market position. New entrants face high capital and technology barriers, limiting rapid market entry. The Road Marking Machines Market favors companies that align products with evolving regulatory standards, user safety, and environmental compliance. Competitive dynamics are further shaped by growing demand for multi-material compatibility and machines that support large-scale infrastructure development across diverse geographies.
Recent Developments
- In February 2025, Federal Signal Corporation finalized its acquisition of Hog Technologies, a key producer of road-marking and line-removal equipment.
- In May 2025, Safety Marking (SMC) acquired Straight Line Industries, strengthening its pavement-marking operations across the Northeastern United States.
- In 2023, Automark Industries introduced a GPS-enabled twin-gun road marking machine designed to improve lane precision and boost operational efficiency.
- In February 2025, Aebi Schmidt Group launched the EL+ pavement striping truck, offering contractors and municipalities a standardized and efficient marking solution.
Market Concentration & Characteristics
The Road Marking Machines Market shows moderate market concentration, with a mix of global and regional players competing across various segments. It is characterized by innovation-driven growth, where product differentiation is largely based on automation level, material compatibility, and operational efficiency. Leading companies focus on integrating GPS, sensor systems, and eco-friendly technologies to meet evolving regulatory and user demands. The market includes established manufacturers with global reach and smaller regional firms offering cost-effective, customized solutions. Demand patterns vary significantly by geography, influenced by infrastructure development, regulatory frameworks, and urban planning priorities. It supports both large-scale highway applications and niche urban projects, creating space for diverse product offerings. The market favors players that provide robust aftersales service, operator training, and modular equipment designs. With a growing emphasis on sustainability and safety, the competitive landscape continues to shift toward companies that can balance technical performance with environmental and cost considerations.
Report Coverage
The research report offers an in-depth analysis based on Type, Application and Region. It details leading market players, providing an overview of their business, product offerings, investments, revenue streams, and key applications. Additionally, the report includes insights into the competitive environment, SWOT analysis, current market trends, as well as the primary drivers and constraints. Furthermore, it discusses various factors that have driven market expansion in recent years. The report also explores market dynamics, regulatory scenarios, and technological advancements that are shaping the industry. It assesses the impact of external factors and global economic changes on market growth. Lastly, it provides strategic recommendations for new entrants and established companies to navigate the complexities of the market.
Future Outlook
- Demand for fully automatic and GPS-integrated machines will continue to grow in large-scale infrastructure projects.
- Adoption of thermoplastic-compatible machines will rise due to preference for durable and reflective road markings.
- Governments will increasingly mandate high-visibility and eco-friendly marking solutions to enhance road safety.
- Urbanization and smart city initiatives will drive demand for compact, portable, and user-friendly machines.
- Manufacturers will focus on developing machines compatible with low-VOC and water-based paints.
- Emerging economies will offer new growth opportunities through transport modernization and connectivity programs.
- Regional customization and modular design will become key to meeting diverse application requirements.
- Strategic partnerships and dealer expansion will improve market access and aftersales support in underserved regions.
- Investment in operator training and digital control systems will enhance machine efficiency and usability.
- The market will see increased competition from regional players offering affordable, semi-automatic machines.


