
Market Overview
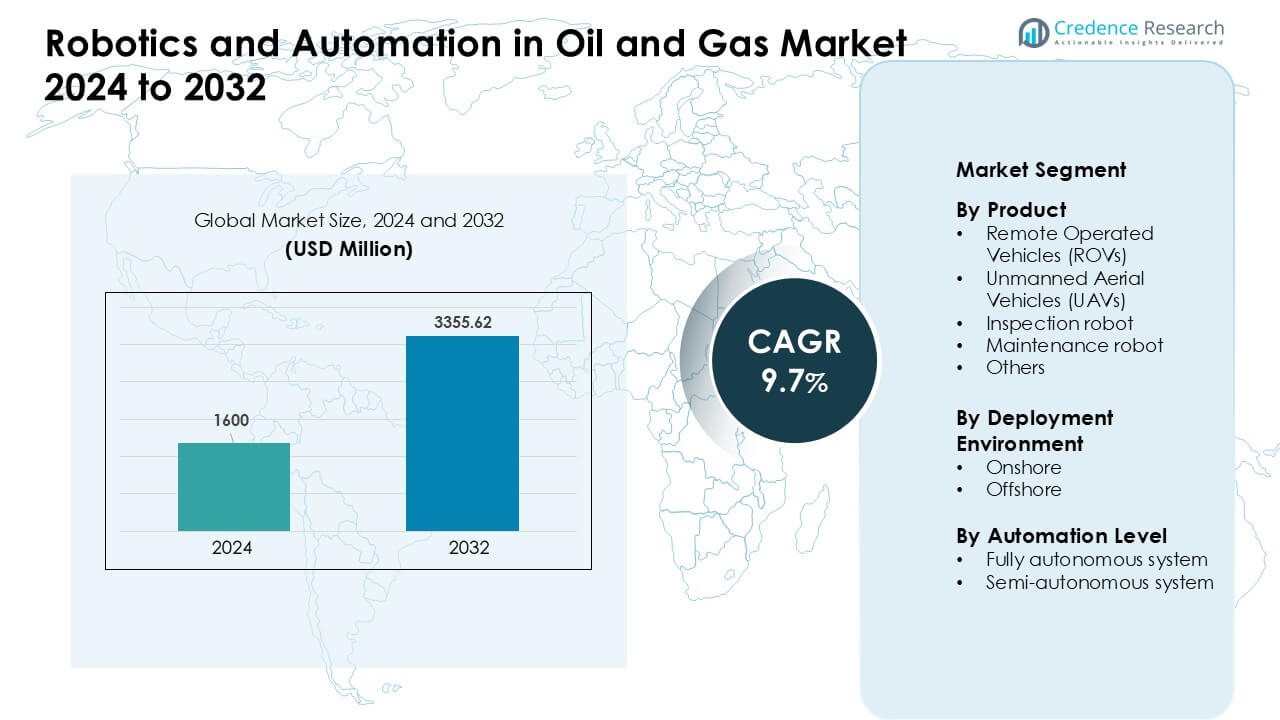
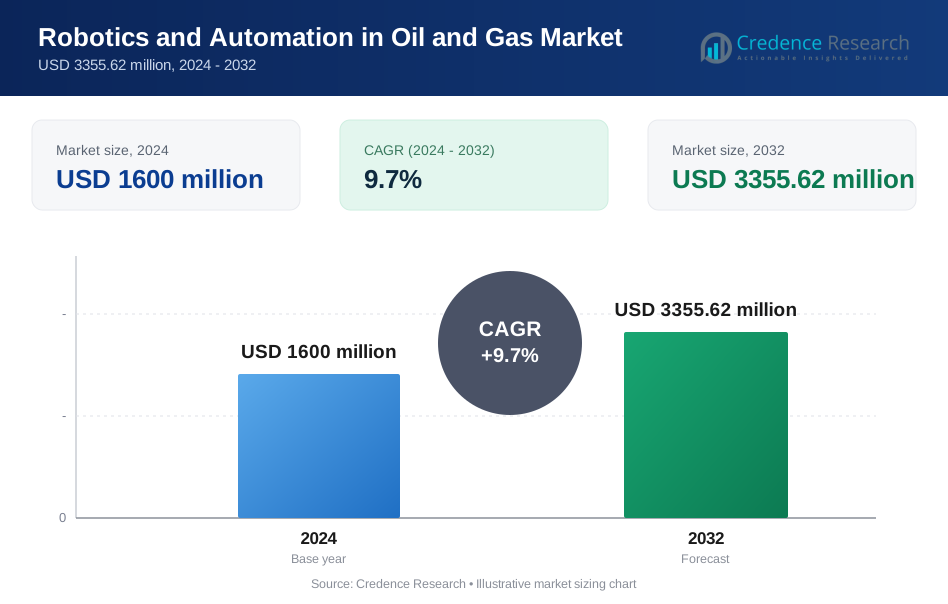
Robotics And Automation In Oil And Gas Market was valued at USD 1600 million in 2024 and is anticipated to reach USD 3355.62 million by 2032, growing at a CAGR of 9.7% during the forecast period.
| REPORT ATTRIBUTE | DETAILS |
|---|---|
| Historical Period | 2020-2023 |
| Base Year | 2024 |
| Forecast Period | 2025-2032 |
| Robotics And Automation In Oil And Gas Market Size 2024 | USD 1600 Million |
| Robotics And Automation In Oil And Gas Market, CAGR | 9.7% |
| Robotics And Automation In Oil And Gas Market Size 2032 | USD 3355.62 Million |
North America led the Robotics and Automation in Oil and Gas Market in 2024 with about 38% share, driven by strong adoption of ROVs, UAVs, and autonomous inspection systems across offshore and pipeline networks. Leading companies such as Blue Ocean Robotics, Schlumberger, Fanuc, ANYbotics, TechnipFMC, Halliburton, Eelume, ABB, Baker Hughes, and Oceaneering strengthened the market through advanced subsea robots, autonomous crawlers, and AI-enabled maintenance tools. These players focused on improving operational safety, reducing downtime, and supporting predictive maintenance across upstream and midstream assets. Their combined innovation and large-scale deployments helped accelerate automation adoption across key production regions.
Market Insights
- The Robotics and Automation in Oil and Gas Market was valued at USD 1600 million in 2024 and is projected to reach USD 3355.62 million by 2032, growing at a CAGR of 9.7 % during 2025–2032.
- Demand grew as ROVs held the largest product share at about 38% in 2024, driven by deepwater operations, aging offshore assets, and rising safety requirements that pushed operators toward automated inspection and maintenance systems.
- Key trends include rapid adoption of AI-driven autonomous robots, expansion of UAV-based pipeline monitoring, and increasing use of digital twins supported by robotic data streams to enhance predictive maintenance.
- Leading companies such as Blue Ocean Robotics, Schlumberger, Fanuc, ANYbotics, TechnipFMC, Halliburton, Eelume, ABB, Baker Hughes, and Oceaneering strengthened competition through advanced subsea robots, autonomous crawlers, and remote operations platforms.
- North America dominated the market with nearly 38% share in 2024, supported by strong offshore activity, while ROVs remained the leading segment globally due to high usage in subsea inspection.
 Market Segmentation Analysis:
By Product
Remote Operated Vehicles held the dominant position in 2024 with about 38% share. Oil and gas operators used ROVs for deepwater inspections, valve checks, and high-risk tasks where human presence is unsafe. Demand increased as offshore fields expanded and subsea assets aged, raising inspection needs. UAVs gained steady use for flare-stack checks and pipeline monitoring, while inspection and maintenance robots advanced through better sensors and modular tools. Growth across product groups came from rising safety demands, lower downtime goals, and strong adoption of digital field operations.
- For instance, Interocean Marine Services Ltd. deployed a mixed fleet of ROVs ranging from micro- to observation-class vehicles plus UAVs to carry out full internal and external structural assessments of six spud cans on a jack-up barge replacing diver-based inspection and enabling inspection of confined underwater spaces with high-resolution sensors.
By Deployment Environment
Offshore sites led the market in 2024 with nearly 57% share. Offshore facilities used robots for subsea mapping, corrosion analysis, leak detection, and structure inspections, which reduced diver-based risk and boosted asset uptime. Onshore fields adopted robots at a faster pace for tank monitoring, perimeter surveillance, and pipeline integrity checks. High offshore share came from harsh conditions, deeper reservoirs, and strict safety rules. Both environments benefited from rising automation budgets, improved ruggedized designs, and wider acceptance of remote operations.
- For instance, work-class ROVs such as heavy-duty inspection vehicles used by major operators have been deployed globally across hundreds of offshore structures; one industry-wide estimate reported over 550 industry work-class ROVs in operation as of 2015, many of which continue operating in oil and gas subsea infrastructure decades later.
By Automation Level
Semi-autonomous systems dominated the automation level segment in 2024 with around 61% share. Operators preferred semi-autonomous robots because they allow human oversight while reducing operational risk and improving precision in inspections and repairs. Fully autonomous systems expanded as AI path-planning, real-time analytics, and onboard decision tools matured. Growth accelerated in hazardous zones where continuous monitoring is required. Market momentum came from lower operational cost, safer workflows, and higher accuracy in repetitive inspection tasks across upstream and midstream operations.
Key Growth Drivers
Rising Focus on Worker Safety and Risk Reduction
Oil and gas operations involve high-risk tasks that expose crews to extreme pressure zones, toxic leaks, subsea hazards, and unstable structural environments. Robotics and automation lower this exposure by shifting inspection, welding, monitoring, and emergency response duties to machines rather than human workers. Companies deploy ROVs, UAVs, and crawlers to inspect flare stacks, risers, deepwater pipelines, and confined spaces without shutdowns or physical entry. Increasing regulatory pressure on incident prevention also drives adoption, as strict safety rules require advanced monitoring and faster fault detection. Automated systems improve consistency in hazardous tasks, reduce downtime linked to manual inspections, and enable better predictive maintenance through real-time data. As offshore platforms age and environmental risks rise, operators prioritize safety-first technology investments. This safety push remains one of the strongest market engines, prompting large operators to replace legacy manual routines with robotic systems across upstream, midstream, and downstream assets.
- For instance, BP deployed a legged robot Spot from Boston Dynamics on an offshore rig in the Gulf of Mexico; Spot was tasked with reading gauges, performing regular walk-throughs of hazardous components, and using built-in gas sensors to detect methane leaks, thereby reducing the need for human personnel to patrol dangerous zones.
Expansion of Offshore and Deepwater Exploration Activities
The shift toward deeper and more complex offshore reservoirs increases demand for advanced robotic tools that can operate where divers and manual equipment cannot. Deepwater operations require high-end ROVs, autonomous underwater vehicles, and remote inspection robots capable of working under extreme pressure and low visibility. As offshore installations expand across regions such as the North Sea, Gulf of Mexico, and West Africa, operators invest heavily in automated inspections to reduce operational risk and improve structural integrity monitoring. Robotics reduce maintenance cost, enhance early failure detection, and extend asset life in these high-intensity zones. With many offshore platforms aging, the need for corrosion checks, structural mapping, and leak detection grows. Autonomous robotic systems also enable continuous surveillance in remote locations, supporting safer and faster decision-making. Deepwater growth combined with high production targets ensures long-term demand for advanced robotics and automation within offshore infrastructure.
- For instance, Equinor has used the AUV HUGIN (from Kongsberg Maritime) variants of HUGIN are rated for seabed mapping at depths up to 6,000 metres, enabling accurate seabed surveys, subsea-infrastructure inspections and pre-installation surveys in deepwater fields without diver intervention.
Increased Digitalization and Predictive Maintenance Adoption
Oil and gas companies continue to accelerate digital transformation to optimize performance and reduce unplanned downtime. Robotics integrated with AI, IoT sensors, and cloud analytics allow operators to gather real-time structural data, perform automated diagnostics, and detect failures long before they escalate. Predictive maintenance systems, powered by robotic inspection data, help reduce repair costs and extend equipment life across pipelines, tanks, rigs, and storage facilities. These systems cut manual survey time and enhance monitoring frequency, leading to improved asset reliability. Growing adoption of digital twins further boosts demand for highly accurate inspection robots that feed live operational data into virtual models. As companies seek to reduce operating expenditure, improve production reliability, and meet environmental compliance goals, automation becomes a core digitalization tool. This strong push toward data-driven asset management continues to expand robotics use across upstream and midstream operations.
Key Trend & Opportunity
Growing Use of AI-Driven Autonomous Robotics
Artificial intelligence accelerates the shift from supervised semi-autonomous tools to fully autonomous robotic systems across the oil and gas value chain. AI enables better obstacle detection, self-navigation in complex subsea environments, and automated anomaly recognition through machine vision. Operators leverage AI-based robots for continuous pipeline inspection, early corrosion detection, and automated reporting, which improves maintenance accuracy. This trend opens new opportunities for robotics manufacturers to develop learning-based systems capable of adapting to changing field conditions. Fully autonomous robots reduce labor dependence, increase inspection frequency, and allow operations in locations that remain inaccessible to human teams. As AI models mature, their integration with robotic platforms supports predictive maintenance, improves safety, and accelerates the shift toward unmanned offshore facilities. The opportunity lies in scaling autonomous systems to cover large assets and reducing intervention times through advanced robotic intelligence.
- For instance, a 2025 study described an AI-driven autonomous robotic system deployed for high-precision subsea pipeline inspection in the North Sea the system successfully identified micro-cracks and anomalies along the pipeline wall using machine-vision algorithms and sonar data.
Expansion of UAV and ROV Applications Across Asset Monitoring
UAVs and ROVs are expanding well beyond basic visual inspection roles, becoming essential tools for thermal imaging, methane detection, digital mapping, and corrosion surveys. UAV fleets now cover large onshore pipeline networks, refineries, and storage terminals, while ROVs handle deepwater risers, subsea cables, and platform structures. Their ability to capture high-resolution data without shutdowns lowers operational cost and increases maintenance efficiency. This expansion creates significant opportunities for service companies offering robotic inspection-as-a-service and for OEMs developing ruggedized drones with long endurance and multi-sensor payloads. Robotic monitoring supports compliance with emission-reduction mandates and environmental monitoring rules, strengthening their role in sustainability initiatives. As energy transition pressures intensify, operators adopt UAVs and ROVs to achieve safer, real-time, and cost-effective asset surveillance across large and distributed infrastructures.
- For instance, a 2024 field test employed a drone equipped with a remote-sensing methane detector (using a tunable-diode laser absorption spectrometer, TDLAS) over a natural-gas pipeline network the drone successfully identified leak plumes and mapped their location, enabling corrective action without pipeline shutdown.
Integration of Robotics with Digital Twins and Remote Operations Centers
The oil and gas industry is rapidly adopting integrated digital ecosystems where robots serve as the primary data collectors for digital twin platforms. Digital twins require continuous real-time inputs, and robotics provide stable, accurate, and high-frequency data streams for structural health monitoring. Remote operations centers use robotic data to make faster decisions, plan proactive maintenance, and simulate operational scenarios. This trend supports the transition toward unmanned platforms and centralized command hubs that control offshore and onshore assets from safe inland locations. The opportunity lies in scaling multi-robot coordination, improving sensor accuracy, and enabling seamless cloud connectivity. As companies cut field crew requirements and optimize operational efficiency, robotics integrated with digital twins become a key enabler for future-ready oilfield operations.
Key Challenge
High Capital Cost and Limited ROI in Early Deployment Stages
Robotics and automation require substantial initial investment, especially for deepwater ROVs, advanced inspection robots, autonomous navigation tools, and integrated analytics platforms. Many small and mid-sized operators face budget constraints, making large-scale robotic adoption challenging. Early deployment often shows slow ROI because savings from reduced labor, downtime, and safety improvements accumulate over longer periods. Integration with existing infrastructure adds extra cost, while specialized teams are needed to maintain and operate robotic systems. Economic volatility in the oil and gas sector, especially during price drops, further delays investment decisions. These financial pressures limit rapid adoption despite clear long-term efficiency benefits, making capital cost a persistent challenge.
Technical Complexity and Harsh Operational Conditions
Robotic systems deployed in oil and gas operations face extreme conditions including high pressure, corrosive environments, debris-filled subsea zones, and unpredictable weather. Designing robots that operate reliably in such conditions requires high engineering precision and frequent maintenance. Navigation challenges in deepwater zones, signal latency, and limited battery endurance affect autonomous performance. Onshore environments also present hazards such as explosive atmospheres and electromagnetic interference. Integrating robots with legacy systems, ensuring cybersecurity of remote operations, and maintaining real-time data transmission add further complexity. These technical limitations slow scaling efforts and increase operational risk for companies adopting advanced robotics.
Regional Analysis
North America
North America led the Robotics and Automation in Oil and Gas Market in 2024 with about 38% share. The United States and Canada adopted ROVs, UAVs, and autonomous inspection tools to support aging pipeline networks, offshore assets in the Gulf of Mexico, and strict federal safety rules. Companies invested in predictive maintenance systems, remote operations centers, and methane-detection drones to comply with emission regulations. Growth also came from strong digitalization programs and higher spending on subsea robotics. The region continues to advance automation to reduce downtime and improve safety across upstream and midstream facilities.
Europe
Europe held nearly 27% share in 2024, driven by strong adoption across the North Sea, Norway, and the UK Continental Shelf. Operators used advanced subsea robots, corrosion-analysis systems, and autonomous monitoring tools to manage mature offshore fields. Strict environmental policies accelerated the use of UAVs for methane tracking and leak detection. European assets also benefited from remote inspection technologies that reduced human presence in hazardous zones. Investments in digital twins and AI-based maintenance systems further pushed automation demand. The region remains a major hub for robotics innovation through strong collaboration between energy companies and technology developers.
Asia-Pacific
Asia-Pacific accounted for about 24% share in 2024 and grew rapidly due to expanding offshore projects in China, India, Malaysia, and Australia. National oil companies deployed ROVs and autonomous systems for subsea mapping, riser inspections, and deepwater exploration. Large refineries and petrochemical plants in the region also increased use of drones for tank inspections and safety monitoring. Rising digitalization efforts and the need for cost-efficient maintenance in high-volume operations further supported adoption. Asia-Pacific continues to invest in automation to meet rising energy demand, improve workforce safety, and strengthen asset reliability in both offshore and onshore assets.
Middle East & Africa
The Middle East & Africa region held roughly 8% share in 2024, supported by strong automation use in major oil producers such as Saudi Arabia, UAE, and Qatar. Operators adopted robotic crawlers, inspection drones, and semi-autonomous systems for pipeline surveillance, refinery maintenance, and flare stack monitoring. Harsh desert conditions and high operational temperatures increased reliance on robotics to reduce risk and ensure uninterrupted production. Africa’s offshore fields in Angola and Nigeria also used ROVs for deepwater asset integrity checks. Ongoing digital oilfield programs continue to drive demand for robotics across upstream and downstream operations.
Latin America
Latin America captured around 6% share in 2024, driven mainly by offshore developments in Brazil and Mexico. Brazil’s deepwater and pre-salt fields used advanced ROV fleets, autonomous subsea systems, and predictive maintenance tools to manage complex reservoirs. Mexico increased drone deployment for pipeline surveillance and refinery inspection to support modernization goals. Regional operators adopted automation to improve safety, reduce downtime, and optimize maintenance across aging infrastructure. Economic reforms and rising investment in offshore projects contributed to steady growth. Despite budget constraints in some markets, robotics adoption continues to expand across large national oil companies.
Market Segmentations:
By Product
- Remote Operated Vehicles (ROVs)
- Unmanned Aerial Vehicles (UAVs)
- Inspection robot
- Maintenance robot
- Others
By Deployment Environment
- Onshore
- Offshore
By Automation Level
- Fully autonomous system
- Semi-autonomous system
By Geography
- North America
- U.S.
- Canada
- Mexico
- Europe
- Germany
- France
- U.K.
- Italy
- Spain
- Rest of Europe
- Asia Pacific
- China
- Japan
- India
- South Korea
- South-east Asia
- Rest of Asia Pacific
- Latin America
- Brazil
- Argentina
- Rest of Latin America
- Middle East & Africa
- GCC Countries
- South Africa
- Rest of the Middle East and Africa
Competitive Landscape
The competitive landscape of the Robotics and Automation in Oil and Gas Market features strong participation from technology providers, robotics manufacturers, and major oilfield service companies. Key players such as Blue Ocean Robotics, Schlumberger, Fanuc, ANYbotics, TechnipFMC, Halliburton, Eelume, ABB, Baker Hughes, and Oceaneering advanced the market through autonomous inspection systems, industrial robots, subsea robotics, and AI-driven maintenance tools. Companies focused on improving safety, reducing operational risk, and enhancing asset integrity across offshore and onshore projects. Strategic partnerships between robotics developers and energy operators accelerated innovation in ROVs, UAVs, and autonomous crawlers. Many players also expanded remote operations capabilities, predictive maintenance platforms, and digital twin integration. Continuous investment in ruggedized designs, multi-sensor payloads, and AI analytics strengthened their competitive positions. The market remains shaped by rapid technological upgrades, service expansions, and strong demand for unmanned inspection and maintenance solutions across global oilfield assets.
Key Player Analysis
- Blue Ocean Robotics
- Schlumberger
- Fanuc
- ANYbotics
- TechnipFMC
- Halliburton
- Eelume
- ABB
- Baker Hughes
- Oceaneering
Recent Developments
- In September 2025, ANYbotics received a strategic investment from Climate Investment (CI), aimed at scaling deployment of ANYmal robots globally especially for hazardous and explosive environments. These underlines growing confidence in autonomous robotic inspection/monitoring solutions for oil & gas, driven by safety and sustainability needs.
- In January 2025, the collaboration with SLB was reaffirmed in a formal update, highlighting integration of ANYbotics’ robotics with SLB’s OptiSite™ facility / equipment‑performance solutions, enabling global-scale deployments for onshore and offshore assets.
- In October 2024, ANYbotics signed a long‑term preferred partnership with SLB (the energy services arm of Schlumberger) to deliver autonomous robotics solutions to the oil & gas sector globally. Their “ANYmal” robots (hazard‑zone certified) will be deployed for inspections, predictive maintenance, and safety monitoring, significantly reducing human‑involvement in routine inspections.
Report Coverage
The research report offers an in-depth analysis based on Product, Deployment Environment, Automation Level and Geography. It details leading market players, providing an overview of their business, product offerings, investments, revenue streams, and key applications. Additionally, the report includes insights into the competitive environment, SWOT analysis, current market trends, as well as the primary drivers and constraints. Furthermore, it discusses various factors that have driven market expansion in recent years. The report also explores market dynamics, regulatory scenarios, and technological advancements that are shaping the industry. It assesses the impact of external factors and global economic changes on market growth. Lastly, it provides strategic recommendations for new entrants and established companies to navigate the complexities of the market.
Future Outlook
- Robotics adoption will rise as operators shift toward unmanned offshore platforms and remote operations.
- Autonomous ROVs and UAVs will expand in deepwater inspection, leak detection, and structural monitoring.
- AI-driven predictive maintenance will reduce downtime and extend asset life across pipelines and refineries.
- Digital twins will integrate more robotic data to improve real-time asset modeling and decision-making.
- Service-based robotic inspection models will grow as companies prefer scalable, low-capex solutions.
- Hazardous-area robots will gain traction for confined-space entry, flare-stack inspection, and tank monitoring.
- Collaborative robots will support onshore maintenance tasks and reduce workforce exposure to high-risk zones.
- Advanced sensing and imaging technologies will enhance corrosion detection and emission tracking.
- Regional adoption will increase as emerging markets invest in automation to strengthen energy security.
- Innovation partnerships between oilfield service firms and robotics developers will accelerate system performance and deployment.
Request a Free Sample
Fill in your details and we'll send you a free sample report.
- Sample data tables & charts
- Research methodology
Need a Custom Version of This Report?
Tailor the scope, geography, or segments to your exact requirements.
- Custom geography or segment scope
- Direct access to our analyst team
Frequently Asked Questions
What is the current market size for Robotics and Automation in Oil and Gas Market, and what is its projected size in 2032?
At what Compound Annual Growth Rate is Robotics and Automation in Oil and Gas Market projected to grow between 2024 and 2032?
Which Robotics and Automation in Oil and Gas Market segment held the largest share in 2024?
What are the primary factors fueling the growth of Robotics and Automation in Oil and Gas Market?
Who are the leading companies in Robotics and Automation in Oil and Gas Market?
Which region commanded the largest share of Robotics and Automation in Oil and Gas Market?
Table of Content
Chapter 1. Report Introduction
- 1.1 Report Description & Purpose
- 1.1.1 Report Title & Market Definition
- 1.1.2 Unique Selling Propositions (USP) & Key Differentiators
- 1.1.3 Value Proposition for Stakeholders
- 1.2 Research Objectives
- 1.2.1 Market Sizing Objectives (Volume & Revenue)
- 1.2.2 Segmentation Objectives
- 1.2.3 Competitive Intelligence Objectives
- 1.2.4 Forecast & Scenario Objectives
- 1.3 Report Scope
- 1.3.1 Robotics and Automation in Oil and Gas Scope – Types & Subtypes Covered
- 1.3.2 Geographic Scope – Regions & Countries Covered
- 1.3.3 Historical Period, Base Year & Forecast Period (2024; forecast to 2032)
- 1.3.4 Inclusions & Exclusions
- 1.4 HS Code & Classification Framework
- 1.5 Currency, Units & Pricing Basis
- 1.6 Target Stakeholders
- 1.7 Limitations & Assumptions
Chapter 2. Executive Summary
- 2.1 Global Robotics and Automation in Oil and Gas Market Snapshot
- 2.1.1 Market Size – Historical (2024) & Forecast (2024-2032) (2024: USD 1600 million → 2032: USD 3355.62 million)
- 2.1.2 Volume & Revenue – Global Totals
- 2.1.3 Key Market Highlights – Top Five Facts
- 2.2 Robotics and Automation in Oil and Gas Market Segmentation Snapshot
- 2.2.1 Market Split by Region – 2024 vs. 2032
- 2.3 Competitive Snapshot
- 2.3.1 Top 10 Players by Revenue Share – 2024
- 2.3.2 Top 10 Players by Volume Share – 2024
- 2.3.3 Recent Strategic Developments (18-Month Summary)
- 2.4 Key Investment Highlights & Strategic Conclusions
Chapter 3. Robotics and Automation in Oil and Gas Market Dynamics & Industry Analysis
- 3.1 Market Overview & Context
- 3.1.1 Robotics and Automation in Oil and Gas Market Position in the Broader Automotive Value Chain
- 3.1.2 OEM vs. Replacement Market Dynamics
- 3.1.3 Market Maturity & Development Stage by Region
- 3.2 Robotics and Automation in Oil and Gas Market Drivers
- 3.3 Robotics and Automation in Oil and Gas Market Restraints & Challenges
- 3.4 Robotics and Automation in Oil and Gas Market Opportunities
- 3.5 Porter's Five Forces Analysis
- 3.5.1 Threat of New Entrants
- 3.5.2 Bargaining Power of Suppliers
- 3.5.3 Bargaining Power of Buyers
- 3.5.4 Threat of Substitutes
- 3.5.5 Competitive Rivalry – Intensity Assessment
- 3.6 Robotics and Automation in Oil and Gas Value Chain Analysis
- 3.6.1 Upstream – Raw Material/Input Suppliers
- 3.6.1.1 Raw Material/Input 1
- 3.6.1.2 Raw Material/Input 2
- 3.6.1.3 Raw Material/Input 3
- 3.6.2 Midstream – Production/Manufacturing/Service Delivery
- 3.6.2.1 Production/Process Overview
- 3.6.2.2 Key Facility Locations & Capacity by Manufacturer
- 3.6.3 Downstream – Distribution & End Consumer
- 3.6.3.1 Primary Channel – B2B/OEM
- 3.6.3.2 Secondary Channels – Dealer, Retail, Online, Direct
- 3.6.4 Value Chain Profitability Analysis
- 3.6.1 Upstream – Raw Material/Input Suppliers
- 3.7 PESTEL Analysis
- 3.7.1 Political Factors
- 3.7.2 Economic Factors
- 3.7.3 Social Factors
- 3.7.4 Technological Factors
- 3.7.5 Environmental Factors
- 3.7.6 Legal Factors
- 3.8 Robotics and Automation in Oil and Gas Supply Chain Analysis
- 3.8.1 Raw Material/Input Supply Risk Assessment
- 3.8.2 Manufacturing Concentration Risk (Geographic Exposure)
- 3.8.3 Trade Disruption Impact Analysis
- 3.9 Regulatory & Policy Landscape
Note: The regulatory and policy landscape section covers regulations based on their applicability to the market, Robotics and Automation in Oil and Gas category, geography, and scope of the study. Only regulatory frameworks with a material impact on operations, compliance, trade, sustainability, or market access are analyzed in detail.
Chapter 4. Key Investment Pockets & Opportunity Analysis
- 4.1 Robotics and Automation in Oil and Gas Market Attractiveness Analysis
- 4.1.1 By Region – Investment Attractiveness Matrix (Volume × CAGR)
- 4.2 Absolute Revenue Growth Opportunity
- 4.2.1 By Region – Absolute USD Growth Through 2032
- 4.3 Incremental Volume Opportunity
- 4.3.1 By Region – Incremental Volume Through 2032
- 4.3.2 Segment – Incremental Volume
- 4.4 Emerging Submarket Opportunity Deep Dive (Subject to Applicability)
- 4.5 Emerging Market Opportunity Scorecards
- 4.5.1 United States
- 4.5.2 Europe
- 4.5.3 Asia
- 4.5.4 Middle East & Africa
Note: Emerging Market Opportunity Scorecards will be included based on relevance and strategic importance. Regions listed are indicative and may vary depending on data availability and market dynamics.
Chapter 5. Robotics and Automation in Oil and Gas Import-Export Analysis & Trade Flows
- 5.1 Global Trade Overview
- 5.1.1 Global Export Value by Country (2024)
- 5.1.2 Global Export Volume by Country (2024)
- 5.1.3 Global Import Value by Country (2024)
- 5.1.4 Global Import Volume by Country (2024)
- 5.1.5 Net Trade Balance by Country (2024)
- 5.2 Export Analysis – Segment
- 5.2.1 Type 1 (HS Code)
- 5.2.2 Type 2 (HS Code)
- 5.2.3 Type 3 (HS Code)
- 5.2.4 Type 4 (HS Code)
- 5.2.5 Type 5 (HS Code)
- 5.3 Import Analysis – Segment
- 5.3.1 Type 1 (HS Code)
- 5.3.2 Type 2 (HS Code)
- 5.3.3 Type 3 (HS Code)
- 5.3.4 Type 4 (HS Code)
- 5.3.5 Type 5 (HS Code)
- 5.4 Average Unit Trade Prices
- 5.4.1 Average Export Price – Segment & Country
- 5.4.2 Average Import Price – Segment & Source Country
- 5.4.3 Price Trends (2024)
- 5.5 Key Trade Route Analysis
- 5.5.1 Trade Route 1
- 5.5.2 Trade Route 2
- 5.5.3 Trade Route 3
- 5.5.4 Trade Route 4
- 5.5.5 Trade Route 5
- 5.6 Trade Policy Impact Assessment
- 5.6.1 US Anti-Dumping & Section 301 Tariffs
- 5.6.2 EU Customs Union Impact
- 5.6.3 Major Free Trade Agreements
- 5.6.4 USMCA Rules of Origin
Note: Trade policy analysis will be included only where relevant to the Robotics and Automation in Oil and Gas market.
Chapter 6. Competitive Landscape & Company Benchmarking
- 6.1 Robotics and Automation in Oil and Gas Market Concentration & Structure
- 6.1.1 Herfindahl-Hirschman Index (HHI) – vs. 2024
- 6.1.2 Tier 1, Tier 2 & Tier 3 Market Structure
- 6.1.3 Global, Regional & Local Player Dynamics
- 6.2 Robotics and Automation in Oil and Gas Market Share Analysis – 2024
- 6.2.1 Global Revenue Share by Company
- 6.2.2 Global Volume Share by Company
- 6.2.3 Regional Revenue Share
- 6.2.4 Market Share Evolution ( vs. 2024)
- 6.2.5 OEM Segment Share by Company
- 6.2.6 Replacement Segment Share by Company
- 6.3 Production/Delivery Capacity & Facility Analysis
- 6.3.1 Global Installed Capacity
- 6.3.2 Capacity Utilization Rates
- 6.3.3 Production/Output Volume
- 6.3.4 Facility Locations & Capacity Map
- 6.3.5 Planned Capacity Additions
- 6.4 Robotics and Automation in Oil and Gas Competitive Benchmarking Matrix
- 6.4.1 Revenue, Volume, CAGR & Profitability Comparison
- 6.4.2 Channel Revenue Mix
- 6.4.3 Geographic Revenue Exposure
- 6.4.4 R&D Intensity
- 6.4.5 Sustainability Maturity
- 6.5 Strategic Developments in Robotics and Automation in Oil and Gas (Last 24 Months)
- 6.5.1 Mergers, Acquisitions & Divestments
- 6.5.2 New Robotics and Automation in Oil and Gas Launches
- 6.5.3 Facility Expansions
- 6.5.4 Strategic Alliances, Joint Ventures & Partnerships
- 6.5.5 Distribution Expansion & Market Entry
- 6.5.6 Sustainability & ESG Initiatives
- 6.6 Competitive Strategy Mapping
- 6.6.1 Leader, Challenger, Follower & Niche Classification
- 6.6.2 Pricing Strategy Comparison
- 6.6.3 Channel Strategy Matrix
Note: Strategic developments are included based on their materiality and the availability of reliable information.
Chapter 7. Global Robotics and Automation in Oil and Gas Market – By Distribution Channel
- 7.1 Segment Overview
- 7.1.1 Volume & Revenue Split by Channel (2024 & 2032)
- 7.1.2 Channel Mix Evolution (2024-2032)
Chapter 8. Regional Market Analysis – Global Overview
- 8.1 Global Regional Overview
- 8.1.1 Regional Volume Share
- 8.1.2 Regional Revenue Share
- 8.1.3 Regional Volume by Region
- 8.1.4 Regional Revenue by Region
- 8.1.5 Regional Forecast Through 2032
- 8.2 Cross-Regional Segment Analysis
- 8.2.1 By Distribution Channel
- 8.2.2 By Brand/Price Tier
Chapter 9. North America Robotics and Automation in Oil and Gas Market
- 9.1 United States
- 9.2 Canada
- 9.3 Mexico
Chapter 10. Europe Robotics and Automation in Oil and Gas Market
- 10.1 Germany
- 10.2 France
- 10.3 Italy
- 10.4 United Kingdom
- 10.5 Spain
- 10.6 Poland
- 10.7 Russia
- 10.8 Netherlands
- 10.9 Belgium
- 10.10 Sweden
- 10.11 Denmark
- 10.12 Norway
- 10.13 Rest of Europe
Chapter 11. Asia Pacific Robotics and Automation in Oil and Gas Market
- 11.1 China
- 11.2 India
- 11.3 Japan
- 11.4 South Korea
- 11.5 Thailand
- 11.6 Indonesia
- 11.7 Vietnam
- 11.8 Malaysia
- 11.9 Australia
- 11.10 Rest of Asia Pacific
Chapter 12. Latin America Robotics and Automation in Oil and Gas Market
- 12.1 Brazil
- 12.2 Argentina
- 12.3 Colombia
- 12.4 Chile
- 12.5 Rest of Latin America
Chapter 13. Middle East Robotics and Automation in Oil and Gas Market
- 13.1 Saudi Arabia
- 13.2 United Arab Emirates
- 13.3 Turkey
- 13.4 Israel
- 13.5 Iran
- 13.6 Rest of the Middle East
Chapter 14. Africa Robotics and Automation in Oil and Gas Market
- 14.1 South Africa
- 14.2 Egypt
- 14.3 Nigeria
- 14.4 Morocco
- 14.5 Rest of Africa
Chapter 15. Robotics and Automation in Oil and Gas Company Profiles
- 15.1 [Company 01]
- 15.1.1 Company Overview
- 15.1.2 Key Management Personnel
- 15.1.3 Products & Services Portfolio
- 15.1.4 Financial Performance
- 15.1.5 Key Market Focus & Geographic Presence
- 15.1.6 Recent Developments & Strategic Initiatives
Note: The company profile list is preliminary and may change based on research findings, market developments, data availability, and client requirements.
Chapter 16. Appendices
- Appendix A – List of Abbreviations & Acronyms
- Appendix B – Industry Classification Code Reference – Full Series
- Appendix C – Production & Capacity Data Tables
- Appendix D – End-Use & Demand Base Tables
- Appendix E – Consumption & Replacement Rate Assumptions
- Appendix F – ASP Reference Tables
- Appendix G – Manufacturing & Facility Database
- Appendix H – Import-Export Data Tables
- Appendix I – Regulatory Summary Tables
- Appendix J – Primary Research Participant List (Anonymized)
- Appendix K – Primary Research Questionnaire Framework
- Appendix L – Data Sources & Bibliography
- Appendix M – Market Size Divergence & Source Comparison
Chapter 17. Research Methodology
- 17.1 Research Framework & Philosophy
- 17.2 Secondary Research – Sources, Hierarchy & Data Extraction
- 17.3 Data Modeling – Bottom-Up & Top-Down Market Sizing
- 17.4 Primary Research – Stakeholder Framework, LOI & Sample Sizes
- 17.5 Forecast Methodology – Regression, Scenario & Sensitivity Analysis
- 17.6 Quality Control – Four-Layer Validation Framework
- 17.7 Limitations & Standard Assumptions
- 17.8 Disclaimer
