
Market Overview
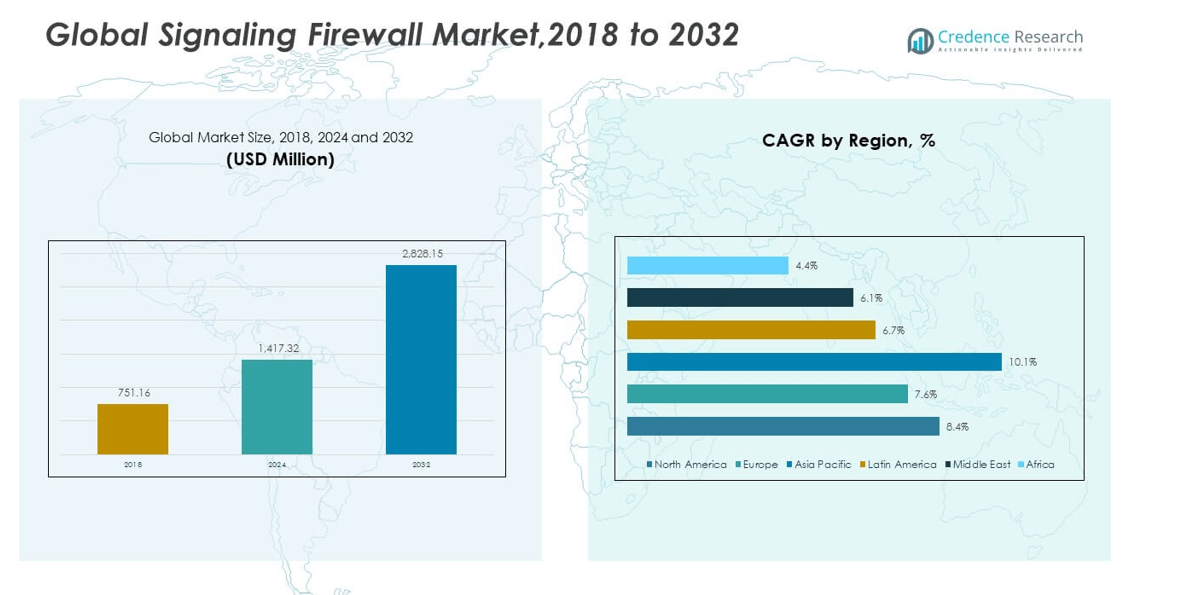
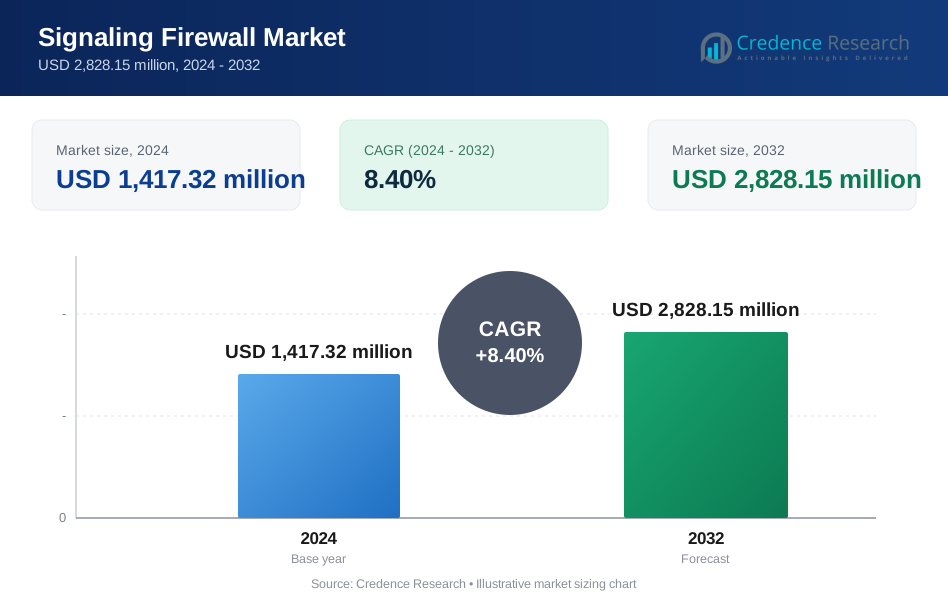
The Global Signaling Firewall Market size was valued at USD 751.16 million in 2018 to USD 1,417.32 million in 2024 and is anticipated to reach USD 2,828.15 million by 2032, at a CAGR of 8.40% during the forecast period.
| REPORT ATTRIBUTE | DETAILS |
|---|---|
| Historical Period | 2020-2023 |
| Base Year | 2024 |
| Forecast Period | 2025-2032 |
| Signaling Firewall Market Size 2024 | USD 1,417.32 million |
| Signaling Firewall Market, CAGR | 8.40% |
| Signaling Firewall Market Size 2032 | USD 2,828.15 million |
The market grows due to rising mobile data traffic and signaling attacks. Telecom operators face higher risks from fraud, spam, and network misuse. Signaling firewalls protect SS7, Diameter, and 5G signaling layers. Operators deploy these solutions to secure voice, messaging, and data services. Cloud-based networks increase exposure to signaling threats. Regulatory pressure pushes operators to strengthen network security. Vendors deliver advanced analytics and real-time threat detection. Automation improves response speed and lowers operational risk. These factors support steady enterprise and carrier adoption worldwide.
North America leads due to early 5G deployment and strong cybersecurity spending. Europe follows with strict data protection and telecom security rules. Asia Pacific emerges as the fastest-growing region. Rapid mobile subscriber growth raises signaling traffic across networks. Countries like China, India, and South Korea expand 5G infrastructure. Operators invest to secure roaming and interconnect traffic. The Middle East gains traction through digital transformation programs. Africa shows gradual adoption with network modernization efforts. These regional dynamics shape global demand patterns.
Market Insights:
- The Global Signaling Firewall Market size was valued at USD 751.16 million in 2018, reached USD 1,417.32 million in 2024, and is projected to reach USD 2,828.15 million by 2032, growing at a CAGR of 8.40% during the forecast period.
- North America leads with about 43.8% share due to early 5G rollout and strong security spending, followed by Europe at nearly 27.5% driven by strict data protection rules, while Asia Pacific holds around 20.3% supported by large subscriber bases.
- Asia Pacific is the fastest-growing region with over 10% CAGR and about 20.3% share, driven by rapid 5G expansion, mobile data growth, and network modernization in China, India, and South Korea.
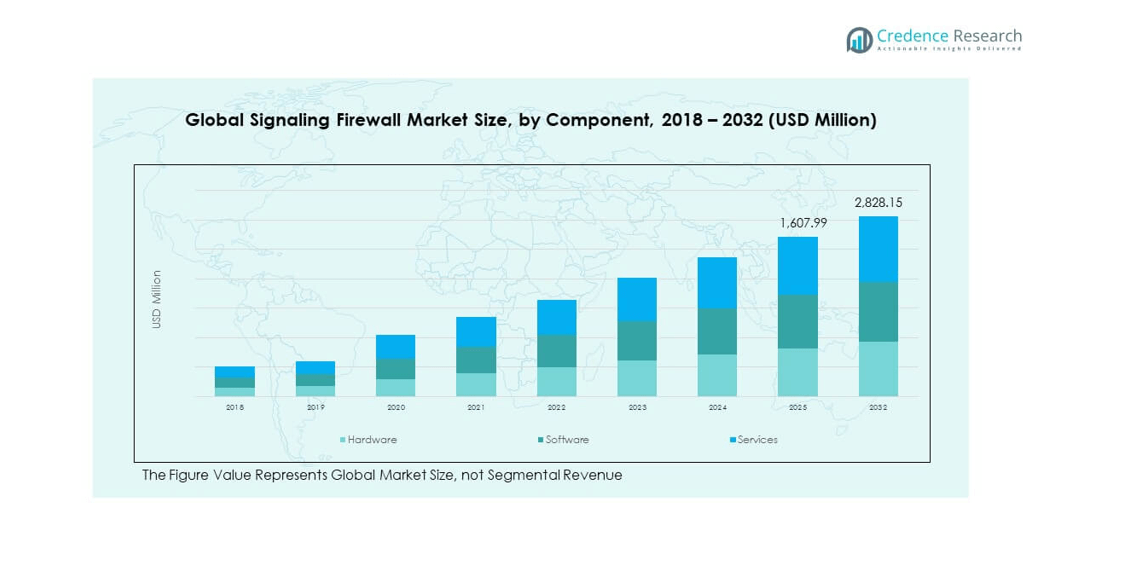
- By component, software accounts for the largest share at roughly 45% due to demand for real-time threat detection and protocol control across SS7, Diameter, and 5G networks.
- Hardware holds about 30% share, while services represent nearly 25%, supported by deployment, integration, and managed security requirements across telecom operators.
Market Drivers:
Rising Signaling Attacks Across Legacy And Next Generation Mobile Networks
The Global Signaling Firewall Market gains momentum from rising signaling threats across telecom networks. Mobile operators face fraud, spoofing, and location tracking risks. SS7 and Diameter vulnerabilities remain active in many regions. 5G expansion increases signaling complexity and attack exposure. Operators deploy firewalls to protect core network layers. These solutions secure voice, messaging, and data services. Regulators push firms to strengthen network defenses. Security investment stays critical for operator trust.
- For instance, Nokia reported that its signaling firewall platforms inspect millions of signaling messages per second across live mobile cores, helping operators block location tracking and SMS fraud attempts at scale.
Expansion Of Mobile Roaming And Interconnect Traffic Volumes
International roaming traffic grows across consumer and enterprise users. Interconnect signaling flows rise between domestic and foreign operators. Fraud risks increase through cross-border signaling misuse. Firewalls monitor and filter roaming signaling messages. Operators rely on policy control to ensure safe interworking. The Global Signaling Firewall Market supports secure roaming operations. Real-time inspection improves network visibility. This factor sustains long-term firewall demand.
- For instance, BICS has disclosed that its global roaming network processes up to 15 billion signaling transactions and over 3.4 billion data records daily, requiring continuous firewall enforcement to detect abnormal SS7 and Diameter signaling patterns.
Strict Telecom Security Regulations And Compliance Requirements
Governments enforce stricter telecom security frameworks worldwide. Data privacy laws increase accountability for signaling breaches. Operators must protect subscriber identity and location data. Signaling firewalls help meet lawful interception requirements. Compliance audits demand continuous threat monitoring. The Global Signaling Firewall Market aligns with regulatory expectations. Vendors deliver compliance-ready security architectures. Policy enforcement supports wider adoption.
Growth Of Cloud-Native And Virtualized Core Networks
Telecom cores shift toward cloud-native architectures at scale. Virtualized networks expand signaling attack surfaces. Software-based cores require advanced security layers. Firewalls integrate with virtual network functions smoothly. Automation improves threat response speed and accuracy. The Global Signaling Firewall Market supports digital core protection. Scalability becomes vital for traffic growth. Cloud adoption reinforces security spending.
Market Trends:
Adoption Of AI-Based Analytics For Signaling Threat Detection
Vendors embed artificial intelligence within firewall platforms. Machine learning improves anomaly detection accuracy. Systems analyze signaling patterns in real time. Predictive models reduce false alerts. Automation supports faster mitigation actions. The Global Signaling Firewall Market benefits from smarter security tools. Operators prefer proactive defense approaches. Analytics-driven platforms gain preference.
- For instance, Palo Alto Networks integrates AI-driven analytics that analyze trillions of security events annually across platforms, enabling telecom operators to detect signaling anomalies faster than rule-based systems.
Shift Toward Centralized And Unified Signaling Security Platforms
Operators consolidate multiple signaling security tools. Unified platforms manage SS7, Diameter, and 5G signaling. Centralized dashboards improve network visibility. Operational efficiency improves through single-vendor solutions. Cost control drives consolidation decisions. The Global Signaling Firewall Market reflects this convergence trend. Simplified management supports faster deployment. Unified security architectures gain traction.
- For instance, Cisco offers centralized security management through platforms like Cisco Security Cloud Control and Cisco Network Services Orchestrator (NSO), which facilitate network automation and policy enforcement across diverse network environments. These solutions enable service providers and large enterprises, including global tier-1 operators, to orchestrate services and manage thousands of physical and virtual devices within a unified management framework, improving operational efficiency and security posture.
Increasing Deployment Of Managed And Security-As-A-Service Models
Telecom firms adopt managed security services steadily. Outsourcing reduces internal operational burden. Vendors offer cloud-hosted firewall solutions. Subscription models support flexible scaling needs. Smaller operators gain access to advanced security. The Global Signaling Firewall Market expands through service-based models. Managed services improve response consistency. Recurring revenue attracts vendors.
Integration With Broader Telecom Cybersecurity Ecosystems
Signaling firewalls integrate with fraud management systems. Interoperability improves across security layers. Orchestration platforms enhance coordination between tools. Data sharing strengthens threat intelligence accuracy. Operators seek end-to-end protection frameworks. The Global Signaling Firewall Market aligns with ecosystem integration. Holistic security strategies gain importance. Cross-platform compatibility becomes standard.
Market Challenges Analysis:
High Deployment Complexity Across Multi-Vendor Telecom Environments
Telecom networks operate with diverse vendor equipment. Integration challenges slow firewall deployment timelines. Legacy systems lack standardized signaling interfaces. Customization increases implementation costs. Skilled security personnel remain limited in many regions. The Global Signaling Firewall Market faces adoption delays. Testing and validation require long cycles. Operational risk concerns affect decisions.
Cost Sensitivity Among Small And Regional Network Operators
Smaller operators face strong budget constraints. Advanced firewall solutions require high upfront investment. Return justification becomes difficult for low-traffic networks. Operational expenses rise with continuous monitoring needs. Managed services reduce cost but limit control. The Global Signaling Firewall Market must address affordability gaps. Pricing flexibility remains limited. Cost barriers slow adoption in emerging markets.
Market Opportunities:
Expansion Of 5G Standalone Networks And IoT Connectivity
5G standalone cores increase signaling volumes sharply. IoT devices generate massive signaling events. Network slicing adds security complexity. Firewalls protect machine-to-machine communications. Operators require scalable security frameworks. The Global Signaling Firewall Market supports secure 5G growth. IoT security creates new revenue streams. Next-generation networks drive opportunity.
Rising Demand From Emerging Telecom Markets
Developing regions expand mobile infrastructure rapidly. Subscriber growth increases signaling traffic exposure. Governments invest in national digital networks. Security adoption rises with modernization projects. Local operators seek carrier-grade protection. The Global Signaling Firewall Market gains traction in emerging economies. Vendor partnerships support deployment. Long-term growth potential remains strong.
Market Segmentation Analysis:
By Component
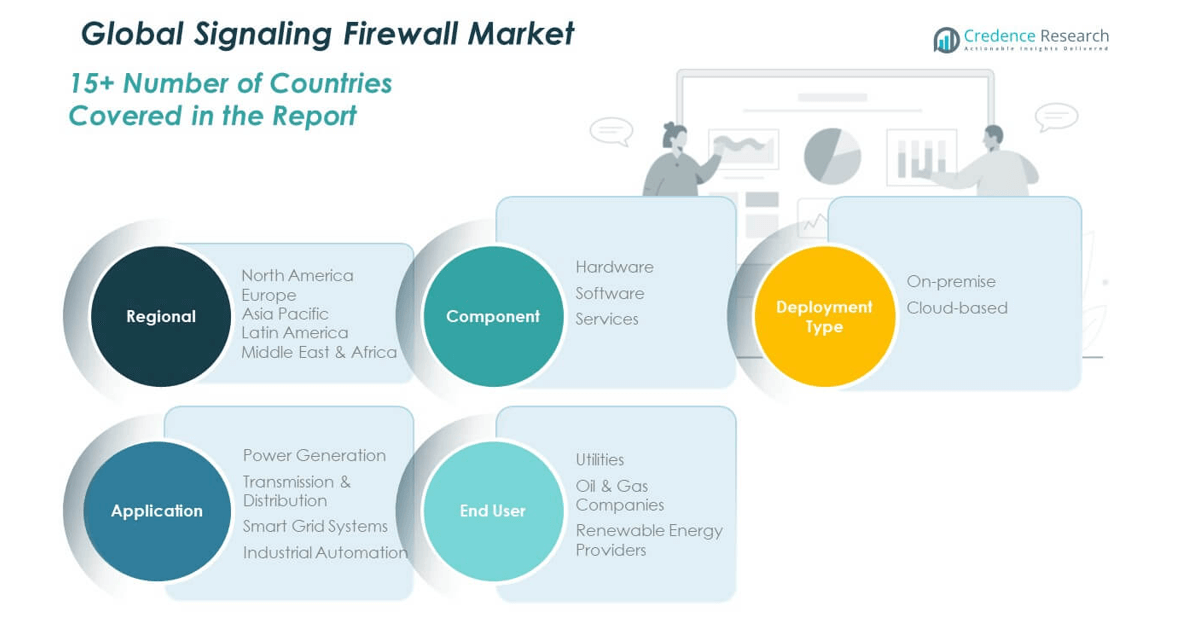
Hardware, software, and services form the core structure of this segment. Hardware supports secure signaling gateways and high-throughput traffic control. Software delivers protocol inspection, policy control, and threat detection features. Service offerings cover deployment, integration, and ongoing support needs. Operators rely on software upgrades to address evolving threats. Services gain importance due to complex network environments. The Global Signaling Firewall Market reflects balanced demand across these components. Each element supports stable and secure signaling operations.
- For instance, Fortinet delivers carrier-grade firewall appliances capable of multi-terabit throughput while supporting continuous software updates and managed security services.
By Deployment Type
On-premise deployment remains relevant for operators with legacy infrastructure. This model offers full control over security policies and data flow. Large carriers prefer this approach for core network protection. Cloud-based deployment gains traction due to scalability needs. Virtualized networks favor flexible and faster rollout models. Cloud options reduce capital burden for operators. Hybrid strategies also emerge across regions. Deployment choice depends on network scale and security priorities.
- For instance, Ericsson supports cloud-native signaling security functions that deploy on Kubernetes-based telecom clouds, enabling operators to scale protection dynamically with traffic demand.
By Application
Power generation networks require secure signaling for operational continuity. Transmission and distribution systems depend on protected communication layers. Smart grid systems demand real-time and secure signaling exchange. Industrial automation uses signaling protection for connected assets. Each application faces rising cyber risk exposure. Firewalls ensure system availability and reliability. Application diversity broadens addressable demand. Secure signaling supports critical infrastructure stability.
By End User
Utilities represent the largest end-user group due to network scale. Oil and gas companies adopt firewalls for secure operational communications. Renewable energy providers increase adoption with digital grid expansion. These users prioritize uptime and data integrity. Security investment aligns with infrastructure modernization goals. End-user demand varies by regulatory exposure. Sector-specific risks shape buying behavior. This segmentation drives tailored solution development.
Segmentation:
- By Component
- Hardware
- Software
- Services
- By Deployment Type
- On-premise
- Cloud-based
- By Application
- Power Generation
- Transmission & Distribution
- Smart Grid Systems
- Industrial Automation
- By End User
- Utilities
- Oil & Gas Companies
- Renewable Energy Providers
- By Region
- North America
- U.S.
- Canada
- Mexico
- Europe
- Germany
- France
- U.K.
- Italy
- Spain
- Rest of Europe
- Asia Pacific
- China
- Japan
- India
- South Korea
- South-east Asia
- Rest of Asia Pacific
- Latin America
- Brazil
- Argentina
- Rest of Latin America
- Middle East & Africa
- GCC Countries
- South Africa
- Rest of the Middle East and Africa
- North America
Regional Analysis:
North America
The North America Global Signaling Firewall Market size was valued at USD 332.19 million in 2018 to USD 620.36 million in 2024 and is anticipated to reach USD 1,241.27 million by 2032, at a CAGR of 8.4 during the forecast period. North America holds around 43.8% market share in 2024, reflecting its leadership position. The region benefits from advanced telecom infrastructure and early 5G adoption. Operators prioritize signaling security to protect large subscriber bases. Regulatory oversight strengthens network protection requirements. Cloud-native core networks increase signaling exposure. Vendors maintain strong regional presence. The Global Signaling Firewall Market remains driven by sustained carrier investment.
Europe
The Europe Global Signaling Firewall Market size was valued at USD 214.26 million in 2018 to USD 389.77 million in 2024 and is anticipated to reach USD 732.51 million by 2032, at a CAGR of 7.6 during the forecast period. Europe accounts for about 27.5% market share in 2024. Strict data protection regulations shape security strategies. Telecom operators focus on subscriber privacy and lawful interception compliance. Network modernization projects support firewall deployment. Cross-border roaming traffic raises signaling risk exposure. Unified security platforms gain preference. The Global Signaling Firewall Market aligns closely with regulatory enforcement across the region.
Asia Pacific
The Asia Pacific Global Signaling Firewall Market size was valued at USD 139.97 million in 2018 to USD 286.98 million in 2024 and is anticipated to reach USD 650.81 million by 2032, at a CAGR of 10.1 during the forecast period. Asia Pacific holds nearly 20.3% market share in 2024. Rapid subscriber growth increases signaling volumes. Large-scale 5G rollouts drive security demand. China, Japan, and South Korea lead regional adoption. India expands through telecom modernization programs. Cloud deployments gain traction among operators. The Global Signaling Firewall Market grows fastest in this region.
Latin America
The Latin America Global Signaling Firewall Market size was valued at USD 34.73 million in 2018 to USD 64.70 million in 2024 and is anticipated to reach USD 113.94 million by 2032, at a CAGR of 6.7 during the forecast period. Latin America represents around 4.6% market share in 2024. Telecom infrastructure upgrades support adoption. Mobile data usage rises steadily across key economies. Operators address signaling fraud risks. Budget constraints influence deployment scale. Managed security models gain acceptance. The Global Signaling Firewall Market expands through gradual investment cycles.
Middle East
The Middle East Global Signaling Firewall Market size was valued at USD 21.13 million in 2018 to USD 36.45 million in 2024 and is anticipated to reach USD 61.42 million by 2032, at a CAGR of 6.1 during the forecast period. The Middle East holds about 2.6% market share in 2024. Government-backed digital initiatives drive telecom growth. GCC countries lead advanced network rollouts. 5G deployment increases signaling complexity. Operators focus on service reliability. Cybersecurity forms a strategic priority. The Global Signaling Firewall Market benefits from modernization programs.
Africa
The Africa Global Signaling Firewall Market size was valued at USD 8.89 million in 2018 to USD 19.06 million in 2024 and is anticipated to reach USD 28.20 million by 2032, at a CAGR of 4.4 during the forecast period. Africa accounts for nearly 1.3% market share in 2024. Mobile penetration continues to expand across regions. Operators modernize networks gradually. Cost sensitivity shapes security investments. Legacy infrastructure limits rapid adoption. International partnerships support capability development. The Global Signaling Firewall Market shows steady long-term potential.
Key Player Analysis:
- Fortinet
- Palo Alto Networks
- Check Point Software Technologies
- Cisco Systems
- Juniper Networks
Competitive Analysis:
The Global Signaling Firewall Market shows moderate concentration with global and regional vendors competing on technology depth and service reach. Leading players focus on protocol expertise across SS7, Diameter, and 5G signaling. Product differentiation centers on real-time threat detection and policy control. Vendors invest in analytics-driven security platforms to improve response accuracy. Strategic partnerships help expand carrier relationships. Pricing strategies balance feature depth and deployment flexibility. Service capability remains a key competitive lever. Innovation speed shapes vendor positioning. The Global Signaling Firewall Market rewards firms with scalable and compliant solutions. Competitive intensity remains steady across regions.
Recent Developments:
- On July 30, 2025, Palo Alto Networks announced its acquisition agreement for CyberArk, the identity security leader, in a landmark $25 billion deal that represents a strategic expansion into identity security. Under the agreement, CyberArk shareholders will receive $45.00 in cash and 2.2005 shares of Palo Alto Networks common stock for each CyberArk share, representing a 26% premium to the unaffected 10-day average daily VWAP as of July 25, 2025. This transformative acquisition will establish Identity Security as a core pillar of Palo Alto Networks' multi-platform strategy, enabling the company to extend privileged identity protection across human, machine, and the emerging wave of autonomous AI agents. The transaction is expected to close during the second half of Palo Alto's fiscal 2026, subject to customary closing conditions and regulatory approvals.
- In July 2025, Palo Alto Networks completed its acquisition of Protect AI for $500 million. This acquisition directly strengthens the company's AI security leadership by integrating Protect AI's forward-thinking technology into Prisma AIRS, the industry's most comprehensive AI security platform. The combined capabilities enable organizations to secure their entire AI ecosystem through model scanning, posture management, AI red teaming, runtime protection, and AI agent security, ensuring businesses can confidently deploy AI-driven innovation while maintaining robust security posture throughout the entire AI lifecycle.
- On September 29, 2025, Check Point and Wiz announced the next milestone in their strategic partnership: the global rollout of a fully integrated solution uniting Check Point's prevention-first cloud network security with Wiz's Cloud-Native Application Protection Platform. Building on the initial partnership announcement from February 2025, this phase brings the integration to general availability, helping enterprises address modern cloud security challenges with real-time visibility, precision, and AI-powered prevention mechanisms. The integrated solution features Wiz's new parallel integration into Check Point Infinity Threat Exposure Management (CTEM), which automates gateway-based remediation flows and converts Wiz alerts into actionable responses on CloudGuard gateways, reducing exposure times from hours to minutes.
- In May 2025, Fortinet announced the launch of its FortiGate 700G Series, a next-generation firewall specifically engineered for modern campus environments. This innovative solution represents a significant advancement in hybrid mesh firewall technology, delivering exceptional performance improvements that set new industry standards. The FortiGate 700G series leverages Fortinet's proprietary Network Processor 7 (NP7) and Security Processor 5 (SP5) ASIC architecture, combined with the FortiOS unified operating system, to achieve up to 7x higher firewall throughput at 164 Gbps and 4x better threat protection at 26 Gbps compared to industry averages. Energy efficiency is another standout feature, with the series consuming 7x fewer watts per Gbps than competitor solutions, making it ideal for sustainability-focused organizations.
Report Coverage:
The research report offers an in-depth analysis based on By Component, By Deployment Type, By Application, By End User, and By Region segments. It details leading market players, providing an overview of their business, product offerings, investments, revenue streams, and key applications. Additionally, the report includes insights into the competitive environment, SWOT analysis, current market trends, as well as the primary drivers and constraints. Furthermore, it discusses various factors that have driven market expansion in recent years. The report also explores market dynamics, regulatory scenarios, and technological advancements that are shaping the industry. It assesses the impact of external factors and global economic changes on market growth. Lastly, it provides strategic recommendations for new entrants and established companies to navigate the complexities of the market.
Future Outlook:
- 5G standalone networks will increase signaling security demand
- AI-based threat detection will gain wider adoption
- Cloud-native deployments will expand across regions
- Managed security services will attract smaller operators
- Unified signaling platforms will replace fragmented tools
- Regulatory focus will strengthen network protection needs
- Emerging markets will contribute incremental growth
- Vendor partnerships will shape regional expansion
- Automation will improve response efficiency
- Interconnect traffic growth will sustain long-term demand
Request a Free Sample
Fill in your details and we'll send you a free sample report.
- Sample data tables & charts
- Research methodology
Need a Custom Version of This Report?
Tailor the scope, geography, or segments to your exact requirements.
- Custom geography or segment scope
- Direct access to our analyst team
Frequently Asked Questions
What is the current market size for Signaling firewall market, and what is its projected size in 2032?
At what Compound Annual Growth Rate is Signaling firewall market projected to grow between 2025 and 2032?
Which is the leading region of the market for signal derivatives?
What are the key drivers for the growth of the Signaling Firewall Market?
Who are the leading companies in Signaling firewall market?
Table of Content
Chapter 1. Report Introduction
- 1.1 Report Description & Purpose
- 1.1.1 Report Title & Market Definition
- 1.1.2 Unique Selling Propositions (USP) & Key Differentiators
- 1.1.3 Value Proposition for Stakeholders
- 1.2 Research Objectives
- 1.2.1 Market Sizing Objectives (Volume & Revenue)
- 1.2.2 Segmentation Objectives
- 1.2.3 Competitive Intelligence Objectives
- 1.2.4 Forecast & Scenario Objectives
- 1.3 Report Scope
- 1.3.1 Signaling Firewall Scope – Types & Subtypes Covered
- 1.3.2 Geographic Scope – Regions & Countries Covered
- 1.3.3 Historical Period, Base Year & Forecast Period (2024; forecast to 2032)
- 1.3.4 Inclusions & Exclusions
- 1.4 HS Code & Classification Framework
- 1.5 Currency, Units & Pricing Basis
- 1.6 Target Stakeholders
- 1.7 Limitations & Assumptions
Chapter 2. Executive Summary
- 2.1 Global Signaling Firewall Market Snapshot
- 2.1.1 Market Size – Historical (2024) & Forecast (2024-2032) (2024: USD 1,417.32 million → 2032: USD 2,828.15 million)
- 2.1.2 Volume & Revenue – Global Totals
- 2.1.3 Key Market Highlights – Top Five Facts
- 2.2 Signaling Firewall Market Segmentation Snapshot
- 2.2.1 Market Split by Region – 2024 vs. 2032
- 2.3 Competitive Snapshot
- 2.3.1 Top 10 Players by Revenue Share – 2024
- 2.3.2 Top 10 Players by Volume Share – 2024
- 2.3.3 Recent Strategic Developments (18-Month Summary)
- 2.4 Key Investment Highlights & Strategic Conclusions
Chapter 3. Signaling Firewall Market Dynamics & Industry Analysis
- 3.1 Market Overview & Context
- 3.1.1 Signaling Firewall Market Position in the Broader Automotive Value Chain
- 3.1.2 OEM vs. Replacement Market Dynamics
- 3.1.3 Market Maturity & Development Stage by Region
- 3.2 Signaling Firewall Market Drivers
- 3.3 Signaling Firewall Market Restraints & Challenges
- 3.4 Signaling Firewall Market Opportunities
- 3.5 Porter's Five Forces Analysis
- 3.5.1 Threat of New Entrants
- 3.5.2 Bargaining Power of Suppliers
- 3.5.3 Bargaining Power of Buyers
- 3.5.4 Threat of Substitutes
- 3.5.5 Competitive Rivalry – Intensity Assessment
- 3.6 Signaling Firewall Value Chain Analysis
- 3.6.1 Upstream – Raw Material/Input Suppliers
- 3.6.1.1 Raw Material/Input 1
- 3.6.1.2 Raw Material/Input 2
- 3.6.1.3 Raw Material/Input 3
- 3.6.2 Midstream – Production/Manufacturing/Service Delivery
- 3.6.2.1 Production/Process Overview
- 3.6.2.2 Key Facility Locations & Capacity by Manufacturer
- 3.6.3 Downstream – Distribution & End Consumer
- 3.6.3.1 Primary Channel – B2B/OEM
- 3.6.3.2 Secondary Channels – Dealer, Retail, Online, Direct
- 3.6.4 Value Chain Profitability Analysis
- 3.6.1 Upstream – Raw Material/Input Suppliers
- 3.7 PESTEL Analysis
- 3.7.1 Political Factors
- 3.7.2 Economic Factors
- 3.7.3 Social Factors
- 3.7.4 Technological Factors
- 3.7.5 Environmental Factors
- 3.7.6 Legal Factors
- 3.8 Signaling Firewall Supply Chain Analysis
- 3.8.1 Raw Material/Input Supply Risk Assessment
- 3.8.2 Manufacturing Concentration Risk (Geographic Exposure)
- 3.8.3 Trade Disruption Impact Analysis
- 3.9 Regulatory & Policy Landscape
Note: The regulatory and policy landscape section covers regulations based on their applicability to the market, Signaling Firewall category, geography, and scope of the study. Only regulatory frameworks with a material impact on operations, compliance, trade, sustainability, or market access are analyzed in detail.
Chapter 4. Key Investment Pockets & Opportunity Analysis
- 4.1 Signaling Firewall Market Attractiveness Analysis
- 4.1.1 By Region – Investment Attractiveness Matrix (Volume × CAGR)
- 4.2 Absolute Revenue Growth Opportunity
- 4.2.1 By Region – Absolute USD Growth Through 2032
- 4.3 Incremental Volume Opportunity
- 4.3.1 By Region – Incremental Volume Through 2032
- 4.3.2 Segment – Incremental Volume
- 4.4 Emerging Submarket Opportunity Deep Dive (Subject to Applicability)
- 4.5 Emerging Market Opportunity Scorecards
- 4.5.1 United States
- 4.5.2 Europe
- 4.5.3 Asia
- 4.5.4 Middle East & Africa
Note: Emerging Market Opportunity Scorecards will be included based on relevance and strategic importance. Regions listed are indicative and may vary depending on data availability and market dynamics.
Chapter 5. Signaling Firewall Import-Export Analysis & Trade Flows
- 5.1 Global Trade Overview
- 5.1.1 Global Export Value by Country (2024)
- 5.1.2 Global Export Volume by Country (2024)
- 5.1.3 Global Import Value by Country (2024)
- 5.1.4 Global Import Volume by Country (2024)
- 5.1.5 Net Trade Balance by Country (2024)
- 5.2 Export Analysis – Segment
- 5.2.1 Type 1 (HS Code)
- 5.2.2 Type 2 (HS Code)
- 5.2.3 Type 3 (HS Code)
- 5.2.4 Type 4 (HS Code)
- 5.2.5 Type 5 (HS Code)
- 5.3 Import Analysis – Segment
- 5.3.1 Type 1 (HS Code)
- 5.3.2 Type 2 (HS Code)
- 5.3.3 Type 3 (HS Code)
- 5.3.4 Type 4 (HS Code)
- 5.3.5 Type 5 (HS Code)
- 5.4 Average Unit Trade Prices
- 5.4.1 Average Export Price – Segment & Country
- 5.4.2 Average Import Price – Segment & Source Country
- 5.4.3 Price Trends (2024)
- 5.5 Key Trade Route Analysis
- 5.5.1 Trade Route 1
- 5.5.2 Trade Route 2
- 5.5.3 Trade Route 3
- 5.5.4 Trade Route 4
- 5.5.5 Trade Route 5
- 5.6 Trade Policy Impact Assessment
- 5.6.1 US Anti-Dumping & Section 301 Tariffs
- 5.6.2 EU Customs Union Impact
- 5.6.3 Major Free Trade Agreements
- 5.6.4 USMCA Rules of Origin
Note: Trade policy analysis will be included only where relevant to the Signaling Firewall market.
Chapter 6. Competitive Landscape & Company Benchmarking
- 6.1 Signaling Firewall Market Concentration & Structure
- 6.1.1 Herfindahl-Hirschman Index (HHI) – vs. 2024
- 6.1.2 Tier 1, Tier 2 & Tier 3 Market Structure
- 6.1.3 Global, Regional & Local Player Dynamics
- 6.2 Signaling Firewall Market Share Analysis – 2024
- 6.2.1 Global Revenue Share by Company
- 6.2.2 Global Volume Share by Company
- 6.2.3 Regional Revenue Share
- 6.2.4 Market Share Evolution ( vs. 2024)
- 6.2.5 OEM Segment Share by Company
- 6.2.6 Replacement Segment Share by Company
- 6.3 Production/Delivery Capacity & Facility Analysis
- 6.3.1 Global Installed Capacity
- 6.3.2 Capacity Utilization Rates
- 6.3.3 Production/Output Volume
- 6.3.4 Facility Locations & Capacity Map
- 6.3.5 Planned Capacity Additions
- 6.4 Signaling Firewall Competitive Benchmarking Matrix
- 6.4.1 Revenue, Volume, CAGR & Profitability Comparison
- 6.4.2 Channel Revenue Mix
- 6.4.3 Geographic Revenue Exposure
- 6.4.4 R&D Intensity
- 6.4.5 Sustainability Maturity
- 6.5 Strategic Developments in Signaling Firewall (Last 24 Months)
- 6.5.1 Mergers, Acquisitions & Divestments
- 6.5.2 New Signaling Firewall Launches
- 6.5.3 Facility Expansions
- 6.5.4 Strategic Alliances, Joint Ventures & Partnerships
- 6.5.5 Distribution Expansion & Market Entry
- 6.5.6 Sustainability & ESG Initiatives
- 6.6 Competitive Strategy Mapping
- 6.6.1 Leader, Challenger, Follower & Niche Classification
- 6.6.2 Pricing Strategy Comparison
- 6.6.3 Channel Strategy Matrix
Note: Strategic developments are included based on their materiality and the availability of reliable information.
Chapter 7. Global Signaling Firewall Market – By Distribution Channel
- 7.1 Segment Overview
- 7.1.1 Volume & Revenue Split by Channel (2024 & 2032)
- 7.1.2 Channel Mix Evolution (2024-2032)
Chapter 8. Regional Market Analysis – Global Overview
- 8.1 Global Regional Overview
- 8.1.1 Regional Volume Share
- 8.1.2 Regional Revenue Share
- 8.1.3 Regional Volume by Region
- 8.1.4 Regional Revenue by Region
- 8.1.5 Regional Forecast Through 2032
- 8.2 Cross-Regional Segment Analysis
- 8.2.1 By Distribution Channel
- 8.2.2 By Brand/Price Tier
Chapter 9. North America Signaling Firewall Market
- 9.1 United States
- 9.2 Canada
- 9.3 Mexico
Chapter 10. Europe Signaling Firewall Market
- 10.1 Germany
- 10.2 France
- 10.3 Italy
- 10.4 United Kingdom
- 10.5 Spain
- 10.6 Poland
- 10.7 Russia
- 10.8 Netherlands
- 10.9 Belgium
- 10.10 Sweden
- 10.11 Denmark
- 10.12 Norway
- 10.13 Rest of Europe
Chapter 11. Asia Pacific Signaling Firewall Market
- 11.1 China
- 11.2 India
- 11.3 Japan
- 11.4 South Korea
- 11.5 Thailand
- 11.6 Indonesia
- 11.7 Vietnam
- 11.8 Malaysia
- 11.9 Australia
- 11.10 Rest of Asia Pacific
Chapter 12. Latin America Signaling Firewall Market
- 12.1 Brazil
- 12.2 Argentina
- 12.3 Colombia
- 12.4 Chile
- 12.5 Rest of Latin America
Chapter 13. Middle East Signaling Firewall Market
- 13.1 Saudi Arabia
- 13.2 United Arab Emirates
- 13.3 Turkey
- 13.4 Israel
- 13.5 Iran
- 13.6 Rest of the Middle East
Chapter 14. Africa Signaling Firewall Market
- 14.1 South Africa
- 14.2 Egypt
- 14.3 Nigeria
- 14.4 Morocco
- 14.5 Rest of Africa
Chapter 15. Signaling Firewall Company Profiles
- 15.1 [Company 01]
- 15.1.1 Company Overview
- 15.1.2 Key Management Personnel
- 15.1.3 Products & Services Portfolio
- 15.1.4 Financial Performance
- 15.1.5 Key Market Focus & Geographic Presence
- 15.1.6 Recent Developments & Strategic Initiatives
Note: The company profile list is preliminary and may change based on research findings, market developments, data availability, and client requirements.
Chapter 16. Appendices
- Appendix A – List of Abbreviations & Acronyms
- Appendix B – Industry Classification Code Reference – Full Series
- Appendix C – Production & Capacity Data Tables
- Appendix D – End-Use & Demand Base Tables
- Appendix E – Consumption & Replacement Rate Assumptions
- Appendix F – ASP Reference Tables
- Appendix G – Manufacturing & Facility Database
- Appendix H – Import-Export Data Tables
- Appendix I – Regulatory Summary Tables
- Appendix J – Primary Research Participant List (Anonymized)
- Appendix K – Primary Research Questionnaire Framework
- Appendix L – Data Sources & Bibliography
- Appendix M – Market Size Divergence & Source Comparison
Chapter 17. Research Methodology
- 17.1 Research Framework & Philosophy
- 17.2 Secondary Research – Sources, Hierarchy & Data Extraction
- 17.3 Data Modeling – Bottom-Up & Top-Down Market Sizing
- 17.4 Primary Research – Stakeholder Framework, LOI & Sample Sizes
- 17.5 Forecast Methodology – Regression, Scenario & Sensitivity Analysis
- 17.6 Quality Control – Four-Layer Validation Framework
- 17.7 Limitations & Standard Assumptions
- 17.8 Disclaimer
