Market Overview
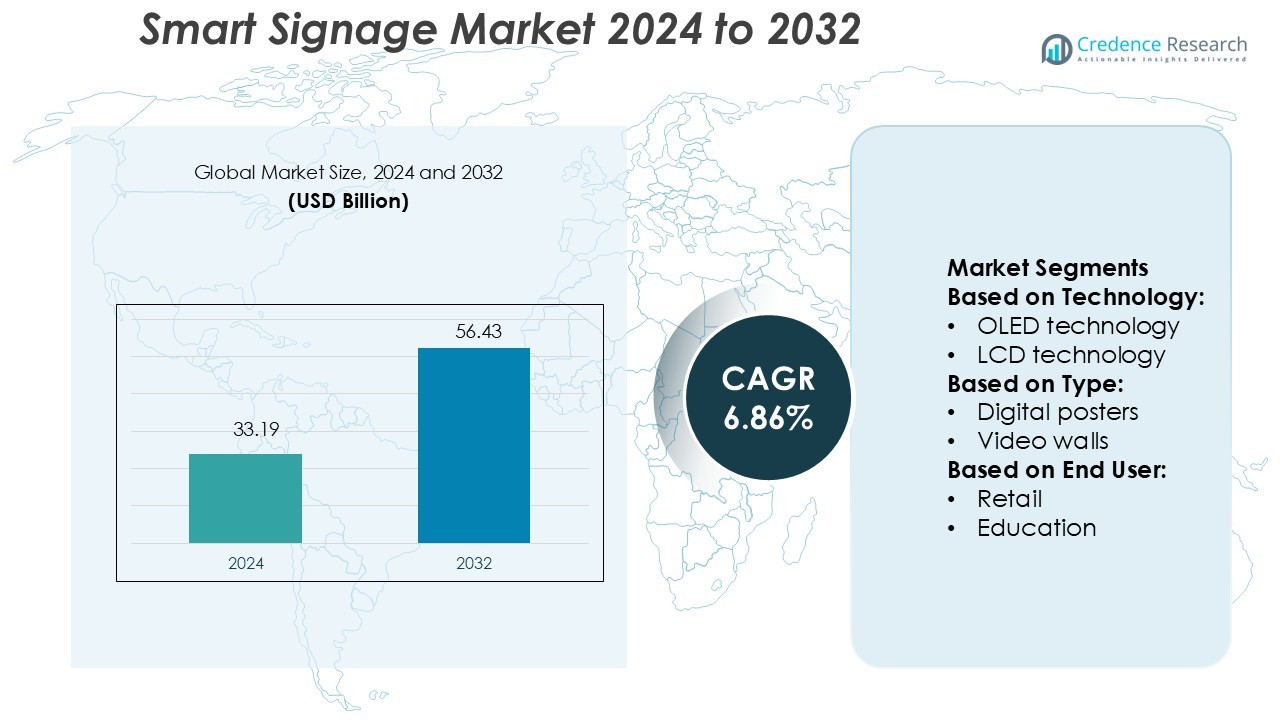
Smart Signage Market size was valued USD 33.19 billion in 2024 and is anticipated to reach USD 56.43 billion by 2032, at a CAGR of 6.86% during the forecast period.
| REPORT ATTRIBUTE |
DETAILS |
| Historical Period |
2020-2023 |
| Base Year |
2024 |
| Forecast Period |
2025-2032 |
| Smart Signage Market Size 2024 |
USD 33.19 Billion |
| Smart Signage Market, CAGR |
6.86% |
| Smart Signage Market Size 2032 |
USD 56.43 Billion |
The smart signage market is driven by major players including Haier Group, Johnson Control, Gira, Google LLC, Honeywell International Inc., Nice Polska Sp. z o.o., Apple Inc., Emerson Electric Co., Panasonic Corporation, and Crestron Electronics, Inc. These companies focus on integrating AI, IoT, and cloud-based solutions to deliver personalized and interactive display experiences. Continuous innovation in energy-efficient OLED and LED technologies strengthens their market position across multiple sectors. North America leads the global market with a 34% share, supported by advanced infrastructure, early technology adoption, and strong investments in smart city projects, making it a key hub for growth and innovation.
Access crucial information at unmatched prices!
Request your sample report today & start making informed decisions powered by Credence Research Inc.!
Download Sample
Market Insights
- The smart signage market was valued at USD 33.19 billion in 2024 and is expected to reach USD 56.43 billion by 2032, growing at a CAGR of 6.86%.
- Growing adoption of AI, IoT, and cloud platforms drives demand for personalized and interactive display experiences across retail, corporate, and transportation sectors.
- Advancements in energy-efficient OLED and LED technologies are shaping product innovation and expanding applications in smart city infrastructure.
- High initial investment and data security concerns remain key restraints, particularly affecting small and medium enterprises.
- North America leads with a 34% market share, followed by Europe and Asia Pacific, while LCD and LED segments hold the dominant share due to their efficiency and wide commercial use.
Market Segmentation Analysis:
By Technology
LED technology dominates the smart signage market, holding the largest share due to its high brightness, long lifespan, and energy efficiency. LED displays deliver superior visibility in both indoor and outdoor environments, making them ideal for retail, transportation hubs, and sports arenas. Advancements in fine-pitch LED and micro-LED solutions are further improving image quality and reducing power use. OLED and LCD technologies continue to serve niche and cost-sensitive applications, while other emerging technologies enhance flexibility in design and installation. The steady adoption of LED signage across multiple industries strengthens its leadership position.
- For instance, Johnson Controls installed more than 200 new surveillance cameras and rebuilt a stadium control-room video-wall hub so operators could monitor all zones from one centralized display bank.
By Type
Video walls account for the dominant share in the smart signage market, driven by their large-scale visual impact and scalability. These displays are widely adopted in transportation hubs, corporate environments, and retail spaces to enable high-resolution, dynamic content delivery. Video walls offer seamless integration with digital networks, supporting real-time content updates and interactive experiences. Transparent displays and digital posters are growing segments, especially in luxury retail and marketing. Interactive kiosks are gaining traction in service-oriented industries, enhancing customer engagement and operational efficiency.
- For instance, Gira launched its touch-display client unit, the “Gira G1,” which features a 7-inch multi-touch TFT screen and supports remote control via a smartphone app. For cost-optimized projects, Gira also offers a more compact “Gira G1 XS” with a 6-inch display.
By End User
Retail represents the leading end-user segment, supported by its strong demand for dynamic in-store advertising and customer engagement solutions. Smart signage in retail improves shopper experience, drives impulse buying, and supports omnichannel marketing strategies. Interactive displays and personalized content delivery give retailers a competitive edge. Corporate, education, and healthcare sectors also increasingly adopt smart signage for communication and wayfinding. Stadiums and government institutions use large-scale displays for public information and event broadcasting, adding to the overall market growth. Retail’s strong return on investment solidifies its dominant share.
Key Growth Drivers
Rising Demand for Interactive Customer Engagement
Smart signage adoption grows as businesses focus on enhancing customer engagement. Retailers, restaurants, and transportation hubs use dynamic displays to share targeted content in real time. Interactive features like touchscreens, facial recognition, and sensor-based responses increase dwell time and customer satisfaction. This capability supports personalized messaging, boosts sales conversions, and improves brand recall. Growing investments in customer experience strategies further accelerate deployment across sectors. Industries view interactive signage as a critical tool to drive foot traffic and improve operational efficiency.
- For instance, Google’s Chrome OS-powered digital signage solution reports that devices experience 26% fewer outages and 34% faster outage resolution compared to other operating systems.
Technological Advancements and Display Innovations
Rapid advancements in display technologies drive market growth. High-resolution OLED, LED, and LCD screens offer superior brightness, energy efficiency, and durability. Integration with AI, IoT, and cloud platforms enables real-time content updates, data analytics, and remote management. These technologies improve scalability and reduce maintenance costs, making smart signage more accessible to businesses of all sizes. Companies also leverage AR and VR features to deliver immersive experiences. This continuous innovation fuels demand across retail, corporate, and entertainment environments.
- For instance, Nice ROBO600 actuator supports sliding gates weighing up to 600 kg and has a speed of 0.18 m/s. To open a four-meter gate in under 10 seconds, the high-speed version, the ROBUS600 HI-SPEED, would be required.
Expanding Use in Public Infrastructure and Smart Cities
The growing smart city ecosystem supports large-scale smart signage installations. Digital billboards, transport hubs, and government service centers rely on connected displays for real-time communication and public information. Integration with sensor networks enables location-based alerts and crowd management. This adoption enhances safety, navigation, and service delivery in urban areas. Governments and city planners increasingly invest in digital infrastructure, driving signage installations. The rising emphasis on efficient communication systems in smart cities further boosts market growth.
Key Trends & Opportunities
Shift Toward Cloud-Based Content Management
The adoption of cloud platforms enables remote content control, reducing operational complexities. Businesses can schedule, modify, and distribute digital content instantly across multiple locations. This flexibility supports quick campaign execution and better audience targeting. Advanced software solutions offer data-driven insights to optimize display performance. Integration with other digital tools enhances overall marketing strategies. Cloud-based management also lowers infrastructure costs, encouraging adoption among SMEs. This trend creates opportunities for service providers offering scalable, secure signage solutions.
- For instance, Emerson’s control systems, strengthened by its acquisition of Mita-Teknik, manage over 60,000 wind turbines globally across more than 50 countries. Emerson has reported that this figure has grown to approximately 65,000 turbines.
Integration of AI and Data Analytics
AI and analytics are transforming smart signage into intelligent communication systems. Businesses use real-time data to deliver context-aware content, improving personalization. Machine learning algorithms help analyze viewer behavior and optimize campaigns. AI also enables predictive maintenance, ensuring uninterrupted display performance. This integration enhances engagement metrics and marketing ROI. Companies adopting AI-driven signage solutions gain a competitive edge in targeted advertising. This growing trend creates new opportunities for AI solution providers and signage manufacturers.
- For instance, Panasonic Connect Co., Ltd., in a joint development with Takamizawa Cybernetics, deployed a walk-through facial recognition ticket gate system at 130 of 134 stations for the Osaka Metro, enhancing transport convenience ahead of the Expo 2025.
Growth in Outdoor and DOOH Advertising
Digital-out-of-home (DOOH) advertising expands rapidly as brands prioritize high-visibility communication. Smart signage allows real-time campaign updates, geo-targeting, and interactive features. These capabilities enhance audience engagement in high-traffic public spaces. Advertisers benefit from increased flexibility, measurable impact, and dynamic storytelling. The surge in programmatic advertising further strengthens DOOH demand. Infrastructure investments in transportation hubs, stadiums, and malls provide new opportunities for signage providers. This trend positions DOOH as a key growth channel in the advertising ecosystem.
Key Challenges
High Initial Investment and Integration Costs
Despite its benefits, smart signage adoption faces barriers from high upfront costs. Hardware, software, installation, and maintenance expenses can strain budgets, especially for SMEs. Integration with existing IT systems often requires additional customization and skilled resources. These factors slow adoption among cost-sensitive industries. Limited access to affordable financing options further compounds the issue. Addressing these investment barriers remains critical for widespread market penetration, particularly in emerging economies.
Data Security and Privacy Concerns
Smart signage systems often process and store user data for personalization and analytics. This raises privacy and security concerns for businesses and consumers. Unauthorized access or data breaches can damage brand trust and violate regulations. Companies must invest in advanced cybersecurity measures and compliance frameworks. Complex data protection requirements can delay deployments or increase operational costs. These concerns may restrain adoption rates, especially in industries handling sensitive information. Ensuring robust data protection remains a key market challenge.
Regional Analysis
North America
North America dominates the smart signage market with a 34% share. Strong digital infrastructure, early adoption of advanced display technologies, and high consumer engagement levels drive market expansion. Retail, corporate, and transportation sectors lead deployments across the U.S. and Canada. Widespread use of AI-driven content and cloud-based control systems further supports growth. Government investments in smart city programs enhance signage applications in public infrastructure. The region also benefits from the presence of major signage technology providers, enabling rapid innovation and market penetration.
Europe
Europe holds a 27% market share, supported by strong regulatory frameworks and digital transformation initiatives. The retail, hospitality, and transportation industries are the largest adopters, particularly in Germany, the U.K., and France. Energy-efficient LED and OLED displays gain traction due to sustainability regulations. Smart city initiatives, such as real-time passenger information systems, further drive growth. Companies increasingly focus on eco-friendly signage solutions, aligning with EU green targets. Technological innovation and government-led digitalization programs ensure steady market development across the region.
Asia Pacific
Asia Pacific accounts for 25% of the smart signage market, showcasing the fastest growth rate. Countries such as China, Japan, South Korea, and India drive demand through large-scale digital transformation. Rapid urbanization, rising retail investments, and expanding transportation infrastructure support deployments. The region sees increasing adoption of AI-enabled and interactive signage in malls, airports, and public venues. Government smart city programs accelerate infrastructure modernization. Affordable hardware and local manufacturing also enhance market accessibility, boosting adoption among SMEs.
Latin America
Latin America captures a 7% market share, supported by rising investments in retail modernization and transportation. Brazil, Mexico, and Argentina lead adoption, focusing on dynamic advertising and real-time communication systems. Cost-effective LED signage gains popularity among regional businesses. Urban development projects and growing tourism contribute to installations in public spaces and commercial hubs. Although the region faces infrastructure and cost barriers, increasing digitalization initiatives are driving steady market expansion across key industries.
Middle East & Africa
The Middle East & Africa region holds a 7% market share, with growth led by smart city projects and tourism expansion. The UAE, Saudi Arabia, and South Africa are key markets driving digital signage investments. Airports, shopping malls, and entertainment complexes adopt advanced display technologies to enhance visitor experiences. Government efforts to build digital economies further stimulate demand. Rising investments in public infrastructure and hospitality support long-term market development, though limited local manufacturing remains a challenge.
Market Segmentations:
By Technology:
- OLED technology
- LCD technology
By Type:
- Digital posters
- Video walls
By End User:
By Geography
- North America
- Europe
- Germany
- France
- U.K.
- Italy
- Spain
- Rest of Europe
- Asia Pacific
- China
- Japan
- India
- South Korea
- South-east Asia
- Rest of Asia Pacific
- Latin America
- Brazil
- Argentina
- Rest of Latin America
- Middle East & Africa
- GCC Countries
- South Africa
- Rest of the Middle East and Africa
Competitive Landscape
The competitive landscape of the smart signage market is shaped by key players such as Haier Group, Johnson Control, Gira, Google LLC, Honeywell International Inc., Nice Polska Sp. z o.o., Apple Inc., Emerson Electric Co., Panasonic Corporation, and Crestron Electronics, Inc. The smart signage market is highly competitive and innovation-driven, with companies focusing on enhancing product capabilities and user experiences. The industry is characterized by rapid technological integration, including AI, IoT, and cloud-based platforms, which enable real-time content delivery and efficient display management. Players are expanding their product portfolios to include high-resolution, energy-efficient OLED and LED solutions to meet growing demand across retail, transportation, and corporate sectors. Strategic partnerships, acquisitions, and R&D investments are key approaches used to strengthen market positioning. The emphasis on smart city projects, immersive advertising, and interactive communication solutions further intensifies competition.
Shape Your Report to Specific Countries or Regions & Enjoy 30% Off!
Key Player Analysis
- Haier Group
- Johnson Control
- Gira
- Google LLC
- Honeywell International Inc.
- Nice Polska Sp. z o.o.
- Apple Inc.
- Emerson Electric Co.
- Panasonic Corporation
- Crestron Electronics, Inc.
Recent Developments
- In May 2025, Daktronics partnered with the University of Delaware to design, manufacture, and install a cutting-edge LED video display at Delaware Diamond, the university’s softball stadium. Engineered with advanced environmental protection, the display is built to perform reliably in the outdoor conditions of Newark.
- In February 2025, NoviSign partnered with BrightSign, LLC, to enhance the flexibility and scalability of its digital signage solutions. This collaboration allows businesses to combine NoviSign’s robust software with the trusted reliability and security of BrightSign’s media players. The partnership ensures complete compatibility across BrightSign’s entire product line, enabling smooth integration and high-performance functionality.
- In February 2025, Samsung Electronics Co., Ltd. partnered with Cielo to revolutionize retail advertising and franchise operations. This strategic collaboration merges Samsung’s VXT display technology with Cielo’s AI-powered platform, offering innovative tools that enhance digital marketing and operational performance.
- In June 2024, ABB launched ReliaHome Smart Panel, a new smart home energy management system. The product, intended for residential projects in the United States and Canada, was developed in partnership with software provider Lumin. The smart panel coordinates home energy assets, enabling energy optimization, circuit scheduling, and real-time control.
Report Coverage
The research report offers an in-depth analysis based on Technology, Type, End-User and Geography. It details leading market players, providing an overview of their business, product offerings, investments, revenue streams, and key applications. Additionally, the report includes insights into the competitive environment, SWOT analysis, current market trends, as well as the primary drivers and constraints. Furthermore, it discusses various factors that have driven market expansion in recent years. The report also explores market dynamics, regulatory scenarios, and technological advancements that are shaping the industry. It assesses the impact of external factors and global economic changes on market growth. Lastly, it provides strategic recommendations for new entrants and established companies to navigate the complexities of the market.
Future Outlook
- Smart signage adoption will accelerate with growing smart city development worldwide.
- AI and IoT integration will enhance real-time personalization and dynamic content delivery.
- Cloud-based platforms will enable remote content control and flexible campaign management.
- Energy-efficient OLED and LED technologies will become standard in new deployments.
- Interactive and touch-enabled displays will drive stronger customer engagement in retail.
- Demand from transportation and public infrastructure sectors will continue to rise.
- Programmatic advertising and DOOH applications will expand rapidly across urban areas.
- Enhanced data analytics will improve targeting accuracy and audience measurement.
- Sustainability and low-power display solutions will gain more industry focus.
- Strategic partnerships and innovation investments will shape future market competition.



