
Market Overview
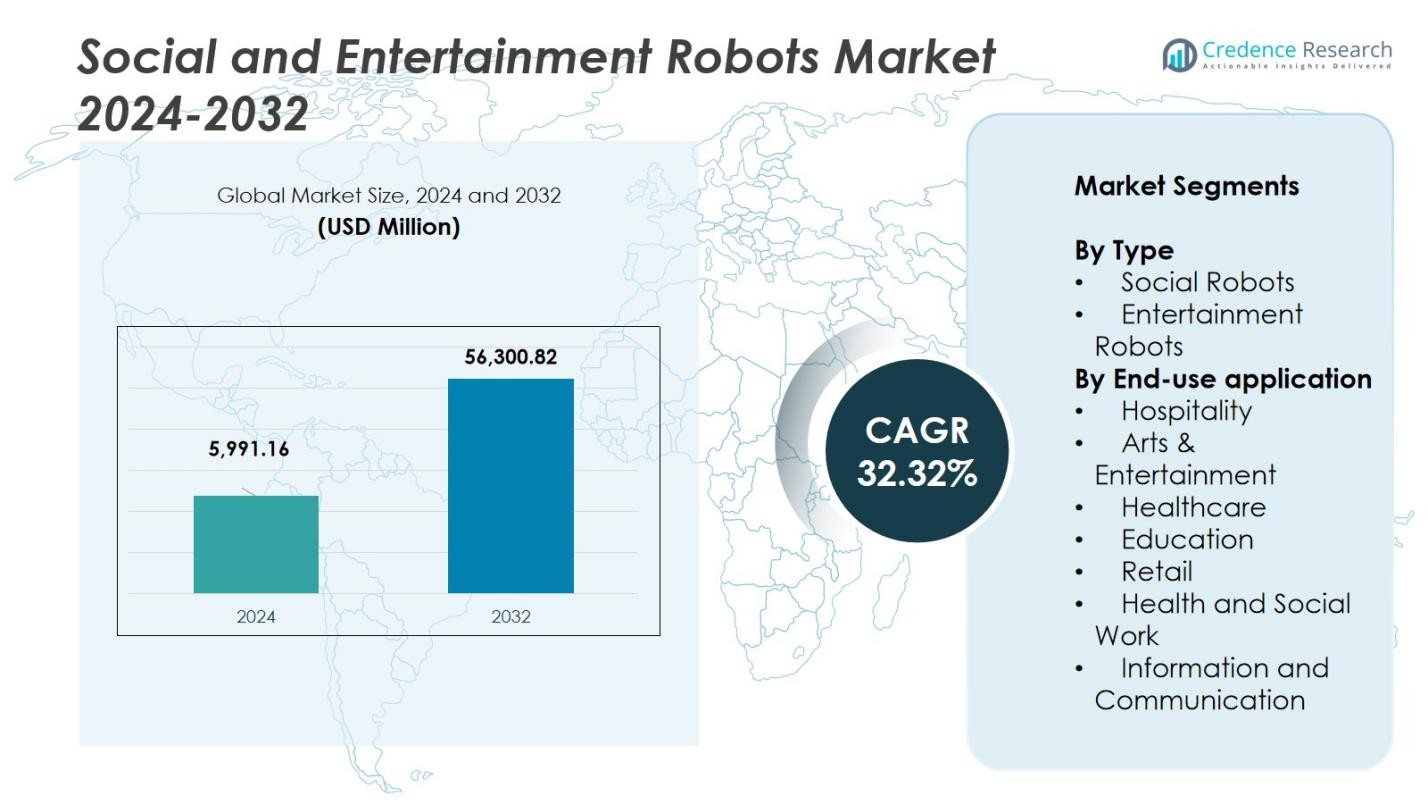
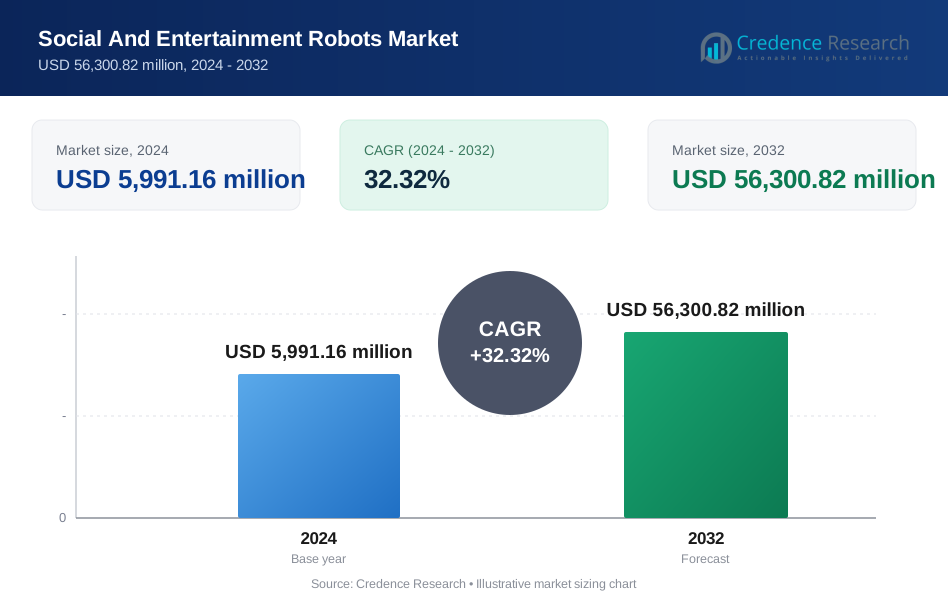
The Social and Entertainment Robots Market size was valued at USD 5,991.16 million in 2024 and is anticipated to reach USD 56,300.82 million by 2032, at a CAGR of 32.32% during the forecast period.
| REPORT ATTRIBUTE | DETAILS |
|---|---|
| Historical Period | 2020-2023 |
| Base Year | 2024 |
| Forecast Period | 2025-2032 |
| Social and Entertainment Robots Market Size 2024 | USD 5,991.16 Million |
| Social and Entertainment Robots Market, CAGR | 32.32% |
| Social and Entertainment Robots Market Size 2032 | USD 56,300.82 Million |
The Social and Entertainment Robots Market is driven by top players such as SoftBank Robotics Group Corp., UBTECH Robotics Corp., Sony Corporation, Hasbro Inc., and KUKA AG. These companies lead the market by developing advanced robots equipped with artificial intelligence, enhancing their functionality in various sectors such as healthcare, hospitality, retail, and entertainment. SoftBank Robotics and UBTECH Robotics focus on humanoid and service robots, while Sony and KUKA are innovating in entertainment robots that offer interactive and engaging experiences. These players utilize cutting-edge technologies like machine learning, natural language processing, and advanced sensors to create robots that cater to consumer and business needs. The leading region in the market is North America, commanding a 34.2% share in 2024. The region's dominance is driven by high adoption rates, robust technological infrastructure, and considerable investments in AI and robotics, positioning it as a hub for innovation and growth in the robotics industry.
Market Insights
- The Social and Entertainment Robots Market size was valued at USD 5,991.16 million in 2024 and is projected to reach USD 56,300.82 million by 2032, growing at a CAGR of 32.32% during the forecast period.
- The primary growth drivers include advancements in AI and robotics, which enhance robot functionality, and the increasing demand for service robots in healthcare, hospitality, and retail sectors.
- The market is witnessing a shift towards Robotics-as-a-Service (RaaS), enabling businesses to adopt robots with low upfront costs and scalable solutions.
- North America leads the market with a share of 34.2% in 2024, driven by strong consumer adoption and high investment in robotics research.
- The Social Robots segment dominates the market, holding approximately 48.7% of the market share in 2024, with healthcare applications being the largest end-use segment, capturing 38.3% of the market.
Market Segmentation Analysis:
By Type
In the social robots segment, service robots dominate, accounting for approximately 48.7% of the market share in 2024. These robots are primarily used in sectors like healthcare, hospitality, and retail to assist with tasks such as patient monitoring, customer service, and elder care. Growth is driven by the increasing demand for AI-powered assistance in caregiving and customer interaction. The rising labour shortages and growing elderly populations further fuel the demand for social robots, which provide support while reducing operational costs in service-oriented industries.
- For instance, in healthcare, the service robot Moxi by Diligent Robotics is deployed in over 24 health systems to deliver supplies and perform routine errands, freeing up staff for direct patient care and improving workflow efficiency.
By End-use Application
In the healthcare application, social robots hold a significant share of 38.3%, driven by their use in elder care, rehabilitation, and patient monitoring. These robots are becoming essential as aging populations and labour shortages in caregiving continue to rise. The increasing adoption of AI technology in healthcare robots enables more effective interaction and assistance for patients, improving the quality of care while reducing human workload. Their role in providing companionship, mobility assistance, and monitoring vital signs is helping to shape the future of healthcare delivery.
- For instance, the robot "Paro," which serves as a rehabilitation therapist for elderly patients with dementia, encouraging social interaction and cognitive engagement.
Key Growth Driver
Advancements in AI and Robotics
Rapid improvements in artificial intelligence, machine learning, and sensor technologies are key drivers for the social and entertainment robots market. Enhanced natural language processing, emotion recognition capabilities, and gesture detection empower robots to interact more intuitively with humans. These technical advancements not only improve robot functionality but also expand adoption across various sectors like healthcare, education, and hospitality, where human-like interaction is essential.
- For instance, Sony’s Aibo ERS-1000 robotic dog utilizes deep learning to recognize its owner’s voice and adapt its behavior, featuring advanced sensor arrays for expressive interaction.
Ageing Population and Labor Shortages
The global shift towards an ageing population, combined with labour shortages, is driving the demand for social and companion robots. In healthcare and elder-care settings, robots assist with monitoring, social engagement, and daily tasks, improving patient outcomes and enhancing quality of life. As more healthcare providers adopt robotic solutions to address these challenges, robots are helping to fill service gaps, reducing the burden on human workers while providing essential support for the elderly and those with special needs. Additionally, advancements in AI and robotics are enabling these machines to offer more personalized care, further boosting their adoption.
- For instance, SoftBank Robotics offers robotic systems like Whiz for senior living facilities, automating cleaning and basic activities to allow staff more focus on specialized care.
Rising Disposable Income and Consumer Demand
Increasing disposable income and evolving consumer leisure habits are fueling demand for entertainment robots, particularly in the toy and companion segments. The market sees significant growth as consumers seek interactive, connected experiences through robotics-based entertainment. As more people embrace technology and robotics for both fun and learning, entertainment robots are becoming an attractive option in households and educational settings, driven by both affordability and the growing interest in advanced entertainment technologies.
Key Trend & Opportunity
Robotics-as-a-Service (RaaS) Business Models
A prominent trend in the market is the shift towards Robotics-as-a-Service (RaaS), which allows businesses to access robots on a subscription basis, rather than making a large upfront investment. This model is particularly appealing to small and medium-sized businesses, offering a low-risk, scalable solution. By adopting RaaS, companies can access the latest robot models, updates, and maintenance services, ensuring continuous performance improvements without the financial burden of owning the technology.
- For instance, Simbe Robotics, whose AI-powered retail robot "Tally" autonomously scans store shelves and provides real-time inventory insights to retailers through a subscription fee based on deployment size and features used.
Expansion into Emerging Regions and Diverse End-Uses
The social and entertainment robots market is experiencing rapid growth in emerging regions such as Asia-Pacific, where consumer technology adoption is accelerating. Government initiatives in robotics, education, and automation are driving demand, particularly in retail, hospitality, and healthcare. As robots become increasingly integrated into a variety of end-use applications, businesses have opportunities to expand their reach, customize robots for different industries, and scale their offerings to meet diverse global demands.
- For instance, UBTECH, a leading China-based company, introduced the Walker S2, the world's first humanoid robot capable of autonomously replacing its own battery, showcased in mid-2025, reflecting innovation in social robot autonomy and application flexibility.
Key Challenge
Privacy, Ethical, and Trust Concerns
Privacy, data security, and ethical issues present significant challenges for the social and entertainment robots market. As robots collect personal and behavioral data, consumers express concerns about how their information is used, stored, and shared. This lack of trust can impede widespread adoption, particularly in sensitive areas like healthcare and education. Ensuring transparency in data usage, developing clear ethical guidelines, and building consumer trust will be crucial for the future growth of this market.
High Initial Costs and Technical Integration
Despite decreasing costs, the initial investment required for social and entertainment robots remains high, especially for hardware, software, and integration. Small to medium-sized businesses often find it difficult to justify the expense, particularly when considering the complexity of system integration and human-robot interaction. Until cost-effective models and simplified technical solutions are developed, high upfront costs and integration hurdles will continue to limit the market's expansion.
Regional Analysis
North America
North America holds a significant share of the Social and Entertainment Robots Market, with a market share of 34.2% in 2024. The region’s dominance is driven by high consumer adoption, strong technological infrastructure, and significant investments in AI and robotics by key players. The U.S. is the primary market within North America, where demand for robots in entertainment, healthcare, and retail is steadily increasing. With a focus on innovation, the region leads in developing interactive robots for various applications, including elder care, entertainment, and service robots in businesses. The expansion of AI-driven platforms further strengthens North America's market position.
Europe
Europe commands a market share of 28.7% in the Social and Entertainment Robots Market as of 2024. The region’s growth is driven by government initiatives supporting robotics research and adoption across various industries. Countries like Germany, the UK, and France are leading the adoption of social and entertainment robots, especially in healthcare, hospitality, and education. With strong industrial automation sectors and a growing interest in companion and service robots, Europe is poised for continued growth. The region is also a hub for research and development, accelerating innovation and commercialization of robotic solutions across different sectors.
Asia-Pacific
Asia-Pacific is the fastest-growing region in the Social and Entertainment Robots Market, holding a share of 24.5% in 2024. The rapid technological advancements in countries like Japan, China, and South Korea are driving demand for both social and entertainment robots. Increased consumer interest in robotics, especially in entertainment and companion robots, is fueling growth. Moreover, rising disposable income, expanding middle-class populations, and government initiatives promoting robotics adoption in education and healthcare are contributing to the region's market expansion. The region's strong manufacturing capabilities and tech innovation also support the development and deployment of robotic solutions.
Latin America
Latin America holds a smaller but growing share of the Social and Entertainment Robots Market at 7.3% in 2024. While adoption rates are lower than in other regions, there is increasing interest in robotics across sectors such as education, healthcare, and entertainment. Countries like Brazil and Mexico are gradually integrating robots into public services, education systems, and customer service industries. Rising consumer demand for innovative solutions and the expansion of robotics-focused research and development in these countries are expected to drive further market growth in the coming years.
Middle East & Africa
The Middle East and Africa region accounts for 5.3% of the Social and Entertainment Robots Market in 2024. Despite its smaller market share, the region is showing significant potential for growth, driven by increasing investments in technology and smart city initiatives. Countries like the UAE and Saudi Arabia are leading in robotics adoption, with a focus on enhancing hospitality, healthcare, and entertainment sectors. Government-backed projects and the growing interest in automation, particularly in service robots for public spaces and healthcare facilities, are expected to drive the region's market expansion over the forecast period.
Market Segmentations:
By Type
- Social Robots
- Entertainment Robots
By End-use application
- Hospitality
- Arts & Entertainment
- Healthcare
- Education
- Retail
- Health and Social Work
- Information and Communication
By Region
- North America
- U.S.
- Canada
- Mexico
- Europe
- Germany
- France
- U.K.
- Italy
- Spain
- Rest of Europe
- Asia Pacific
- China
- Japan
- India
- South Korea
- South-east Asia
- Rest of Asia Pacific
- Latin America
- Brazil
- Argentina
- Rest of Latin America
- Middle East & Africa
- GCC Countries
- South Africa
- Rest of the Middle East and Africa
Competitive Landscape
The Social and Entertainment Robots Market is highly competitive, with key players such as SoftBank Robotics Group Corp., UBTECH Robotics, Honda Motor Co., Ltd., Sony Corporation, and Hasbro Inc. leading the way in terms of innovation and market presence. These companies dominate by leveraging advanced robotics technologies, artificial intelligence, and deep learning systems to create interactive, engaging robots for both social and entertainment applications. Players like SoftBank Robotics and UBTECH Robotics focus on developing humanoid robots and companion robots, while firms like Sony and Honda are focusing on entertainment robots that integrate AI for consumer engagement. Furthermore, emerging players are continuously entering the market with new solutions aimed at addressing niche segments in healthcare, hospitality, and education. The competitive advantage of these companies lies in their ability to integrate robotics with AI and machine learning, which enhances robot functionality and facilitates the broad adoption of robots across various industries.
Key Player Analysis
- Sony Corporation
- Hasbro Inc.
- Lego Group
- Honda Motor Co., Ltd.
- SoftBank Robotics Group Corp.
- UBTECH Robotics Corp.
- Blue Frog Robotics SAS
- Furhat Robotics AB
- Sphero Inc.
- KUKA AG
Recent Developments
- In March 2025, NVIDIA Corporation (USA) launched the "Isaac GR00T N1" foundation model and simulation framework designed for humanoid and social robots.
- In January 2025, Yukai Engineering (Japan) introduced "Mirumi," a consumer-friendly companion robot designed to mimic the behavior of an inquisitive infant.
- In February 2024, Sony Corporation launched the limited “aibo Espresso Edition” companion robot (ERS‑1000B) in the U.S. market.
Report Coverage
The research report offers an in-depth analysis based on Type, End Use Application and Region. It details leading market players, providing an overview of their business, product offerings, investments, revenue streams, and key applications. Additionally, the report includes insights into the competitive environment, SWOT analysis, current market trends, as well as the primary drivers and constraints. Furthermore, it discusses various factors that have driven market expansion in recent years. The report also explores market dynamics, regulatory scenarios, and technological advancements that are shaping the industry. It assesses the impact of external factors and global economic changes on market growth. Lastly, it provides strategic recommendations for new entrants and established companies to navigate the complexities of the market.
Future Outlook
- The demand for social robots will continue to grow as AI and machine learning capabilities evolve.
- Entertainment robots will see increased adoption in both household and commercial settings, driven by interactive and immersive experiences.
- The healthcare sector will increasingly integrate robots for patient care, monitoring, and eldercare support.
- Robotics-as-a-Service (RaaS) models will expand, offering more affordable and accessible solutions for businesses.
- The Asia-Pacific region will experience the fastest growth in the adoption of social and entertainment robots, led by technological advancements.
- As robotics technology becomes more affordable, small and medium-sized enterprises will begin to integrate robots into customer service and retail.
- Robots will play a crucial role in education, facilitating personalized learning and enhancing STEM education for students.
- Autonomous robots will become more prevalent in public spaces, such as airports and shopping malls, offering concierge and information services.
- Governments worldwide will invest in robotics research and development, further driving innovation and adoption.
- Ethical considerations and data privacy concerns will influence the development and deployment of robots, requiring companies to address these issues transparently.
Request a Free Sample
Fill in your details and we'll send you a free sample report.
- Sample data tables & charts
- Research methodology
Need a Custom Version of This Report?
Tailor the scope, geography, or segments to your exact requirements.
- Custom geography or segment scope
- Direct access to our analyst team
Frequently Asked Questions
What is the current market size for Social and Entertainment Robots Market, and what is its projected size in 2032?
At what Compound Annual Growth Rate is the Social and Entertainment Robots Market projected to grow between 2025 and 2032?
Which Social and Entertainment Robots Market segment held the largest share in 2024?
What are the primary factors fueling the growth of the Social and Entertainment Robots Market?
Who are the leading companies in the Social and Entertainment Robots Market?
Which region commanded the largest share of the Social and Entertainment Robots Market in 2024?
Table of Content
Chapter 1. Report Introduction
- 1.1 Report Description & Purpose
- 1.1.1 Report Title & Market Definition
- 1.1.2 Unique Selling Propositions (USP) & Key Differentiators
- 1.1.3 Value Proposition for Stakeholders
- 1.2 Research Objectives
- 1.2.1 Market Sizing Objectives (Volume & Revenue)
- 1.2.2 Segmentation Objectives
- 1.2.3 Competitive Intelligence Objectives
- 1.2.4 Forecast & Scenario Objectives
- 1.3 Report Scope
- 1.3.1 Social And Entertainment Robots Scope – Types & Subtypes Covered
- 1.3.2 Geographic Scope – Regions & Countries Covered
- 1.3.3 Historical Period, Base Year & Forecast Period (2024; forecast to 2032)
- 1.3.4 Inclusions & Exclusions
- 1.4 HS Code & Classification Framework
- 1.5 Currency, Units & Pricing Basis
- 1.6 Target Stakeholders
- 1.7 Limitations & Assumptions
Chapter 2. Executive Summary
- 2.1 Global Social And Entertainment Robots Market Snapshot
- 2.1.1 Market Size – Historical (2024) & Forecast (2024-2032) (2024: USD 5,991.16 million → 2032: USD 56,300.82 million)
- 2.1.2 Volume & Revenue – Global Totals
- 2.1.3 Key Market Highlights – Top Five Facts
- 2.2 Social And Entertainment Robots Market Segmentation Snapshot
- 2.2.1 Market Split by Region – 2024 vs. 2032
- 2.3 Competitive Snapshot
- 2.3.1 Top 10 Players by Revenue Share – 2024
- 2.3.2 Top 10 Players by Volume Share – 2024
- 2.3.3 Recent Strategic Developments (18-Month Summary)
- 2.4 Key Investment Highlights & Strategic Conclusions
Chapter 3. Social And Entertainment Robots Market Dynamics & Industry Analysis
- 3.1 Market Overview & Context
- 3.1.1 Social And Entertainment Robots Market Position in the Broader Automotive Value Chain
- 3.1.2 OEM vs. Replacement Market Dynamics
- 3.1.3 Market Maturity & Development Stage by Region
- 3.2 Social And Entertainment Robots Market Drivers
- 3.3 Social And Entertainment Robots Market Restraints & Challenges
- 3.4 Social And Entertainment Robots Market Opportunities
- 3.5 Porter's Five Forces Analysis
- 3.5.1 Threat of New Entrants
- 3.5.2 Bargaining Power of Suppliers
- 3.5.3 Bargaining Power of Buyers
- 3.5.4 Threat of Substitutes
- 3.5.5 Competitive Rivalry – Intensity Assessment
- 3.6 Social And Entertainment Robots Value Chain Analysis
- 3.6.1 Upstream – Raw Material/Input Suppliers
- 3.6.1.1 Raw Material/Input 1
- 3.6.1.2 Raw Material/Input 2
- 3.6.1.3 Raw Material/Input 3
- 3.6.2 Midstream – Production/Manufacturing/Service Delivery
- 3.6.2.1 Production/Process Overview
- 3.6.2.2 Key Facility Locations & Capacity by Manufacturer
- 3.6.3 Downstream – Distribution & End Consumer
- 3.6.3.1 Primary Channel – B2B/OEM
- 3.6.3.2 Secondary Channels – Dealer, Retail, Online, Direct
- 3.6.4 Value Chain Profitability Analysis
- 3.6.1 Upstream – Raw Material/Input Suppliers
- 3.7 PESTEL Analysis
- 3.7.1 Political Factors
- 3.7.2 Economic Factors
- 3.7.3 Social Factors
- 3.7.4 Technological Factors
- 3.7.5 Environmental Factors
- 3.7.6 Legal Factors
- 3.8 Social And Entertainment Robots Supply Chain Analysis
- 3.8.1 Raw Material/Input Supply Risk Assessment
- 3.8.2 Manufacturing Concentration Risk (Geographic Exposure)
- 3.8.3 Trade Disruption Impact Analysis
- 3.9 Regulatory & Policy Landscape
Note: The regulatory and policy landscape section covers regulations based on their applicability to the market, Social And Entertainment Robots category, geography, and scope of the study. Only regulatory frameworks with a material impact on operations, compliance, trade, sustainability, or market access are analyzed in detail.
Chapter 4. Key Investment Pockets & Opportunity Analysis
- 4.1 Social And Entertainment Robots Market Attractiveness Analysis
- 4.1.1 By Region – Investment Attractiveness Matrix (Volume × CAGR)
- 4.2 Absolute Revenue Growth Opportunity
- 4.2.1 By Region – Absolute USD Growth Through 2032
- 4.3 Incremental Volume Opportunity
- 4.3.1 By Region – Incremental Volume Through 2032
- 4.3.2 Segment – Incremental Volume
- 4.4 Emerging Submarket Opportunity Deep Dive (Subject to Applicability)
- 4.5 Emerging Market Opportunity Scorecards
- 4.5.1 United States
- 4.5.2 Europe
- 4.5.3 Asia
- 4.5.4 Middle East & Africa
Note: Emerging Market Opportunity Scorecards will be included based on relevance and strategic importance. Regions listed are indicative and may vary depending on data availability and market dynamics.
Chapter 5. Social And Entertainment Robots Import-Export Analysis & Trade Flows
- 5.1 Global Trade Overview
- 5.1.1 Global Export Value by Country (2024)
- 5.1.2 Global Export Volume by Country (2024)
- 5.1.3 Global Import Value by Country (2024)
- 5.1.4 Global Import Volume by Country (2024)
- 5.1.5 Net Trade Balance by Country (2024)
- 5.2 Export Analysis – Segment
- 5.2.1 Type 1 (HS Code)
- 5.2.2 Type 2 (HS Code)
- 5.2.3 Type 3 (HS Code)
- 5.2.4 Type 4 (HS Code)
- 5.2.5 Type 5 (HS Code)
- 5.3 Import Analysis – Segment
- 5.3.1 Type 1 (HS Code)
- 5.3.2 Type 2 (HS Code)
- 5.3.3 Type 3 (HS Code)
- 5.3.4 Type 4 (HS Code)
- 5.3.5 Type 5 (HS Code)
- 5.4 Average Unit Trade Prices
- 5.4.1 Average Export Price – Segment & Country
- 5.4.2 Average Import Price – Segment & Source Country
- 5.4.3 Price Trends (2024)
- 5.5 Key Trade Route Analysis
- 5.5.1 Trade Route 1
- 5.5.2 Trade Route 2
- 5.5.3 Trade Route 3
- 5.5.4 Trade Route 4
- 5.5.5 Trade Route 5
- 5.6 Trade Policy Impact Assessment
- 5.6.1 US Anti-Dumping & Section 301 Tariffs
- 5.6.2 EU Customs Union Impact
- 5.6.3 Major Free Trade Agreements
- 5.6.4 USMCA Rules of Origin
Note: Trade policy analysis will be included only where relevant to the Social And Entertainment Robots market.
Chapter 6. Competitive Landscape & Company Benchmarking
- 6.1 Social And Entertainment Robots Market Concentration & Structure
- 6.1.1 Herfindahl-Hirschman Index (HHI) – vs. 2024
- 6.1.2 Tier 1, Tier 2 & Tier 3 Market Structure
- 6.1.3 Global, Regional & Local Player Dynamics
- 6.2 Social And Entertainment Robots Market Share Analysis – 2024
- 6.2.1 Global Revenue Share by Company
- 6.2.2 Global Volume Share by Company
- 6.2.3 Regional Revenue Share
- 6.2.4 Market Share Evolution ( vs. 2024)
- 6.2.5 OEM Segment Share by Company
- 6.2.6 Replacement Segment Share by Company
- 6.3 Production/Delivery Capacity & Facility Analysis
- 6.3.1 Global Installed Capacity
- 6.3.2 Capacity Utilization Rates
- 6.3.3 Production/Output Volume
- 6.3.4 Facility Locations & Capacity Map
- 6.3.5 Planned Capacity Additions
- 6.4 Social And Entertainment Robots Competitive Benchmarking Matrix
- 6.4.1 Revenue, Volume, CAGR & Profitability Comparison
- 6.4.2 Channel Revenue Mix
- 6.4.3 Geographic Revenue Exposure
- 6.4.4 R&D Intensity
- 6.4.5 Sustainability Maturity
- 6.5 Strategic Developments in Social And Entertainment Robots (Last 24 Months)
- 6.5.1 Mergers, Acquisitions & Divestments
- 6.5.2 New Social And Entertainment Robots Launches
- 6.5.3 Facility Expansions
- 6.5.4 Strategic Alliances, Joint Ventures & Partnerships
- 6.5.5 Distribution Expansion & Market Entry
- 6.5.6 Sustainability & ESG Initiatives
- 6.6 Competitive Strategy Mapping
- 6.6.1 Leader, Challenger, Follower & Niche Classification
- 6.6.2 Pricing Strategy Comparison
- 6.6.3 Channel Strategy Matrix
Note: Strategic developments are included based on their materiality and the availability of reliable information.
Chapter 7. Global Social And Entertainment Robots Market – By Distribution Channel
- 7.1 Segment Overview
- 7.1.1 Volume & Revenue Split by Channel (2024 & 2032)
- 7.1.2 Channel Mix Evolution (2024-2032)
Chapter 8. Regional Market Analysis – Global Overview
- 8.1 Global Regional Overview
- 8.1.1 Regional Volume Share
- 8.1.2 Regional Revenue Share
- 8.1.3 Regional Volume by Region
- 8.1.4 Regional Revenue by Region
- 8.1.5 Regional Forecast Through 2032
- 8.2 Cross-Regional Segment Analysis
- 8.2.1 By Distribution Channel
- 8.2.2 By Brand/Price Tier
Chapter 9. North America Social And Entertainment Robots Market
- 9.1 United States
- 9.2 Canada
- 9.3 Mexico
Chapter 10. Europe Social And Entertainment Robots Market
- 10.1 Germany
- 10.2 France
- 10.3 Italy
- 10.4 United Kingdom
- 10.5 Spain
- 10.6 Poland
- 10.7 Russia
- 10.8 Netherlands
- 10.9 Belgium
- 10.10 Sweden
- 10.11 Denmark
- 10.12 Norway
- 10.13 Rest of Europe
Chapter 11. Asia Pacific Social And Entertainment Robots Market
- 11.1 China
- 11.2 India
- 11.3 Japan
- 11.4 South Korea
- 11.5 Thailand
- 11.6 Indonesia
- 11.7 Vietnam
- 11.8 Malaysia
- 11.9 Australia
- 11.10 Rest of Asia Pacific
Chapter 12. Latin America Social And Entertainment Robots Market
- 12.1 Brazil
- 12.2 Argentina
- 12.3 Colombia
- 12.4 Chile
- 12.5 Rest of Latin America
Chapter 13. Middle East Social And Entertainment Robots Market
- 13.1 Saudi Arabia
- 13.2 United Arab Emirates
- 13.3 Turkey
- 13.4 Israel
- 13.5 Iran
- 13.6 Rest of the Middle East
Chapter 14. Africa Social And Entertainment Robots Market
- 14.1 South Africa
- 14.2 Egypt
- 14.3 Nigeria
- 14.4 Morocco
- 14.5 Rest of Africa
Chapter 15. Social And Entertainment Robots Company Profiles
- 15.1 [Company 01]
- 15.1.1 Company Overview
- 15.1.2 Key Management Personnel
- 15.1.3 Products & Services Portfolio
- 15.1.4 Financial Performance
- 15.1.5 Key Market Focus & Geographic Presence
- 15.1.6 Recent Developments & Strategic Initiatives
Note: The company profile list is preliminary and may change based on research findings, market developments, data availability, and client requirements.
Chapter 16. Appendices
- Appendix A – List of Abbreviations & Acronyms
- Appendix B – Industry Classification Code Reference – Full Series
- Appendix C – Production & Capacity Data Tables
- Appendix D – End-Use & Demand Base Tables
- Appendix E – Consumption & Replacement Rate Assumptions
- Appendix F – ASP Reference Tables
- Appendix G – Manufacturing & Facility Database
- Appendix H – Import-Export Data Tables
- Appendix I – Regulatory Summary Tables
- Appendix J – Primary Research Participant List (Anonymized)
- Appendix K – Primary Research Questionnaire Framework
- Appendix L – Data Sources & Bibliography
- Appendix M – Market Size Divergence & Source Comparison
Chapter 17. Research Methodology
- 17.1 Research Framework & Philosophy
- 17.2 Secondary Research – Sources, Hierarchy & Data Extraction
- 17.3 Data Modeling – Bottom-Up & Top-Down Market Sizing
- 17.4 Primary Research – Stakeholder Framework, LOI & Sample Sizes
- 17.5 Forecast Methodology – Regression, Scenario & Sensitivity Analysis
- 17.6 Quality Control – Four-Layer Validation Framework
- 17.7 Limitations & Standard Assumptions
- 17.8 Disclaimer
