Market Overview
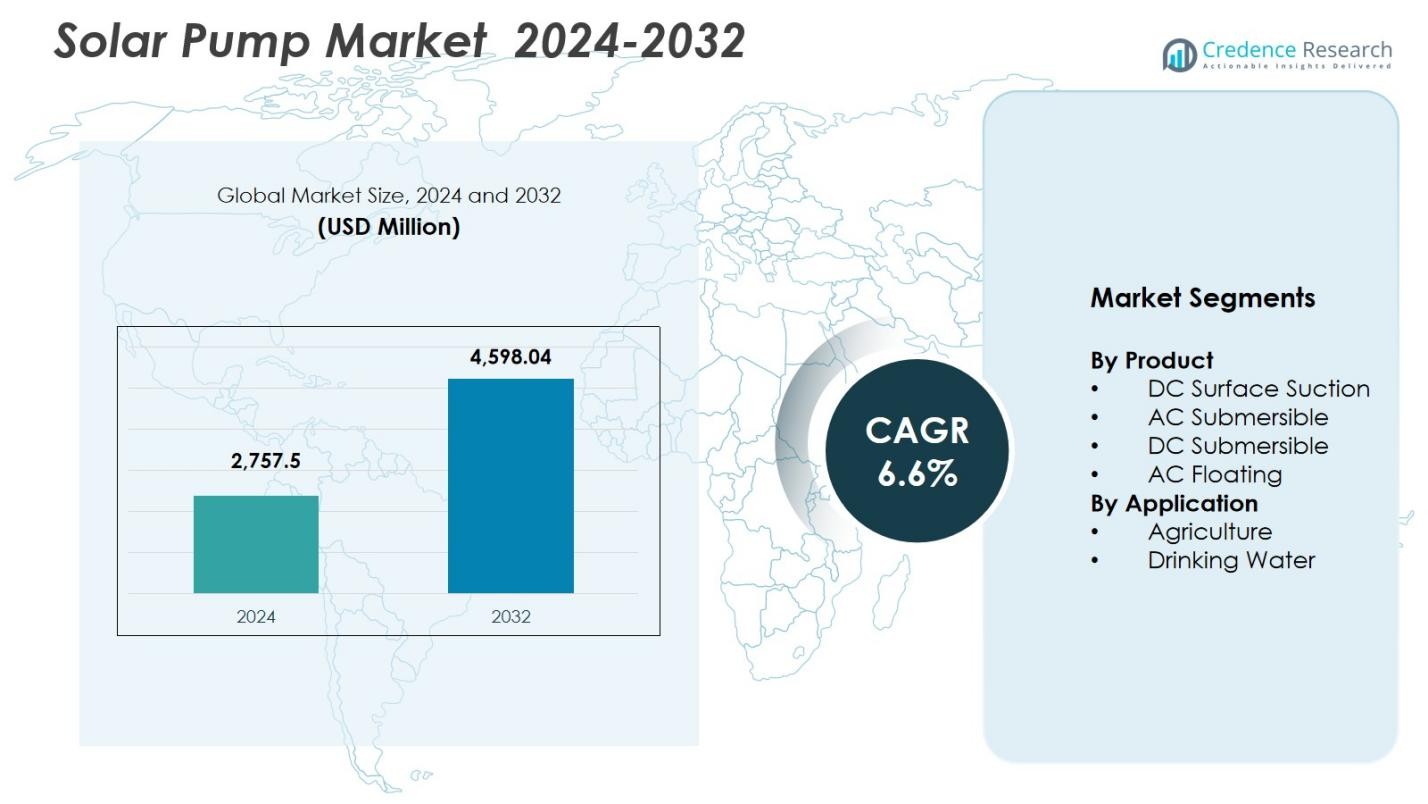
Solar Pump Market size was valued USD 2,757.5 Million in 2024 and is anticipated to reach USD 4,598.04 Million by 2032, at a CAGR of 6.6% during the forecast period.
| REPORT ATTRIBUTE |
DETAILS |
| Historical Period |
2020-2023 |
| Base Year |
2024 |
| Forecast Period |
2025-2032 |
| Solar Pump Market Size 2024 |
USD 2,757.5 Million |
| Solar Pump Market , CAGR |
6.6% |
| Solar Pump Market Size 2032 |
USD 4,598.04 Million |
Solar Pump Market is shaped by prominent players such as Alpex Solar Ltd, Bright Solar Limited, LORENTZ, Grundfos Pumps India Private Ltd, Franklin Electric, C.R.I. Pumps Private Limited, Crompton Greaves Consumer Electricals Limited, AQUA Groups, Duke Plasto Technique Pvt Ltd, and Dankoff Solar, all focusing on high-efficiency pump technologies and wider rural deployment. These companies expand their presence through product innovation, strategic partnerships, and strong after-sales networks to support agricultural and community water applications. Asia-Pacific leads the market with a 42.6% share in 2024, driven by large agricultural demand, government subsidies, and extensive off-grid solar adoption across emerging economies.
Access crucial information at unmatched prices!
Request your sample report today & start making informed decisions powered by Credence Research Inc.!
Download Sample
Market Insights
- Solar Pump Market size reached USD 2,757.5 million in 2024 and is projected to grow at a CAGR of 6.6% through 2032, supported by expanding adoption across agriculture and rural water supply.
- Strong market drivers include the rising need for sustainable irrigation, declining solar panel costs, and government-backed subsidy programs that accelerate the shift from diesel pumps to energy-efficient solar alternatives.
- Key trends highlight increasing demand for DC submersible pumps, which lead the product segment with 41.6% share, along with growing integration of smart controllers and hybrid pumping systems.
- The market features active participation from players such as Alpex Solar, LORENTZ, Grundfos, Franklin Electric, and C.R.I. Pumps, each enhancing technological efficiency and expanding rural distribution networks.
- Regionally, Asia-Pacific dominates with 42.6% share, followed by North America at 21.4% and Europe at 18.7%, driven by strong agricultural adoption, supportive policies, and expansion of off-grid solar infrastructure.
 Market Segmentation Analysis
By Product
The Solar Pump market by product is dominated by DC Submersible pumps, capturing 41.6% share in 2024, driven by their high operational efficiency, lower maintenance needs, and strong suitability for deep water extraction in agriculture and rural water supply systems. DC Surface Suction pumps continue to gain traction for small-scale farms due to affordability and ease of installation. AC Submersible pumps see rising adoption in large irrigation projects requiring higher discharge capacity, while AC Floating pumps find niche demand in areas with fluctuating water levels. Advancements in inverter technology and declining PV costs strengthen product adoption across categories.
- For Instance, in trials of PV-powered pumping systems, a 7.5 HP DC centrifugal submersible pump linked to 32 solar modules (≈ 255.8 W each) successfully delivered reliable discharge under varying solar radiation, demonstrating DC submersible suitability for solar irrigation.
By Application
Within the application segment, Agriculture leads with 62.3% market share in 2024, supported by rising irrigation needs, government subsidies, and increasing preference for off-grid pumping solutions that reduce diesel dependency. Solar pumps enable cost-effective and uninterrupted water supply for micro-irrigation, groundwater extraction, and livestock watering, particularly in regions facing power shortages. Drinking Water applications expand steadily as rural communities adopt solar-driven systems for sustainable water access. The segment benefits from policy support, water security initiatives, and the growing demand for clean, energy-efficient pumping systems.
- For Instance, in Kenya, the World Bank–supported Kenya Off-Grid Solar Access Project (KOSAP) deployed solar pumping solutions for remote counties, expanding agricultural and drinking-water supply reliability in underserved communities.
Key Growth Drivers
Rising Demand for Sustainable Irrigation Solutions
The Solar Pump market continues to expand as agriculture increasingly adopts sustainable and cost-efficient irrigation technologies. Farmers are rapidly shifting away from diesel-powered pumps due to rising fuel expenses, high maintenance needs, and the environmental impact of emissions. Solar pumps offer reliable off-grid performance, long-term savings, and minimal servicing requirements, making them ideal for regions with inconsistent electricity access. Government-backed solar irrigation programs significantly boost market penetration by reducing upfront costs and promoting renewable solutions. Initiatives across Asia and Africa encourage rural communities to adopt solar-powered systems for micro-irrigation, groundwater pumping, and livestock watering. With climate variability intensifying water scarcity and influencing crop cycles, solar pumps provide a dependable water access solution. This transition strengthens agricultural productivity and aligns with global sustainability goals, positioning solar pumping systems as essential for future-ready farming models.
- For instance, in Infrastructure Development Company Limited (IDCOL)’s solar-irrigation programme in Bangladesh, by early 2020s over 1,515 solar irrigation pumps (≈ 40 MWp capacity) were operational helping farmers shift away from diesel pumps and reducing long-term pumping costs.
Government Incentives and Rural Electrification Programs
Government support remains a powerful driver shaping the Solar Pump market, especially in developing regions where grid reliability remains limited. Subsidies, grants, and interest-free financing significantly reduce initial investment barriers, enabling farmers and small enterprises to adopt solar-powered pumping solutions. Many national renewable-energy policies prioritize solar pumps to lower grid dependence, enhance rural water access, and support agricultural modernization. Public-private partnerships expand delivery channels while promoting local manufacturing of solar components, reducing system costs and strengthening supply chains. Rural electrification missions increasingly integrate solar pumping as a core element for irrigation, drinking water facilities, and community infrastructure. These initiatives stimulate large-scale market demand while encouraging manufacturers to innovate, expand regional presence, and tailor product offerings for diverse applications. Strong policy frameworks therefore accelerate solar pump adoption and unlock high-growth opportunities across emerging economies.
- For instance, through the Kenya Off-Grid Solar Access Project (KOSAP), the government and World Bank co-fund solar pumping systems for underserved counties, expanding irrigation and potable water availability in remote regions.
Advancements in Solar Technology and Pump Efficiency
Continuous technological improvements significantly enhance the performance and economic viability of solar pumps, making innovation a major growth catalyst. Advances in photovoltaic efficiency, MPPT controllers, and brushless motors increase water discharge capabilities and ensure stable operations even under low sunlight. Modern DC submersible pumps provide higher lift and reliability, expanding their suitability for deeper borewells and wider agricultural usage. Declining solar panel prices further reduce overall system costs, improving affordability for rural users. Hybrid solar-grid systems and battery-less configurations extend operational hours and support greater water availability. Manufacturers increasingly embed IoT-based monitoring for performance tracking, remote diagnostics, and automated flow management, minimizing downtime and optimizing energy utilization. These advancements not only improve lifecycle economics but also strengthen adoption across agriculture, drinking water projects, and industrial applications, making solar pumping a technologically competitive alternative to conventional systems.
Key Trends & Opportunities
Expansion of Solar-Powered Community Water Supply Projects
A major trend in the Solar Pump market is the rapid deployment of solar-powered community water supply systems, especially across underserved rural regions. Governments, development agencies, and NGOs increasingly adopt centralized solar pumping solutions to ensure reliable, low-cost access to drinking water for villages, schools, and healthcare centers. These systems replace diesel units that require frequent servicing and incur high operational expenses. Opportunities arise for manufacturers offering modular pump systems that adapt to varying groundwater levels and climatic conditions. Integration with water storage tanks, automated chlorination, and remote monitoring enhances the efficiency and safety of community water networks. The global push toward achieving UN Sustainable Development Goal 6 Clean Water and Sanitation drives substantial investment in decentralized water infrastructure. Companies providing turnkey installations, long-term maintenance contracts, and technician training programs gain strong market advantages in this expanding segment.
- For Instance, UNICEF and partners deployed hundreds of solar-powered borehole and piped-water systems in Ethiopia, Somalia, and South Sudan, supplying clean water to rural communities, schools, and health posts while replacing diesel-driven pumps.
Growing Adoption of Smart and Hybrid Solar Pumping Systems
The market is witnessing strong interest in smart solar pumping solutions integrated with advanced control technologies and hybrid energy configurations. IoT-enabled controllers, cloud analytics, and automated irrigation systems help users optimize water consumption, detect faults in real time, and improve agricultural productivity. Smart solar pumps allow remote monitoring of water levels, energy usage, and pump performance, reducing operational downtime and enhancing resource efficiency. Hybrid systems that combine solar with grid or battery backup ensure continuous pumping during low sunlight or peak irrigation demand. As precision agriculture expands globally, opportunities increase for manufacturers offering sensor-based irrigation, soil moisture integration, and AI-driven water management tools. The shift toward data-driven farming ecosystems creates attractive possibilities for subscription-based digital services and remote operational support tied to solar pump installations.
- For instance, a 2023 FAO-supported pilot in Nepal integrated solar pumps with soil-moisture sensors and automated irrigation scheduling, reducing water use while improving vegetable crop yields in smallholder farms.
Key Challenges
High Initial Investment and Affordability Barriers
Despite long-term economic benefits, the high upfront cost of solar pump systems remains a major obstacle, particularly for small and marginal farmers. The total investment includes solar panels, controllers, mounting structures, and pump equipment, often making initial expenses significantly higher than diesel-based alternatives. Even with government subsidies, many users face financing limitations due to inadequate credit access, low income stability, and limited awareness of available funding programs. Price fluctuations in solar panels and imported components further influence affordability in sensitive markets. Innovative financing models such as leasing, pay-as-you-go, and cooperative purchasing are essential to bridge this gap. Without accessible financing mechanisms and strong financial support infrastructure, large-scale adoption in rural and agricultural communities slows, despite clear environmental and operational advantages of solar pumping systems.
Technical Limitations and Maintenance Challenges in Remote Areas
Technical challenges continue to affect the performance and acceptance of solar pumps in remote and resource-constrained regions. Variability in sunlight limits water discharge during cloudy or rainy seasons, posing difficulties in areas requiring consistent irrigation. Deep borewell applications also challenge system efficiency, particularly when water tables fluctuate. Limited access to skilled technicians, spare parts, and service centers in remote locations increases downtime when faults occur. Maintenance issues such as dust accumulation on panels, wiring failures, and controller malfunctions reduce system reliability if not addressed promptly. Water quality issues like sand or mineral-heavy groundwater can accelerate pump wear. Manufacturers must expand service networks, offer robust training programs, and enhance product durability to overcome these constraints. Without reliable maintenance infrastructure, users may experience reduced operational efficiency, slowing the broader adoption of solar pumping technologies.
Regional Analysis
North America
North America holds 21.4% share of the Solar Pump market in 2024, supported by rising investments in renewable energy adoption and growing demand for sustainable water solutions in agriculture and landscaping. The U.S. leads due to increasing deployment in remote farms, livestock watering systems, and off-grid community water projects. Federal clean energy policies and incentives encourage broader adoption across rural regions. Technological advancements, including smart controllers and hybrid solar-grid systems, also strengthen market penetration. Canada’s focus on sustainable water management and irrigation modernization further contributes to regional growth.
Europe
Europe accounts for 18.7% share of the Solar Pump market, driven by strong environmental regulations, growing emphasis on carbon reduction, and the region’s transition toward decentralized renewable water systems. Germany, France, and Italy promote solar-based irrigation to reduce energy dependency and support long-term sustainability goals. EU climate policies encourage adoption across agricultural and residential applications. Increasing replacement of diesel pumps and expansion of smart irrigation technologies contribute to regional growth. Rising awareness of water conservation also strengthens demand in rural and peri-urban areas.
Asia-Pacific
Asia-Pacific dominates the Solar Pump market with 42.6% share in 2024, led by extensive agricultural activity, strong government subsidy programs, and widespread reliance on groundwater extraction across rural communities. India remains the fastest-growing market due to national initiatives promoting solar irrigation, while China benefits from large manufacturing capabilities and rapid deployment. Southeast Asian countries increasingly adopt solar pumps to support smallholder farmers and remote community water systems. Lower system costs, growing off-grid solar infrastructure, and favorable policies drive regional leadership, supported by rising irrigation requirements.
Latin America
Latin America holds 9.5% share of the Solar Pump market, driven by agricultural modernization and rising solar adoption in rural and semi-arid regions. Brazil, Mexico, and Chile witness strong uptake as farmers shift from costly diesel pumps to improve irrigation efficiency and reduce operational expenses. Government support programs, combined with abundant solar resources, create favorable deployment conditions across plantations and smallholder farms. Solar pumps also support livestock watering and off-grid community water systems. Expanding private-sector investment in renewable energy strengthens market growth across the region.
Middle East & Africa
The Middle East & Africa region commands 7.8% share of the Solar Pump market, supported by high solar irradiation and strong demand for reliable off-grid pumping systems in arid, water-stressed environments. African nations accelerate adoption through solar irrigation schemes aimed at strengthening food security, while NGOs and development agencies fund decentralized water supply projects. In the Middle East, countries such as Saudi Arabia and the UAE deploy solar pumps to reduce water extraction costs and support sustainable farming. Limited rural electrification across Africa further boosts demand for solar-driven water pumping solutions.
Market Segmentations
By Product
- DC Surface Suction
- AC Submersible
- DC Submersible
- AC Floating
By Application
- Agriculture
- Drinking Water
By Geography
- North America
- Europe
- Germany
- France
- U.K.
- Italy
- Spain
- Rest of Europe
- Asia Pacific
- China
- Japan
- India
- South Korea
- South-east Asia
- Rest of Asia Pacific
- Latin America
- Brazil
- Argentina
- Rest of Latin America
- Middle East & Africa
- GCC Countries
- South Africa
- Rest of the Middle East and Africa
Competitive Landscape
The competitive landscape of the Solar Pump market features a mix of global manufacturers and regional specialists focused on expanding product efficiency, affordability, and distribution reach. Key players such as Alpex Solar Ltd, Bright Solar Limited, LORENTZ, Grundfos Pumps India Private Ltd, Franklin Electric, C.R.I. Pumps Private Limited, Crompton Greaves Consumer Electricals Limited, Duke Plasto Technique Pvt Ltd, AQUA Groups, and Dankoff Solar actively strengthen their portfolios through technological innovation and strategic partnerships. Companies emphasize high-efficiency DC submersible and surface pumps, smart controllers, and hybrid systems to meet diverse agricultural and community water needs. Many players invest in local manufacturing, after-sales networks, and government-linked solar irrigation schemes to enhance market penetration. Rising demand for off-grid water solutions encourages firms to adopt competitive pricing, develop modular pump systems, and offer financing support. Continuous advancements in PV technology and motor efficiency further intensify competition across global and emerging markets.
Key Player Analysis
- Grundfos Pumps India Private Ltd.
- DANKOFF SOLAR.
- Duke Plasto Technique Pvt Ltd.
- Crompton Greaves Consumer Electricals Limited.
- Bright Solar Limited
- AQUA Groups.
- Franklin Electric
- Alpex Solar Ltd
- LORENTZ.
- C.R.I. Pumps Private Limited
Recent Developments
- In December 2025, Maharashtra State Electricity Distribution Company Limited (MSEDCL) set a new world record by installing 45,911 off-grid solar agricultural pumps in a single month a major push in the solar-pump deployment under the government scheme in India
- In October 2025, Shakti Pumps (India) Ltd. showcased a full range of solar and industrial water-pumping solutions at IFAT India 2025 in Mumbai highlighting its latest products and industrial-scale capabilities.
- In February 2025, Shakti Pumps (India) Ltd. partnered with ReNew Photovoltaic Private Limited for the supply of DCR-cell based solar modules worth ₹1,300 crore.
Shape Your Report to Specific Countries or Regions & Enjoy 30% Off!
Report Coverage
The research report offers an in-depth analysis based on Product, Application and Geography. It details leading market players, providing an overview of their business, product offerings, investments, revenue streams, and key applications. Additionally, the report includes insights into the competitive environment, SWOT analysis, current market trends, as well as the primary drivers and constraints. Furthermore, it discusses various factors that have driven market expansion in recent years. The report also explores market dynamics, regulatory scenarios, and technological advancements that are shaping the industry. It assesses the impact of external factors and global economic changes on market growth. Lastly, it provides strategic recommendations for new entrants and established companies to navigate the complexities of the market.
Future Outlook
- Solar pump adoption will accelerate as farmers increasingly shift from diesel-based systems to sustainable, low-maintenance irrigation solutions.
- Government subsidy programs and rural electrification initiatives will continue to expand installation rates across emerging economies.
- Advancements in photovoltaic efficiency and motor technology will enhance pump performance, reliability, and water-lifting capacity.
- Smart solar pumps with IoT monitoring, automation, and remote diagnostics will see rising demand in precision agriculture.
- Hybrid solar-grid and solar-battery systems will gain traction to ensure continuous water availability during low sunlight conditions.
- Community water supply projects in rural regions will drive large-scale deployment of centralized solar pumping systems.
- Manufacturers will strengthen regional production, distribution networks, and after-sales service to enhance market penetration.
- Financing innovations such as pay-as-you-go and leasing models will improve affordability for small farmers.
- Increasing focus on water scarcity and climate resilience will position solar pumps as a critical solution in sustainable water management.
- Growing adoption in non-agricultural sectors, including livestock, construction, and remote monitoring applications, will diversify market opportunities.


