
Market Overview
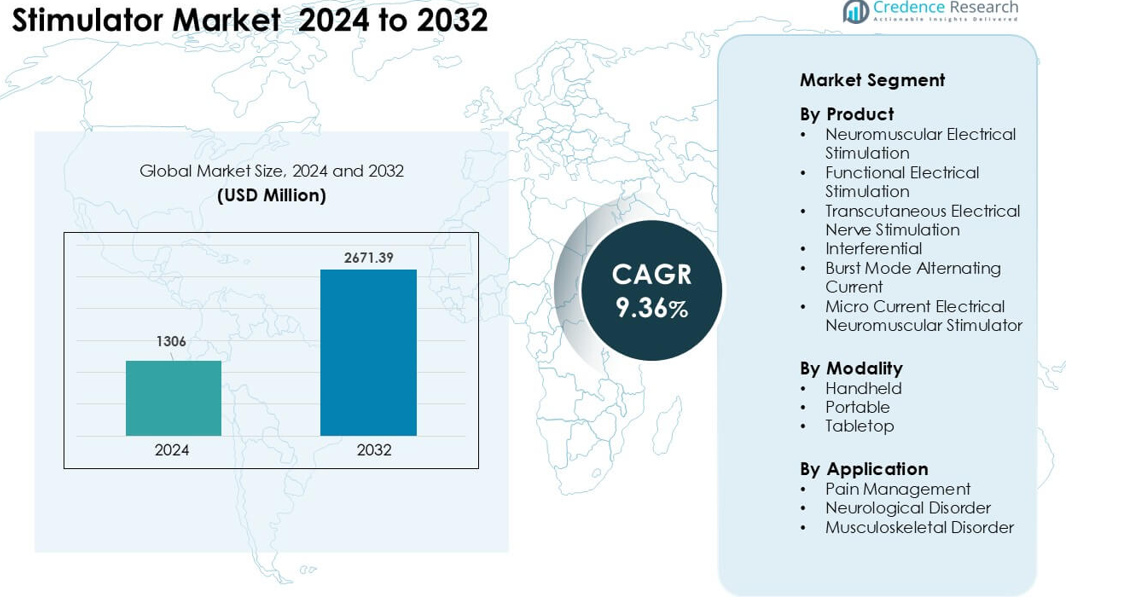
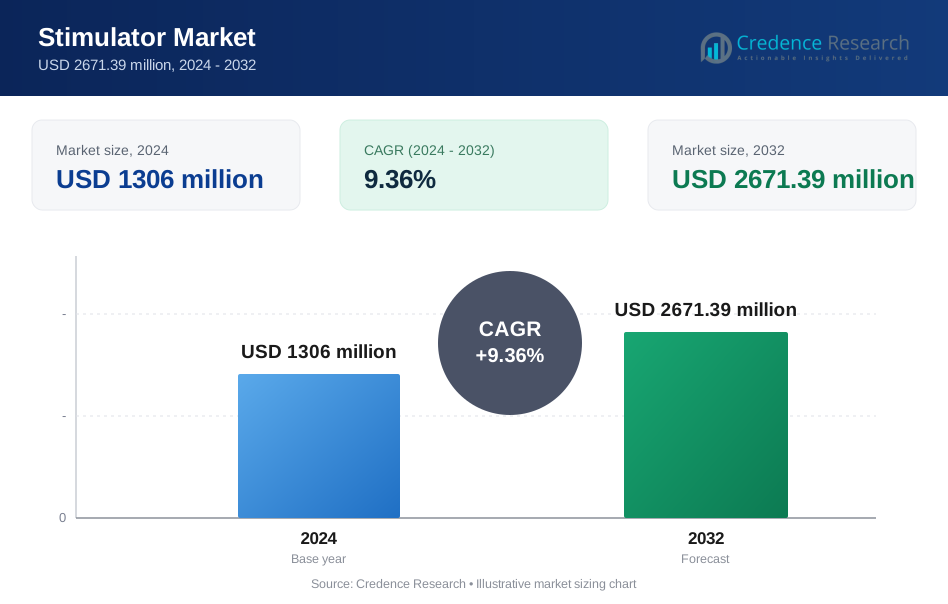
Stimulator Market was valued at USD 1306 million in 2024 and is anticipated to reach USD 2671.39 million by 2032, growing at a CAGR of 9.36 % during the forecast period.
| REPORT ATTRIBUTE | DETAILS |
|---|---|
| Historical Period | 2020-2023 |
| Base Year | 2024 |
| Forecast Period | 2025-2032 |
|
|
USD 1306 million |
| Stimulator Market, CAGR | 9.6% |
| Stimulator Market Size 2032 | USD 2671.39 million |
Major players in the Stimulator Market include OG Wellness Technologies, Zimmer MedizinSysteme, Zynex, RS Medical, Beurer, EMS Physio, OMRON, NeuroMetrix, DJO Global, and BioMedical Life Systems, each contributing to strong innovation across pain management, rehabilitation, and neuromuscular therapy devices. These companies focus on portable designs, multi-mode systems, and improved clinical performance to meet rising demand from hospitals, physiotherapy centers, and home-care users. North America emerged as the leading region in 2024 with about 37% share, supported by advanced healthcare infrastructure, high chronic pain incidence, and strong adoption of non-invasive stimulation technologies.
Market Insights
- The Stimulator Market reached USD 1306 million in 2024 and is projected to hit USD 2671.39 million by 2032, growing at a CAGR of 9.36%.
- Rising chronic pain cases and wider use of non-invasive therapy devices fuel strong demand, with pain management holding about 52% share in 2024.
- Smart and portable stimulation devices gained traction as consumers adopted app-based control and home-care therapy solutions.
- Key players such as OG Wellness, Zimmer MedizinSysteme, Zynex, RS Medical, Beurer, and OMRON strengthened competition through product upgrades and broader distribution networks.
- North America led the market with around 37% share in 2024, while Asia-Pacific showed the fastest expansion; portable stimulators accounted for nearly 48% share across modalities.
Market Segmentation Analysis:
By Product
Transcutaneous Electrical Nerve Stimulation led the product segment in 2024 with about 34% share. Strong demand came from rising cases of chronic back pain, arthritis, and post-operative discomfort. Users preferred these systems because they offer non-invasive relief and allow home-based therapy. Neuromuscular and functional electrical stimulation devices grew due to wider use in stroke and spinal injury rehabilitation. Microcurrent units gained attention for soft-tissue recovery, but their share stayed lower due to limited clinical adoption. Interferential and burst-mode systems expanded across sports clinics but remained secondary in overall volume.
- For instance, according to a 2025 market‑size forecast report for the muscle stimulator sector, the share of TENS remained significantly larger than other modalities, confirming that interferential or burst‑mode units accounted for a smaller portion of unit sales relative to TENS in 2024.
By Modality
Portable stimulators dominated the modality segment in 2024 with nearly 48% share. Growth was driven by rising use among athletes, elderly patients, and individuals seeking therapy outside hospitals. Portable units offered easy handling, battery support, and multi-mode functions that improved user convenience. Handheld devices saw steady expansion in physiotherapy centers because therapists used them for quick pain-relief sessions. Tabletop systems maintained importance in advanced rehabilitation clinics, yet their share stayed modest as more patients shifted toward mobile, home-based recovery solutions supported by compact and digital platforms.
- For instance, within the 2023 data for the Transcutaneous Electrical Nerve Stimulation Market, portable (rather than stationary/tabletop) TENS devices dominated usage reinforcing that desktop/tabletop units formed a smaller share of overall devices in use.
By Application
Pain Management held the leading position in 2024 with about 52% share. Widespread cases of lower back pain, neuropathic pain, and sports injuries supported stronger adoption of TENS and neuromuscular systems. Patients favored these devices because they reduce discomfort without drugs and support continuous daily relief. Musculoskeletal disorder treatments grew as physiotherapists relied on stimulation to improve mobility and muscle strength. Neurological disorder applications expanded in stroke rehabilitation programs, but their share remained smaller due to longer therapy cycles and limited access in some care settings.
Key Growth Drivers
Rising Prevalence of Chronic Pain Conditions
Chronic pain cases continue to rise worldwide, and this trend drives broad adoption of electrical stimulators. Many patients now seek drug-free options due to concerns about long-term medication use and dependency risk. Clinics and home users prefer electrical stimulation because it offers steady relief and supports daily function with low risk. Healthcare systems also promote these devices to reduce reliance on opioids and cut treatment costs. Wider awareness through physiotherapy programs has increased early use among patients recovering from injuries or surgery. Growing aging populations amplify demand because older adults face higher rates of joint pain, neuropathies, and mobility problems that respond well to nerve and muscle stimulation.
- For instance, globally about 1.5 billion people are estimated to suffer from chronic pain.
Expanding Use in Rehabilitation and Neurological Recovery
Rehabilitation centers rely on stimulators to restore movement, rebuild muscle strength, and speed recovery from major injuries. These systems support structured therapy for stroke, spinal cord injuries, and post-surgical weakness by improving muscle activation and nerve response. Early integration of functional electrical stimulation in rehab programs has improved outcomes and encouraged broader adoption across hospitals and specialty clinics. Sports medicine teams also use stimulators to help athletes recover faster and prevent injury recurrence. Technology improvements have created programmable modes that fit diverse therapy needs. As neurological cases increase, demand grows for tools that help patients regain independence and reduce long hospital stays.
- For instance, a systematic review of functional electrical stimulation (FES) in upper‑limb stroke rehabilitation showed that FES‑based therapy improved functional scores in one analysis, patients using EMG‑controlled FES improved by a mean difference of 14.14 points on the Fugl‑Meyer Assessment compared to baseline.
Growth in Home-Based and Portable Therapy Solutions
Portable stimulators have reshaped patient care because many individuals now prefer treatment at home rather than repeated clinic visits. Lighter designs, wireless control, and multi-mode therapy settings have made these systems easy to use without supervision. Home users can manage long-term pain, muscle weakness, or nerve issues through regular sessions that fit daily schedules. Digital health tools also support remote tracking, enabling therapists to adjust plans without in-person meetings. Aging populations and rising healthcare costs fuel the shift toward home therapy solutions. This movement expands the market as more people seek personalized, flexible, and cost-effective care options delivered through compact devices.
Key Trends & Opportunities:
Adoption of Smart and Connected Stimulation Devices
The market is seeing a move toward digital and connected platforms that improve therapy personalization. Many new devices now include app-based controls, cloud tracking, and AI-supported session adjustments. These upgrades help users monitor progress and allow clinicians to oversee sessions remotely. Smart devices also offer automated intensity regulation and customizable treatment programs. This feature set appeals to younger patients and tech-driven home users. As digital health ecosystems grow, connected stimulators gain relevance in pain care, sports rehab, and neurological recovery, creating strong expansion opportunities for manufacturers focused on advanced interfaces.
- For instance, a 2025 publication described a wearable, closed‑loop sEMG‑driven TENS platform that integrates real‑time electromyography (sEMG) to adapt stimulation based on the user’s muscle activity. The system achieved closed‑loop latency under 10 ms, delivered stable biphasic stimulation (±22 mA), and provided multi‑channel output — demonstrating that smart stimulators can deliver clinically relevant, responsive therapy outside hospitals.
Expansion of Applications Beyond Traditional Therapy
Electrical stimulators are now entering broader wellness, sports optimization, and preventive care settings. Athletes use stimulators to improve circulation, warm muscles before training, and reduce soreness after workouts. Wellness centers adopt microcurrent and neuromuscular stimulation to support skin tightening and tissue repair. Early research also explores new fields such as cognitive stimulation and metabolic modulation. These expanding uses drive fresh revenue streams as brands target fitness enthusiasts and lifestyle consumers. Growing acceptance of bio-stimulation tools in non-clinical environments strengthens long-term growth prospects and widens the customer base beyond medical facilities.
- For instance, many sports and fitness centers especially gyms looking to offer recovery services now incorporate EMS (Electrical Muscle Stimulation) as part of regular training or post-workout recovery routines, aiming to reduce muscle fatigue, accelerate recovery, and support conditioning.
Key Challenges:
Limited Clinical Evidence for Certain Modalities
Some stimulation types still lack strong, long-term clinical validation, which slows adoption in hospitals and insurance-funded programs. Microcurrent and advanced interferential systems face skepticism because trial results remain mixed across conditions. Clinicians often rely on proven approaches when treating chronic pain or neurological cases, making it harder for newer technologies to gain trust. Regulatory bodies also require solid evidence for therapeutic claims, creating longer approval timelines. This gap affects reimbursement and restricts growth in formal care settings. Manufacturers must invest more in robust clinical studies to improve acceptance among healthcare professionals.
High Cost Barriers in Advanced Rehabilitation Settings
Advanced stimulation platforms designed for neurological rehab often involve high prices, which can limit use in smaller clinics and low-resource hospitals. Many systems need trained staff, multiple accessories, and integration with other rehab tools, adding to the total cost of ownership. Insurance coverage varies widely, and some plans do not support newer modalities or home-based devices. These economic barriers slow widespread rollout, especially in developing regions. Clinics may opt for basic stimulators instead of advanced programmable systems. Addressing pricing and reimbursement gaps is essential for broader access and faster market expansion.
Regional Analysis
North America
North America held the leading position in the Stimulator Market in 2024 with about 37% share. Strong adoption came from high chronic pain incidence, advanced physiotherapy networks, and wide insurance coverage for nerve and muscle stimulation therapies. Hospitals and rehab centers used functional electrical stimulation for post-stroke recovery and sports injuries, while home users preferred portable units for daily pain relief. The U.S. dominated regional demand due to strong device availability and frequent product upgrades. Canada supported growth through expanding digital health programs and greater acceptance of non-invasive stimulation methods.
Europe
Europe accounted for nearly 29% share of the Stimulator Market in 2024. Growth was supported by structured rehabilitation pathways, strong geriatric populations, and wider acceptance of drug-free pain therapies. Germany, France, and the U.K. drove adoption through advanced clinical infrastructure and strong physiotherapy participation. The region also promoted electrical stimulation for musculoskeletal disorders and neurological rehabilitation across public hospitals. Portable and handheld devices gained traction as home-care programs expanded. Rising investment in sports recovery and wellness technologies further strengthened market development across key EU countries.
Asia-Pacific
Asia-Pacific captured about 24% share in 2024 and remained the fastest-growing regional market. Demand rose due to expanding patient populations with chronic pain, rapid healthcare modernization, and increasing physiotherapy access in China, India, and Japan. Consumers favored portable and affordable devices for home therapy, boosting adoption across urban and semi-urban areas. Hospitals used neuromuscular and functional electrical stimulation for stroke and injury rehabilitation as neurological cases increased. Government focus on aging-related health issues further pushed demand. Growing sports sectors and wellness uptake also contributed to broader market penetration.
Latin America
Latin America held roughly 6% share of the Stimulator Market in 2024. Growth came from expanding physiotherapy clinics, rising musculoskeletal cases, and higher awareness of non-invasive pain control. Brazil led the region due to stronger urban healthcare access and wider device availability. Mexico and Argentina adopted stimulators for orthopedic recovery and chronic pain linked with lifestyle disorders. Home-care therapy gained attention as portable devices became accessible. Limited reimbursement coverage slowed deeper penetration, yet rising investment in private rehabilitation centers supported steady demand growth.
Middle East & Africa
The Middle East & Africa region accounted for about 4% share in 2024. Uptake increased in Gulf countries as hospitals integrated advanced electrical stimulation for neurological and orthopedic recovery. Saudi Arabia and the UAE led demand due to expanding rehabilitation networks and higher healthcare spending. Africa showed gradual adoption driven by growing chronic pain cases and improving physiotherapy services in urban centers. Cost sensitivity and limited device availability restricted wider use, but rising private clinic investments and training programs supported modest but consistent market expansion.
Market Segmentations:
By Product
- Neuromuscular Electrical Stimulation
- Functional Electrical Stimulation
- Transcutaneous Electrical Nerve Stimulation
- Interferential
- Burst Mode Alternating Current
- Micro Current Electrical Neuromuscular Stimulator
By Modality
- Handheld
- Portable
- Tabletop
By Application
- Pain Management
- Neurological Disorder
- Musculoskeletal Disorder
By Geography
- North America
- U.S.
- Canada
- Mexico
- Europe
- Germany
- France
- U.K.
- Italy
- Spain
- Rest of Europe
- Asia Pacific
- China
- Japan
- India
- South Korea
- South-east Asia
- Rest of Asia Pacific
- Latin America
- Brazil
- Argentina
- Rest of Latin America
- Middle East & Africa
- GCC Countries
- South Africa
- Rest of the Middle East and Africa
Competitive Landscape
The Stimulator Market features strong competition driven by product innovation, wider clinical use, and expanding home-care demand. Leading companies such as OG Wellness Technologies, Zimmer MedizinSysteme, Zynex, RS Medical, Beurer, EMS Physio, OMRON, NeuroMetrix, DJO Global, and BioMedical Life Systems focus on advancing TENS, neuromuscular, and functional stimulation technologies. These companies invest in compact designs, multi-mode therapy systems, and connected platforms that support remote monitoring. Manufacturers also expand distribution through physiotherapy centers, sports clinics, and digital retail channels to reach broader user groups. Strategic partnerships with rehabilitation networks, continuous R&D in pain and neurological therapy, and regulatory approvals strengthen market presence. Growing demand for portable and home-based solutions pushes companies to prioritize ease of use, safety performance, and smart features that enhance treatment outcomes.
Key Player Analysis
- OG Wellness Technologies Co., Ltd.
- Zimmer MedizinSysteme GmbH
- Zynex, Inc.
- RS Medical, Inc.
- Beurer GmbH
- EMS Physio Ltd.
- OMRON Corporation
- NeuroMetrix, Inc.
- DJO Global, Inc.
- BioMedical Life Systems, Inc.
Recent Developments
- In March 2025, RS Medical, Inc. RS Medical has actively promoted its prescription-grade RS-4i® Plus sequential stimulator through clinical communications and site content in early 2025 (blog posts and clinical summaries in Jan–Mar 2025). In parallel, payer/medical policy documents referencing RS-4i therapy appeared in 2025 (e.g., health-plan/medical policy references).
- In December 2024, Zimmer MedizinSysteme GmbH (Zimmer Aesthetics / Z Stim) Zimmer rolled out the Z-Stim muscle-stimulation platform in its aesthetic/physical-therapy portfolio (covered in press/industry media in Dec 2024) and published product brochures and site content describing multi-channel muscle-stimulation protocols for body-contouring and rehab. (product brochure and launch coverage).
- In September 2024, Zynex, Inc. Zynex obtained FDA clearance and announced a new prescription-only TENS product (TensWave) as part of its pain-management device lineup (press release — Sept 3, 2024); Zynex continued company updates through 2025 via regular financial/press releases.)
Report Coverage
The research report offers an in-depth analysis based on Product, Modality, Application and Geography. It details leading market players, providing an overview of their business, product offerings, investments, revenue streams, and key applications. Additionally, the report includes insights into the competitive environment, SWOT analysis, current market trends, as well as the primary drivers and constraints. Furthermore, it discusses various factors that have driven market expansion in recent years. The report also explores market dynamics, regulatory scenarios, and technological advancements that are shaping the industry. It assesses the impact of external factors and global economic changes on market growth. Lastly, it provides strategic recommendations for new entrants and established companies to navigate the complexities of the market.
Future Outlook
- Demand for non-invasive stimulation therapies will rise as chronic pain cases increase.
- Portable and home-use stimulators will gain stronger adoption across all age groups.
- Smart connected devices with app control will shape the next wave of product innovation.
- Rehabilitation centers will expand use of neuromuscular and functional electrical stimulation.
- Sports medicine will adopt advanced systems to enhance recovery and prevent injuries.
- AI-based personalization will improve treatment accuracy and therapy outcomes.
- Manufacturers will focus on lightweight designs and multi-mode therapy platforms.
- Emerging markets will see faster growth due to rising physiotherapy access.
- Regulatory approvals will accelerate as clinical evidence improves for newer modalities.
- Competition will intensify as more companies enter wellness, fitness, and home-care therapy segments.
Request a Free Sample
Fill in your details and we'll send you a free sample report.
- Sample data tables & charts
- Research methodology
Need a Custom Version of This Report?
Tailor the scope, geography, or segments to your exact requirements.
- Custom geography or segment scope
- Direct access to our analyst team
Frequently Asked Questions
What is the current market size for Stimulator Market, and what is its projected size in 2032?
At what Compound Annual Growth Rate is Stimulator Market projected to grow between 2025 and 2032?
Which Stimulator Market segment held the largest share in 2024?
What are the primary factors fueling the growth of Stimulator Market?
Who are the leading companies in Stimulator Market?
Table of Content
Chapter 1. Report Introduction
- 1.1 Report Description & Purpose
- 1.1.1 Report Title & Market Definition
- 1.1.2 Unique Selling Propositions (USP) & Key Differentiators
- 1.1.3 Value Proposition for Stakeholders
- 1.2 Research Objectives
- 1.2.1 Market Sizing Objectives (Volume & Revenue)
- 1.2.2 Segmentation Objectives
- 1.2.3 Competitive Intelligence Objectives
- 1.2.4 Forecast & Scenario Objectives
- 1.3 Report Scope
- 1.3.1 Stimulator Scope – Types & Subtypes Covered
- 1.3.2 Geographic Scope – Regions & Countries Covered
- 1.3.3 Historical Period, Base Year & Forecast Period (2024; forecast to 2032)
- 1.3.4 Inclusions & Exclusions
- 1.4 HS Code & Classification Framework
- 1.5 Currency, Units & Pricing Basis
- 1.6 Target Stakeholders
- 1.7 Limitations & Assumptions
Chapter 2. Executive Summary
- 2.1 Global Stimulator Market Snapshot
- 2.1.1 Market Size – Historical (2024) & Forecast (2024-2032) (2024: USD 1306 million → 2032: USD 2671.39 million)
- 2.1.2 Volume & Revenue – Global Totals
- 2.1.3 Key Market Highlights – Top Five Facts
- 2.2 Stimulator Market Segmentation Snapshot
- 2.2.1 Market Split by Region – 2024 vs. 2032
- 2.3 Competitive Snapshot
- 2.3.1 Top 10 Players by Revenue Share – 2024
- 2.3.2 Top 10 Players by Volume Share – 2024
- 2.3.3 Recent Strategic Developments (18-Month Summary)
- 2.4 Key Investment Highlights & Strategic Conclusions
Chapter 3. Stimulator Market Dynamics & Industry Analysis
- 3.1 Market Overview & Context
- 3.1.1 Stimulator Market Position in the Broader Automotive Value Chain
- 3.1.2 OEM vs. Replacement Market Dynamics
- 3.1.3 Market Maturity & Development Stage by Region
- 3.2 Stimulator Market Drivers
- 3.3 Stimulator Market Restraints & Challenges
- 3.4 Stimulator Market Opportunities
- 3.5 Porter's Five Forces Analysis
- 3.5.1 Threat of New Entrants
- 3.5.2 Bargaining Power of Suppliers
- 3.5.3 Bargaining Power of Buyers
- 3.5.4 Threat of Substitutes
- 3.5.5 Competitive Rivalry – Intensity Assessment
- 3.6 Stimulator Value Chain Analysis
- 3.6.1 Upstream – Raw Material/Input Suppliers
- 3.6.1.1 Raw Material/Input 1
- 3.6.1.2 Raw Material/Input 2
- 3.6.1.3 Raw Material/Input 3
- 3.6.2 Midstream – Production/Manufacturing/Service Delivery
- 3.6.2.1 Production/Process Overview
- 3.6.2.2 Key Facility Locations & Capacity by Manufacturer
- 3.6.3 Downstream – Distribution & End Consumer
- 3.6.3.1 Primary Channel – B2B/OEM
- 3.6.3.2 Secondary Channels – Dealer, Retail, Online, Direct
- 3.6.4 Value Chain Profitability Analysis
- 3.6.1 Upstream – Raw Material/Input Suppliers
- 3.7 PESTEL Analysis
- 3.7.1 Political Factors
- 3.7.2 Economic Factors
- 3.7.3 Social Factors
- 3.7.4 Technological Factors
- 3.7.5 Environmental Factors
- 3.7.6 Legal Factors
- 3.8 Stimulator Supply Chain Analysis
- 3.8.1 Raw Material/Input Supply Risk Assessment
- 3.8.2 Manufacturing Concentration Risk (Geographic Exposure)
- 3.8.3 Trade Disruption Impact Analysis
- 3.9 Regulatory & Policy Landscape
Note: The regulatory and policy landscape section covers regulations based on their applicability to the market, Stimulator category, geography, and scope of the study. Only regulatory frameworks with a material impact on operations, compliance, trade, sustainability, or market access are analyzed in detail.
Chapter 4. Key Investment Pockets & Opportunity Analysis
- 4.1 Stimulator Market Attractiveness Analysis
- 4.1.1 By Region – Investment Attractiveness Matrix (Volume × CAGR)
- 4.2 Absolute Revenue Growth Opportunity
- 4.2.1 By Region – Absolute USD Growth Through 2032
- 4.3 Incremental Volume Opportunity
- 4.3.1 By Region – Incremental Volume Through 2032
- 4.3.2 Segment – Incremental Volume
- 4.4 Emerging Submarket Opportunity Deep Dive (Subject to Applicability)
- 4.5 Emerging Market Opportunity Scorecards
- 4.5.1 United States
- 4.5.2 Europe
- 4.5.3 Asia
- 4.5.4 Middle East & Africa
Note: Emerging Market Opportunity Scorecards will be included based on relevance and strategic importance. Regions listed are indicative and may vary depending on data availability and market dynamics.
Chapter 5. Stimulator Import-Export Analysis & Trade Flows
- 5.1 Global Trade Overview
- 5.1.1 Global Export Value by Country (2024)
- 5.1.2 Global Export Volume by Country (2024)
- 5.1.3 Global Import Value by Country (2024)
- 5.1.4 Global Import Volume by Country (2024)
- 5.1.5 Net Trade Balance by Country (2024)
- 5.2 Export Analysis – Segment
- 5.2.1 Type 1 (HS Code)
- 5.2.2 Type 2 (HS Code)
- 5.2.3 Type 3 (HS Code)
- 5.2.4 Type 4 (HS Code)
- 5.2.5 Type 5 (HS Code)
- 5.3 Import Analysis – Segment
- 5.3.1 Type 1 (HS Code)
- 5.3.2 Type 2 (HS Code)
- 5.3.3 Type 3 (HS Code)
- 5.3.4 Type 4 (HS Code)
- 5.3.5 Type 5 (HS Code)
- 5.4 Average Unit Trade Prices
- 5.4.1 Average Export Price – Segment & Country
- 5.4.2 Average Import Price – Segment & Source Country
- 5.4.3 Price Trends (2024)
- 5.5 Key Trade Route Analysis
- 5.5.1 Trade Route 1
- 5.5.2 Trade Route 2
- 5.5.3 Trade Route 3
- 5.5.4 Trade Route 4
- 5.5.5 Trade Route 5
- 5.6 Trade Policy Impact Assessment
- 5.6.1 US Anti-Dumping & Section 301 Tariffs
- 5.6.2 EU Customs Union Impact
- 5.6.3 Major Free Trade Agreements
- 5.6.4 USMCA Rules of Origin
Note: Trade policy analysis will be included only where relevant to the Stimulator market.
Chapter 6. Competitive Landscape & Company Benchmarking
- 6.1 Stimulator Market Concentration & Structure
- 6.1.1 Herfindahl-Hirschman Index (HHI) – vs. 2024
- 6.1.2 Tier 1, Tier 2 & Tier 3 Market Structure
- 6.1.3 Global, Regional & Local Player Dynamics
- 6.2 Stimulator Market Share Analysis – 2024
- 6.2.1 Global Revenue Share by Company
- 6.2.2 Global Volume Share by Company
- 6.2.3 Regional Revenue Share
- 6.2.4 Market Share Evolution ( vs. 2024)
- 6.2.5 OEM Segment Share by Company
- 6.2.6 Replacement Segment Share by Company
- 6.3 Production/Delivery Capacity & Facility Analysis
- 6.3.1 Global Installed Capacity
- 6.3.2 Capacity Utilization Rates
- 6.3.3 Production/Output Volume
- 6.3.4 Facility Locations & Capacity Map
- 6.3.5 Planned Capacity Additions
- 6.4 Stimulator Competitive Benchmarking Matrix
- 6.4.1 Revenue, Volume, CAGR & Profitability Comparison
- 6.4.2 Channel Revenue Mix
- 6.4.3 Geographic Revenue Exposure
- 6.4.4 R&D Intensity
- 6.4.5 Sustainability Maturity
- 6.5 Strategic Developments in Stimulator (Last 24 Months)
- 6.5.1 Mergers, Acquisitions & Divestments
- 6.5.2 New Stimulator Launches
- 6.5.3 Facility Expansions
- 6.5.4 Strategic Alliances, Joint Ventures & Partnerships
- 6.5.5 Distribution Expansion & Market Entry
- 6.5.6 Sustainability & ESG Initiatives
- 6.6 Competitive Strategy Mapping
- 6.6.1 Leader, Challenger, Follower & Niche Classification
- 6.6.2 Pricing Strategy Comparison
- 6.6.3 Channel Strategy Matrix
Note: Strategic developments are included based on their materiality and the availability of reliable information.
Chapter 7. Global Stimulator Market – By Distribution Channel
- 7.1 Segment Overview
- 7.1.1 Volume & Revenue Split by Channel (2024 & 2032)
- 7.1.2 Channel Mix Evolution (2024-2032)
Chapter 8. Regional Market Analysis – Global Overview
- 8.1 Global Regional Overview
- 8.1.1 Regional Volume Share
- 8.1.2 Regional Revenue Share
- 8.1.3 Regional Volume by Region
- 8.1.4 Regional Revenue by Region
- 8.1.5 Regional Forecast Through 2032
- 8.2 Cross-Regional Segment Analysis
- 8.2.1 By Distribution Channel
- 8.2.2 By Brand/Price Tier
Chapter 9. North America Stimulator Market
- 9.1 United States
- 9.2 Canada
- 9.3 Mexico
Chapter 10. Europe Stimulator Market
- 10.1 Germany
- 10.2 France
- 10.3 Italy
- 10.4 United Kingdom
- 10.5 Spain
- 10.6 Poland
- 10.7 Russia
- 10.8 Netherlands
- 10.9 Belgium
- 10.10 Sweden
- 10.11 Denmark
- 10.12 Norway
- 10.13 Rest of Europe
Chapter 11. Asia Pacific Stimulator Market
- 11.1 China
- 11.2 India
- 11.3 Japan
- 11.4 South Korea
- 11.5 Thailand
- 11.6 Indonesia
- 11.7 Vietnam
- 11.8 Malaysia
- 11.9 Australia
- 11.10 Rest of Asia Pacific
Chapter 12. Latin America Stimulator Market
- 12.1 Brazil
- 12.2 Argentina
- 12.3 Colombia
- 12.4 Chile
- 12.5 Rest of Latin America
Chapter 13. Middle East Stimulator Market
- 13.1 Saudi Arabia
- 13.2 United Arab Emirates
- 13.3 Turkey
- 13.4 Israel
- 13.5 Iran
- 13.6 Rest of the Middle East
Chapter 14. Africa Stimulator Market
- 14.1 South Africa
- 14.2 Egypt
- 14.3 Nigeria
- 14.4 Morocco
- 14.5 Rest of Africa
Chapter 15. Stimulator Company Profiles
- 15.1 [Company 01]
- 15.1.1 Company Overview
- 15.1.2 Key Management Personnel
- 15.1.3 Products & Services Portfolio
- 15.1.4 Financial Performance
- 15.1.5 Key Market Focus & Geographic Presence
- 15.1.6 Recent Developments & Strategic Initiatives
Note: The company profile list is preliminary and may change based on research findings, market developments, data availability, and client requirements.
Chapter 16. Appendices
- Appendix A – List of Abbreviations & Acronyms
- Appendix B – Industry Classification Code Reference – Full Series
- Appendix C – Production & Capacity Data Tables
- Appendix D – End-Use & Demand Base Tables
- Appendix E – Consumption & Replacement Rate Assumptions
- Appendix F – ASP Reference Tables
- Appendix G – Manufacturing & Facility Database
- Appendix H – Import-Export Data Tables
- Appendix I – Regulatory Summary Tables
- Appendix J – Primary Research Participant List (Anonymized)
- Appendix K – Primary Research Questionnaire Framework
- Appendix L – Data Sources & Bibliography
- Appendix M – Market Size Divergence & Source Comparison
Chapter 17. Research Methodology
- 17.1 Research Framework & Philosophy
- 17.2 Secondary Research – Sources, Hierarchy & Data Extraction
- 17.3 Data Modeling – Bottom-Up & Top-Down Market Sizing
- 17.4 Primary Research – Stakeholder Framework, LOI & Sample Sizes
- 17.5 Forecast Methodology – Regression, Scenario & Sensitivity Analysis
- 17.6 Quality Control – Four-Layer Validation Framework
- 17.7 Limitations & Standard Assumptions
- 17.8 Disclaimer
