Market Overview:
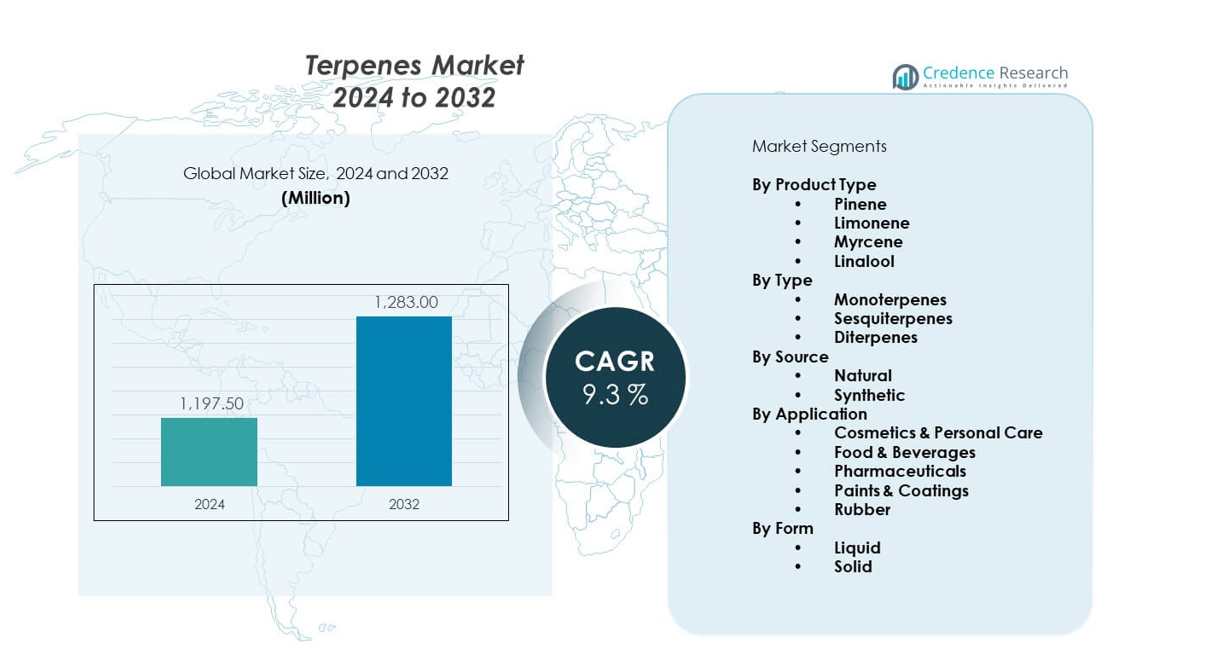
The Terpenes market is projected to grow from USD 1,197.5 million in 2024 to an estimated USD 2,439.14 million by 2032, with a CAGR of 9.3% from 2024 to 2032. Demand rises as personal care, food, and pharmaceutical brands shift toward natural ingredients. Expanding use in aromatherapy and fragrance blends also supports strong adoption across global consumer markets.
| REPORT ATTRIBUTE |
DETAILS |
| Historical Period |
2020-2023 |
| Base Year |
2024 |
| Forecast Period |
2025-2032 |
| Terpenes Market Size 2024 |
USD 1,197.5 million |
| Terpenes Market, CAGR |
9.3% |
| Terpenes Market Size 2032 |
USD 2,439.14 million |
Growth strengthens as industries prefer plant-based compounds for safer formulations. Producers use advanced extraction systems to raise purity and improve consistency. Brands introduce terpene-rich blends for wellness, skincare, and flavor enhancement. Rising demand for eco-friendly raw materials pushes more manufacturers to expand sourcing and processing capacity. Broader acceptance of natural ingredients across consumer goods helps the market gain steady momentum.
North America leads due to strong essential oil processing and high use in wellness and cosmetics. Europe follows with strict clean-label rules that boost natural ingredient demand. Asia-Pacific emerges as the fastest-growing region because of expanding food, fragrance, and personal care manufacturing. China and India increase terpene production as local industries scale up. Latin America shows progress as Brazil strengthens supply through large forestry resources. This mix of mature and emerging markets supports wider global penetration.
Market Insights:
- The Terpenes market is valued at USD 1,197.5 million in 2024 and is expected to reach USD 2,439.14 million by 2032, reflecting a steady 3% CAGR supported by rising demand for natural aromatic ingredients across industries.
- North America (32%), Asia-Pacific (30%), and Europe (28%) dominate the global landscape due to strong personal care, food, fragrance, and industrial manufacturing bases that create sustained terpene consumption.
- Asia-Pacific remains the fastest-growing region with a 30% share, driven by expanding essential oil production, cost-competitive manufacturing, and rapid growth in food, cosmetic, and pharmaceutical applications.
- By product type, limonene holds around 34% share, supported by extensive use in food, beverage, and home-care formulations driven by its sensory strength and broad regulatory acceptance.
- By source, natural terpenes account for nearly 62% share, driven by clean-label demand and strong adoption across cosmetics, fragrances, wellness, and food sectors.
Access crucial information at unmatched prices!
Request your sample report today & start making informed decisions powered by Credence Research Inc.!
Download Sample
Market Drivers:
Growing Preference For Natural And Bio-Derived Ingredients Across Consumer Applications
Demand increases as brands shift toward plant-based inputs that support safer product development. Companies strengthen sourcing models to secure stable access to botanical materials. Formulators use terpenes to enhance aroma, taste, and therapeutic depth in diverse categories. The Terpenes market benefits from strong adoption across cosmetics, food, and wellness lines. It supports cleaner formulations that align with consumer expectations for transparent labels. Producers expand extraction capability to achieve higher purity levels. Regulatory focus on synthetic ingredient limits fuels wider reliance on natural compounds. Brands introduce reformulated product lines to meet evolving safety and quality norms.
- For instance, Givaudan introduced Labdanum Absolute SIGNature1 in September 2025, developed by its House of Naturals in Grasse, France, delivering a true-to-nature cistus scent through advanced engineering processes.
Rising Integration Of Terpenes In Fragrance, Flavor, And Wellness Formulations
Manufacturers include terpenes to elevate sensory profiles in premium product ranges. Fragrance developers apply complex blends to improve longevity and diffusion. Flavor houses use structured terpene combinations to refine taste precision. The Terpenes market gains steady traction as wellness brands adopt therapeutic profiles. It enhances aromatherapy solutions with consistent performance across applications. Companies invest in research to map advanced bioactivity data. Market participants develop application-specific grades for controlled outcomes. Consumer interest in holistic wellness encourages higher repeat use across multiple categories.
- For instance, terpenes demonstrate antimicrobial properties against foodborne microbes, with α-terpineol shown to destroy bacterial cell walls and membranes, while borneol and citral exhibit synergistic bacteriostatic and antibiofilm effects against Listeria monocytogenes and Pseudomonas aeruginosa.
Advancements In Extraction Technologies That Improve Yield, Purity, And Chemical Consistency
Producers deploy advanced steam distillation and CO₂ extraction equipment to improve efficiency. Modern systems support lower energy use while protecting sensitive compounds. Yield improvements help stabilize supply and strengthen long-term planning. The Terpenes market gains from better-quality outputs that serve regulated industries. It enables manufacturers to achieve tighter specification control for global compliance. Firms introduce modular processing units to scale production without quality loss. Technology upgrades reduce impurity loads and safeguard compound stability. Precision tools support consistent batches that meet pharmaceutical and personal care standards.
Expanding Industrial Use Across Pharmaceuticals, Food Processing, And Eco-Chemical Applications
Industrial buyers evaluate terpenes for greener chemical pathways across production lines. Pharmaceutical developers explore terpene molecules for targeted therapeutic potential. Food processors adopt terpene-based ingredients to enhance flavor integrity. The Terpenes market benefits from interest in cleaner solvents and bio-based additives. It supports industries that aim to reduce synthetic chemical dependency. Producers license bio-engineered terpene strains to diversify the supply base. Demand strengthens with higher investments in eco-friendly manufacturing solutions. Regulatory acceptance of natural materials boosts broader industry participation.
Market Trends:
Growing Commercialization Of Engineered Terpene Molecules Through Biotechnological Platforms
Biotech firms design engineered terpene variants for specialized industrial use. Developers use microbial fermentation to produce high-consistency compounds. Custom molecules support fragrance, pharmaceutical, and material science applications. The Terpenes market sees new interest in lab-designed profiles for performance optimization. It enables brands to access stable supply without relying fully on plant harvests. Production partners scale fermentation units to meet commercial volumes. Patents increase for engineered variants with targeted functionalities. Research groups expand collaborations to accelerate compound development cycles.
- For instance, dsm-firmenich launched CLEARWOOD in 2014 as the first precision fermentation ingredient in the perfumery industry, leveraging a leading biotechnology platform for terpenes production and demonstrating 5x lower water use, 3x lower land use, and 2-5x lower product carbon footprint compared to patchouli essential oil.
Rising Use Of Terpenes In Functional Food, Beverage, And Nutraceutical Development
Brands explore terpenes to create functional product lines with sensory and wellness benefits. Food developers use controlled terpene blends to enrich taste and aroma. Beverage makers adopt natural molecules to support clean-label positioning. The Terpenes market benefits from new application pathways in nutrition-focused portfolios. It drives expansion into immunity, relaxation, and digestive health categories. Companies validate terpene combinations for improved bioavailability. R&D units design proprietary flavor systems using terpene structures. Consumer interest in fortified products boosts wider commercial testing.
- For instance, research on terpene stability in gummy formulations shows that maintaining water activity below 0.65 improves terpene retention across all major terpene classes, with products at 0.62-0.65 water activity demonstrating optimal balance between terpene stability and acceptable texture.
Increasing Adoption Of Terpenes In Green Solvent Systems And Bio-Based Industrial Formulations
Industrial chemists replace petroleum-derived solvents with terpene alternatives. Material producers use terpene systems to support eco-friendly manufacturing. Adhesive and coating developers apply terpene-based solvents for improved safety. The Terpenes market expands through growing acceptance in industrial cleaning and degreasing products. It helps companies meet strict environmental compliance rules. Developers optimize terpene blends to increase evaporation control. Sustainable material initiatives highlight terpenes as key enablers. Product designers test terpene chemistries for new performance-enhancing roles.
Emergence Of High-Purity Terpene Isolates In Premium Fragrance, Cosmetic, And Therapeutic Lines
High-purity isolates gain demand from brands that need precision ingredients. Aromatherapy companies introduce targeted terpene isolates for focused effects. Cosmetic formulators integrate isolates to enhance skin-active properties. The Terpenes market sees stronger traction in advanced personal care and therapeutic segments. It supports controlled formulation design with predictable outcomes. Producers introduce pharma-grade isolates to align with strict compliance norms. New extraction lines focus on fractionation accuracy. Premium brands leverage isolates to differentiate high-value product ranges.
Market Challenges Analysis:
Supply Instability Driven By Agricultural Variability And Seasonal Constraints
Producers depend on consistent plant yield, yet environmental shifts create volatility. Supply chains face pressure when crop cycles fail to meet processing demand. Distillation units operate below capacity when raw materials fluctuate. The Terpenes market experiences cost pressure during periods of limited harvest. It forces companies to adjust sourcing from multiple regions. Logistics disruptions increase lead times for key ingredient categories. Quality deviations occur when producers rely on lower-grade feedstock. Market participants explore controlled cultivation systems to reduce dependency risks.
Regulatory Complexity Across Markets And Variability In Quality Standards
Companies navigate multiple regulatory frameworks across consumer and industrial applications. Compliance demands differ across fragrance, food, and therapeutic categories. Producers invest heavily in documentation, testing, and certification. The Terpenes market deals with strict purity expectations from regulated sectors. It requires precise traceability to maintain safety and performance norms. Variations in global standards complicate export strategies. Firms allocate resources to continuous audits that raise operating costs. Adoption slows when buyers face uncertainty over compliance pathways.
Market Opportunities:
Expansion Potential In High-Value Wellness, Cosmetic, And Therapeutic Product Development
Brands add terpene-enhanced formulas to premium personal care and wellness lines. Developers evaluate therapeutic potential for mood, sleep, and skin applications. The Terpenes market gains new entry routes through clinical-grade formulations. It supports diversified product portfolios that target specific consumer needs. Companies promote terpene blends for sensory and functional roles. Wellness platforms integrate terpene-rich products to strengthen engagement. Producers test advanced isolates to expand use cases. Demand grows across high-value lifestyle categories.
Rising Scope For Industrial And Green Chemistry Applications In Global Manufacturing
Industrial sectors adopt terpene systems to support cleaner and safer production. Material science teams evaluate bio-based solvents to reduce petrochemical use. The Terpenes market benefits from opportunities in coatings, adhesives, and degreasing lines. It enables manufacturers to meet sustainability commitments across operations. Producers scale engineered terpene capacity to serve global clients. Regulatory support for eco-friendly materials strengthens commercial interest. Growth opportunities widen across industrial hubs that prioritize low-impact inputs.
Market Segmentation Analysis:
By Product Type
The Terpenes market includes pinene, limonene, myrcene, and linalool, each serving distinct roles across fragrance, flavor, and wellness formulations. Pinene supports cleaning and personal care products with its sharp aromatic profile. Limonene remains widely used in food and beverage flavors due to its citrus character. Myrcene offers deeper aromatic notes that appeal to perfumery and aromatherapy lines. Linalool supports skincare and cosmetic applications due to its soft floral scent. Producers improve extraction systems to secure purity across all product types. It helps brands design consistent formulations that meet regulatory and consumer expectations.
- For instance, crude sulfate turpentine from kraft pulping undergoes continuous fractional distillation at atmospheric pressure to separate into sulfur-rich overhead fractions containing 2-20 weight percent α-pinene, with the bottoms fraction yielding α-pinene products with sulfur content as low as 50 parts per million through further distillation at reduced pressure of 200-250 mm Hg. Limonene remains widely used in food and beverage flavors due to its citrus character.
By Type
Segmentation includes monoterpenes, sesquiterpenes, and diterpenes, each providing functional value across industrial and consumer markets. Monoterpenes dominate due to broad natural availability and flexible blending properties. Sesquiterpenes support applications that require stronger chemical stability and richer aromatic depth. Diterpenes gain steady interest in pharmaceutical and specialized industrial pathways that need targeted performance. Producers apply advanced fractionation to maintain structural integrity during processing. The segment supports controlled application development across multiple industries.
- For instance, the plant-based API market shows significant growth in the terpenoids segment due to their diverse medicinal benefits including anti-inflammatory, antioxidant, antibacterial, and anticancer actions, making them desirable for pharmaceutical applications with terpenoids providing a sustainable and environmentally friendly source.
By Source
Source segmentation includes natural and synthetic terpenes, both serving different industry priorities. Natural variants lead demand due to strong clean-label alignment and wide use in wellness, beauty, and food products. Synthetic variants support manufacturers that require cost control, repeatable performance, and stable supply throughout the year. Companies evaluate purity specifications, origin profiles, and regulatory criteria before selecting suitable sources. It supports strategic sourcing models that minimize volatility and maintain product consistency.
By Application
Key applications include cosmetics and personal care, food and beverages, pharmaceuticals, paints and coatings, and rubber. Cosmetics and personal care brands use terpenes for aroma, sensory enhancement, and formulation support. Food and beverage producers adopt terpenes to refine flavor precision and natural positioning. Pharmaceutical companies study terpene properties for therapeutic potential and functional roles in formulations. Industrial users in paints, coatings, and rubber apply terpenes to improve performance, solvency, and processing efficiency. Demand across each segment stays strong due to rising interest in natural chemistry.
By Form
Form segmentation includes liquid and solid variants that support different manufacturing workflows. Liquid terpenes dominate because they enable smoother blending, accurate dosing, and scalable production across consumer and industrial lines. Solid formats cater to specialized processes that require controlled release or stability under defined conditions. Manufacturers adjust form selection based on application needs, equipment capability, and final product design requirements. It supports flexible integration across diverse production environments.
Segmentation:
By Product Type
- Pinene
- Limonene
- Myrcene
- Linalool
By Type
- Monoterpenes
- Sesquiterpenes
- Diterpenes
By Source
By Application
- Cosmetics & Personal Care
- Food & Beverages
- Pharmaceuticals
- Paints & Coatings
- Rubber
By Form
By Region
- North America
- Europe
- Germany
- France
- U.K.
- Italy
- Spain
- Rest of Europe
- Asia Pacific
- China
- Japan
- India
- South Korea
- South-east Asia
- Rest of Asia Pacific
- Latin America
- Brazil
- Argentina
- Rest of Latin America
- Middle East & Africa
- GCC Countries
- South Africa
- Rest of the Middle East and Africa
Regional Analysis:
North America Holding a Significant Share Driven by Strong Personal Care and Flavors Demand
North America holds an estimated 32% share of the terpenes market, supported by mature personal care, home care, and flavor industries. Consumer preference for natural aromatic compounds strengthens terpene adoption across major brands in the United States. Companies expand extraction and purification capacity to meet rising demand for clean-label product lines. The region benefits from advanced regulatory systems that guide quality standards across industries. It maintains a stable supply chain through strong essential oil imports and local production capabilities. The Terpenes market gains steady momentum as manufacturers focus on sustainable and plant-derived ingredients.
Europe Maintaining a Robust Position Through Clean-Label Policies and Fragrance Leadership
Europe accounts for roughly 28% share, driven by strong demand from fragrance, cosmetic, and food formulation sectors. Regulatory pressure on synthetic chemicals encourages higher adoption of natural terpenes across product lines. Leading fragrance houses and specialty chemical firms in France, Germany, and Switzerland drive innovation. Companies invest in research to develop high-purity isolates that meet strict compliance norms. It benefits from strong consumer interest in botanical and plant-derived ingredients. The region maintains high standards for product safety, which supports long-term integration of terpene-based formulations.
Asia-Pacific Emerging as the Fastest-Growing Region with Expanding Industrial and Consumer Demand
Asia-Pacific holds around 30% share, making it the fastest-growing market due to its large manufacturing base. China, India, and Indonesia strengthen supply through extensive essential oil production and processing networks. Rapid growth in food, fragrance, pharmaceutical, and coatings industries supports broad terpene adoption. Regional producers scale capacity to supply both domestic and global clients with cost-competitive terpene variants. It benefits from strong availability of natural feedstock used for terpene extraction. Rising consumer interest in natural cosmetics and wellness products fuels further expansion across the region. Latin America and the Middle East & Africa together account for the remaining 10% share, supported by growing industrial and agricultural applications.
Shape Your Report to Specific Countries or Regions & Enjoy 30% Off!
Key Player Analysis:
- Givaudan
- Symrise AG
- Firmenich (dsm-firmenich)
- International Flavors & Fragrances Inc. (IFF)
- BASF SE
- The Archer-Daniels-Midland Company (ADM)
- Eastman Chemical Company
- Kraton Corporation
- Ingevity
- Treatt PLC
- Arora Aromatics Pvt. Ltd.
- Mentha & Allied Products
- Robertet SA
- Florida Chemical Company
- DRT (Les Dérivés Résiniques et Terpéniques)
- Yasuhara Chemical Co. Ltd.
- Mangalam Organics Limited
- Arakawa Chemicals
- Baolin Chemical Industry Co., Ltd.
Competitive Analysis:
The Terpenes market features strong competition among global fragrance houses, chemical manufacturers, and specialty ingredient suppliers. Companies strengthen portfolios with high-purity isolates and region-specific terpene blends. Leading firms invest in advanced extraction and fermentation systems to improve quality and supply stability. Competitors focus on natural ingredient development to support clean-label trends across cosmetics, food, and wellness lines. It benefits from technological upgrades that help firms expand production capacity. Strategic collaborations help players enter new application areas such as pharmaceuticals and green solvents. Continuous innovation and regulatory alignment shape competitive positioning across global markets.
Recent Developments:
- In November 2025, Givaudan extended its PlanetCaps™ range with a new biodegradable fragrance encapsulation breakthrough for personal care applications. This microplastic-free solution is fully compliant with ECHA regulations, delivering long-lasting fragrance performance in hair and body care. Originally launched in December 2021 as the first high-performing biodegradable fragrance encapsulation on the market, PlanetCaps™ now offers around twenty different hedonics, enabling tailored fragrance experiences. During the first quarter of 2026, Givaudan will increase its production capacity in Singapore to meet the growing demand across all regions.
- In September 2025, Givaudan announced its intention to acquire Belle Aire Creations, a prominent US-based fragrance house known for its creative expertise and strong regional customer relationships. This transaction aligns with Givaudan’s 2030 strategy to extend its customer reach with local and regional customers. Belle Aire Creations has made bold investments in talent, technology, and resources, evolving into a driving force in the fragrance industry. Belle Aire Creations’ business would have represented approximately CHF 65 million of incremental sales to Givaudan’s results in 2024 on a proforma basis. Subject to applicable regulatory processes, the transaction is expected to close by the end of 2025 or early in 2026.
- In September 2025, Givaudan introduced Labdanum Absolute SIGNature1, a new natural fragrance ingredient developed by its House of Naturals in Grasse, France. This ingredient is crafted to deliver a true-to-nature cistus scent that evokes the sunny warmth of the Mediterranean shores. The innovation highlights the company’s strategic focus on natural ingredients and dedication to advancing the boundaries of fragrance development through advanced engineering processes to elevate the crude cistus extract into a highly refined labdanum absolute.
- In August 2025, IFF announced plans to divest its soy protein concentrates and lecithin segment to Bunge Global. While the company did not reveal financial details, it indicated that these operations were expected to generate approximately $240 million in revenue for 2024. This divestiture is part of IFF’s strategy to refine its portfolio as the company pivots towards higher-margin sectors.
Report Coverage:
The research report offers an in-depth analysis based on By Product Type (Pinene, Limonene, Myrcene, Linalool), By Type (Monoterpenes, Sesquiterpenes, Diterpenes), By Source (Natural, Synthetic), By Application (Cosmetics & Personal Care, Food & Beverages, Pharmaceuticals, Paints & Coatings, Rubber), and By Form (Liquid, Solid). It details leading market players, providing an overview of their business, product offerings, investments, revenue streams, and key applications. Additionally, the report includes insights into the competitive environment, SWOT analysis, current market trends, as well as the primary drivers and constraints. Furthermore, it discusses various factors that have driven market expansion in recent years. The report also explores market dynamics, regulatory scenarios, and technological advancements that are shaping the industry. It assesses the impact of external factors and global economic changes on market growth. Lastly, it provides strategic recommendations for new entrants and established companies to navigate the complexities of the market.
Future Outlook:
- Demand for natural aromatic ingredients will strengthen across personal care and wellness categories.
- Bio-engineered terpene production will gain traction through improved fermentation technology.
- Industrial applications will expand through adoption of terpene-based green solvents.
- Pharmaceutical interest will rise with ongoing evaluation of terpene bioactivity.
- Flavor and fragrance developers will introduce advanced blends for premium product lines.
- Asia-Pacific producers will scale capacity to support global supply networks.
- Regulatory support for natural chemicals will improve adoption in food and cosmetic sectors.
- Companies will invest in high-purity fractionation for targeted specialty applications.
- Sustainability programs will increase reliance on plant-based terpene sourcing.
- Strategic mergers and partnerships will reshape competitive dynamics.


