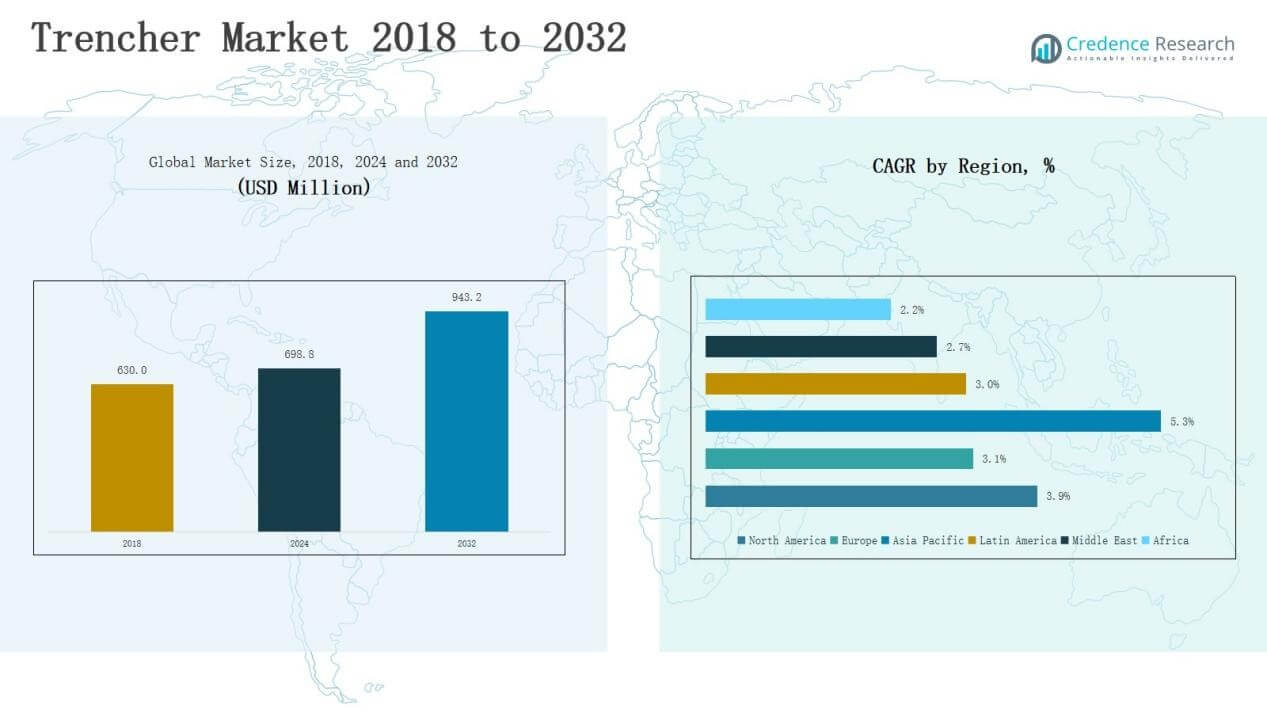
Chapter No. 1 : Introduction 29
1.1. Report Description 29
1.1.1. Purpose of the Report 29
1.1.2. USP & Key Offerings 29
1.2. Key Benefits for Stakeholders 29
1.3. Target Audience 30
1.4. Report Scope 31
Chapter No. 2 : Executive Summary 33
2.1. Trencher Market Snapshot 33
2.2. Global Trencher Market, 2017 – 2022 (K Units) (USD Million) 34
2.1. Insights from Primary Respondents 35
Chapter No. 3 : Impact Analysis of COVID 19 & Russia-Ukraine War on Trencher Market 36
3.1. Impact Assessment of COVID-19 Pandemic, By Region 36
3.1.1. Supply chain disruptions 36
3.1.2. Demand fluctuations 36
3.1.3. Shift in product mix 36
3.1.4. Reduced industrial activity 36
3.1.5. Temporary disruptions and delays 36
3.1.6. Shift in focus towards essential services 36
3.2. Russia-Ukraine War Impacts 37
3.2.1. Uncertainty and economic instability 37
3.2.2. Supply chain disruptions 37
3.2.3. Regional market shifts 37
3.2.4. Shift in government priorities 37
Chapter No. 4 : Trencher Market – Industry Analysis 38
4.1. Introduction 38
4.2. Market Drivers 39
4.2.1. Driving Factor 1 Analysis 39
4.2.2. Driving Factor 2 Analysis 40
4.3. Market Restraints 41
4.3.1. Restraining Factor Analysis 41
4.4. Market Opportunities 42
4.4.1. Market Opportunity Analysis 42
4.5. Porter’s Five Forces Analysis 43
4.6. Value Chain Analysis 44
4.7. Buying Criteria 45
Chapter No. 5 : Import Export Analysis 46
5.1. Import Analysis by Region 46
5.1.1. Global Trencher Market Import Volume/Revenue, By Region, 2017 – 2022 46
5.2. Export Analysis by Region 47
5.2.1. Global Trencher Market Export Volume/Revenue, By Region, 2017 – 2022 47
Chapter No. 6 : Demand Supply Analysis 48
6.1. Demand Analysis by Region 48
6.1.1. Global Trencher Market Demand Volume/Revenue, By Region, 2017 – 2022 48
6.2. Supply Analysis by Region 49
6.2.1. Global Trencher Market Supply Volume/Revenue, By Region, 2017 – 2022 49
Chapter No. 7 : Production Analysis 50
7.1. Production Analysis by Region 50
7.1.1. Global Trencher Market Production, By Region, 2017 – 2022 50
7.1.2. Global Trencher Market Production Volume, By Region, 2017 – 2022 (K Units) 50
Chapter No. 8 : Price Analysis 51
8.1. Price Analysis by Region 51
8.1.1. Global Trencher Market Price, By Region, 2017 – 2022 51
8.1.2. Global Type Market Price, By Region, 2017 – 2022 51
8.2. Price Analysis by Type 52
8.2.1. Global Trencher Market Price, By Type, 2017 – 2022 52
8.2.2. Global Type Market Price, By Type, 2017 – 2022 52
Chapter No. 9 : Raw Materials Analysis 53
9.1. Key Raw Materials and Suppliers 53
9.2. Key Raw Materials Price Trend 53
Chapter No. 10 : Manufacturing Cost Analysis 54
10.1. Manufacturing Cost Analysis 54
10.1.1. Manufacturing Cost Analysis 54
10.2. Manufacturing Process 54
10.2.1. Manufacturing Process 54
Chapter No. 11 : Analysis Competitive Landscape 55
11.1. Company Market Share Analysis – 2022 55
11.1.1. Global Trencher Market: Company Market Share, by Volume, 2022 55
11.1.2. Global Trencher Market: Company Market Share, by Revenue2022 55
11.1.3. Global Trencher Market: Top 6 Company Market Share, by Revenue2022 56
11.1.4. Global Trencher Market: Top 3 Company Market Share, by Revenue2022 56
11.1. Global Trencher Market Company Volume Market Share, 2022 57
11.2. Global Trencher Market Company Revenue Market Share, 2022 58
11.3. Company Assessment Metrics, 2022 59
11.3.1. Stars 59
11.3.2. Emerging Leaders 59
11.3.3. Pervasive Players 59
11.3.4. Participants 59
11.4. Strategic Developments 60
11.4.1. Acquisitions & Mergers 60
11.4.2. New Product Launch 60
11.4.3. Regional Expansion 60
11.5. Key Players Product Matrix 61
Chapter No. 12 : PESTEL & Adjacent Market Analysis 62
12.1. PESTEL 62
12.1.1. Political Factors 62
12.1.2. Economic Factors 62
12.1.3. Social Factors 62
12.1.4. Technological Factors 62
12.1.5. Environmental Factors 62
12.1.6. Legal Factors 62
12.2. Adjacent Market Analysis 62
Chapter No. 13 : Trencher Market – By Type Segment Analysis 63
13.1. Trencher Market Overview, by Type Segment 63
13.1.1. Trencher Market Volume Share, By Type, 2022 & 2030 64
13.1.2. Trencher Market Revenue Share, By Type, 2022 & 2030 64
13.1.3. Trencher Market Attractiveness Analysis, By Type 65
13.1.4. Incremental Revenue Growth Opportunity, by Type, 2023 – 2030 65
13.1.5. Trencher Market Revenue, By Type, 2017, 2022, 2026 & 2030 66
13.2. Wheel Trencher 67
13.2.1. Global Wheel Trencher Trencher Market Volume & Revenue, By Region, 2017 – 2022 (K Units) (USD Million) 68
13.2.2. Global Wheel Trencher Trencher Market Volume & Revenue, By Region, 2017 – 2022 (K Units) (USD Million) 68
13.3. Chain Trencher 69
13.3.1. Global Chain Trencher Trencher Market Volume & Revenue, By Region, 2017 – 2022 (K Units) (USD Million) 70
13.3.2. Global Chain Trencher Trencher Market Volume & Revenue, By Region, 2017 – 2022 (K Units) (USD Million) 70
13.4. Micro Trencher 71
13.4.1. Global Micro Trencher Trencher Market Volume & Revenue, By Region, 2017 – 2022 (K Units) (USD Million) 72
13.4.2. Global Micro Trencher Trencher Market Volume & Revenue, By Region, 2017 – 2022 (K Units) (USD Million) 72
13.5. Surface Trencher 73
13.5.1. Global Surface Trencher Trencher Market Volume & Revenue, By Region, 2017 – 2022 (K Units) (USD Million) 74
13.5.2. Global Surface Trencher Trencher Market Volume & Revenue, By Region, 2017 – 2022 (K Units) (USD Million) 74
13.6. Others 75
13.6.1. Global Others Trencher Market Volume & Revenue, By Region, 2017 – 2022 (K Units) (USD Million) 76
13.6.2. Global Others Trencher Market Volume & Revenue, By Region, 2017 – 2022 (K Units) (USD Million) 76
Chapter No. 14 : Trencher Market – By Application Segment Analysis 77
14.1. Trencher Market Overview, by Application Segment 77
14.1.1. Trencher Market Volume Share, By Application, 2022 & 2030 78
14.1.2. Trencher Market Revenue Share, By Application, 2022 & 2030 78
14.1.3. Trencher Market Attractiveness Analysis, By Application 79
14.1.4. Incremental Revenue Growth Opportunity, by Application, 2023 – 2030 79
14.1.5. Trencher Market Revenue, By Application, 2017, 2022, 2026 & 2030 80
14.2. Oil and gas pipeline 81
14.2.1. Global Oil and gas pipeline Trencher Market Volume & Revenue, By Region, 2017 – 2022 (K Units) (USD Million) 82
14.2.2. Global Oil and gas pipeline Trencher Market Volume & Revenue, By Region, 2017 – 2022 (K Units) (USD Million) 82
14.3. Energy cables and fiber optic laying 83
14.3.1. Global Energy cables and fiber optic laying Trencher Market Volume & Revenue, By Region, 2017 – 2022 (K Units) (USD Million) 84
14.3.2. Global Energy cables and fiber optic laying Trencher Market Volume & Revenue, By Region, 2017 – 2022 (K Units) (USD Million) 84
14.4. Telecommunication networks construction 85
14.4.1. Global Telecommunication networks construction Trencher Market Volume & Revenue, By Region, 2017 – 2022 (K Units) (USD Million) 86
14.4.2. Global Telecommunication networks construction Trencher Market Volume & Revenue, By Region, 2017 – 2022 (K Units) (USD Million) 86
14.5. Sewers and water pipelines 87
14.5.1. Global Sewers and water pipelines Trencher Market Volume & Revenue, By Region, 2017 – 2022 (K Units) (USD Million) 88
14.5.2. Global Sewers and water pipelines Trencher Market Volume & Revenue, By Region, 2017 – 2022 (K Units) (USD Million) 88
14.6. Others (Mining & Agriculture) 89
14.6.1. Global Others (Mining & Agriculture) Trencher Market Volume & Revenue, By Region, 2017 – 2022 (K Units) (USD Million) 90
14.6.2. Global Others (Mining & Agriculture) Trencher Market Volume & Revenue, By Region, 2017 – 2022 (K Units) (USD Million) 90
Chapter No. 15 : Trencher Market – By Operating Type Segment Analysis 91
15.1. Trencher Market Overview, by Operating Type Segment 91
15.1.1. Trencher Market Volume Share, By Operating Type, 2022 & 2030 92
15.1.2. Trencher Market Revenue Share, By Operating Type, 2022 & 2030 92
15.1.3. Trencher Market Attractiveness Analysis, By Operating Type 93
15.1.4. Incremental Revenue Growth Opportunity, by Operating Type, 2023 – 2030 93
15.1.5. Trencher Market Revenue, By Operating Type, 2017, 2022, 2026 & 2030 94
15.2. Ride-on 95
15.2.1. Global Ride-on Trencher Market Volume & Revenue, By Region, 2017 – 2022 (K Units) (USD Million) 96
15.2.2. Global Ride-on Trencher Market Volume & Revenue, By Region, 2023 – 2030 (K Units) (USD Million) 96
15.3. Walk-behind 97
15.3.1. Global Walk-behind Trencher Market Volume & Revenue, By Region, 2017 – 2022 (K Units) (USD Million) 98
15.3.2. Global Walk-behind Trencher Market Volume & Revenue, By Region, 2023 – 2030 (K Units) (USD Million) 98
Chapter No. 16 : Trencher Market – By Sales Channel Segment Analysis 99
16.1. Trencher Market Overview, by Sales Channel Segment 99
16.1.1. Trencher Market Revenue Share, By Sales Channel, 2022 & 2030 100
16.1.2. Trencher Market Revenue Share, By Sales Channel, 2022 & 2030 100
16.1.3. Trencher Market Attractiveness Analysis, By Sales Channel 101
16.1.4. Incremental Revenue Growth Opportunity, by Sales Channel, 2023 – 2030 101
16.1.5. Trencher Market Revenue, By Sales Channel, 2017, 2022, 2026 & 2030 102
16.2. Direct Channel 103
16.2.1. Global Direct Channel Trencher Market Volume & Revenue, By Region, 2017 – 2022 (K Units) (USD Million) 104
16.2.2. Global Direct Channel Trencher Market Volume & Revenue, By Region, 2023 – 2030 (K Units) (USD Million) 104
16.3. Distribution Channel 105
16.3.1. Global Distribution Channel Trencher Market Volume & Revenue, By Region, 2017 – 2022 (K Units) (USD Million) 106
16.3.2. Global Distribution Channel Trencher Market Volume & Revenue, By Region, 2023 – 2030 (K Units) (USD Million) 106
Chapter No. 17 : Trencher Market – Regional Analysis 107
17.1. Trencher Market Overview, by Regional Segments 107
17.2. Region 108
17.2.1. Global Trencher Market Volume Share, By Region, 2022 & 2030 108
17.2.2. Global Trencher Market Revenue Share, By Region, 2022 & 2030 108
17.2.3. Trencher Market Attractiveness Analysis, By Region 109
17.2.4. Incremental Revenue Growth Opportunity, by Region, 2023 – 2030 109
17.2.5. Trencher Market Revenue, By Region, 2017, 2022, 2026 & 2030 110
17.2.6. Global Trencher Market Volume & Revenue, By Region, 2017 – 2022 (K Units) (USD Million) 111
17.2.7. Global Trencher Market Volume & Revenue, By Region, 2023 – 2030 (K Units) (USD Million) 111
17.3. Type 112
17.3.1. Global Trencher Market Volume & Revenue, By Type, 2017 – 2022 (K Units) (USD Million) 112
17.3.2. Global Trencher Market Volume & Revenue, By Type, 2023 – 2030 (K Units) (USD Million) 112
17.4. Application 113
17.4.1. Global Trencher Market Volume & Revenue, By Application, 2017 – 2022 (K Units) (USD Million) 113
17.4.2. Global Trencher Market Volume & Revenue, By Application, 2023 – 2030 (K Units) (USD Million) 113
17.5. Operating Type 114
17.5.1. Global Trencher Market Volume & Revenue, By Operating Type, 2017 – 2022 (K Units) (USD Million) 114
17.5.2. Global Trencher Market Volume & Revenue, By Operating Type, 2023 – 2030 (K Units) (USD Million) 114
17.6. Sales Channel 115
17.6.1. Global Trencher Market Volume & Revenue, By Sales Channel, 2017 – 2022 (K Units) (USD Million) 115
17.6.2. Global Trencher Market Volume & Revenue, By Sales Channel, 2023 – 2030 (K Units) (USD Million) 115
Chapter No. 18 : Trencher Market – North America 116
18.1. North America 116
18.1. Key Highlights 116
18.1.1. North America Trencher Market Volume, By Country, 2017 – 2022 (K Units) 117
18.1.2. North America Trencher Market Revenue, By Country, 2017 – 2022 (USD Million) 118
18.1.2.1. North America Trencher Market Volume, By Type, 2017 – 2022 (K Units) 119
18.1.3. North America Trencher Market Revenue, By Type, 2017 – 2022 (USD Million) 120
18.1.4. North America Trencher Market Volume, By Application, 2017 – 2022 (K Units) 121
18.1.5. North America Trencher Market Revenue, By Application, 2017 – 2022 (USD Million) 122
18.1.6. North America Trencher Market Volume, By Operating Type, 2017 – 2022 (K Units) 123
18.1.7. North America Trencher Market Revenue, By Operating Type, 2017 – 2022 (USD Million) 124
18.1.8. North America Trencher Market Volume, By Sales Channel, 2017 – 2022 (K Units) 125
18.1.9. North America Trencher Market Revenue, By Sales Channel, 2017 – 2022 (USD Million) 126
18.1.10. U.S. 127
18.1.11. Canada 127
18.1.12. Mexico 127
Chapter No. 19 : Trencher Market – Europe 128
19.1. Europe 128
19.2. Key Highlights 128
19.2.1. Europe Trencher Market Volume, By Country, 2017 – 2022 (K Units) 129
19.2.2. Europe Trencher Market Revenue, By Country, 2017 – 2022 (USD Million) 130
19.2.3. Europe Trencher Market Volume, By Type, 2017 – 2022 (K Units) 131
19.2.4. Europe Trencher Market Revenue, By Type, 2017 – 2022 (USD Million) 132
19.2.5. Europe Trencher Market Volume, By Application, 2017 – 2022 (K Units) 133
19.2.6. Europe Trencher Market Revenue, By Application, 2017 – 2022 (USD Million) 134
19.2.7. Europe Trencher Market Volume, By Operating Type, 2017 – 2022 (K Units) 135
19.2.8. Europe Trencher Market Revenue, By Operating Type, 2017 – 2022 (USD Million) 136
19.2.9. Europe Trencher Market Volume, By Sales Channel, 2017 – 2022 (K Units) 137
19.2.10. Europe Trencher Market Revenue, By Sales Channel, 2017 – 2022 (USD Million) 138
19.2.11. UK 139
19.2.12. France 139
19.2.13. Germany 139
19.2.14. Italy 139
19.2.15. Spain 139
19.2.16. Russia 139
19.2.17. BENELUX 139
19.2.18. Sweden 139
19.2.19. Denmark 139
19.2.20. Poland 139
19.2.21. Austria 139
19.2.22. Rest of Europe 139
Chapter No. 20 : Trencher Market – Asia Pacific 140
20.1. Asia Pacific 140
20.2. Key Highlights 140
20.2.1. Asia Pacific Trencher Market Volume, By Country, 2017 – 2022 (K Units) 141
20.2.2. Asia Pacific Trencher Market Revenue, By Country, 2017 – 2022 (USD Million) 142
20.2.3. Asia Pacific Trencher Market Volume, By Type, 2017 – 2022 (K Units) 143
20.2.4. Asia Pacific Trencher Market Revenue, By Type, 2017 – 2022 (USD Million) 144
20.2.5. Asia Pacific Trencher Market Volume, By Application, 2017 – 2022 (K Units) 145
20.2.6. Asia Pacific Trencher Market Revenue, By Application, 2017 – 2022 (USD Million) 146
20.2.7. Asia Pacific Trencher Market Volume, By Operating Type, 2017 – 2022 (K Units) 147
20.2.8. Asia Pacific Trencher Market Revenue, By Operating Type, 2017 – 2022 (USD Million) 148
20.2.9. Asia Pacific Trencher Market Volume, By Sales Channel, 2017 – 2022 (K Units) 149
20.2.10. Asia Pacific Trencher Market Revenue, By Sales Channel, 2017 – 2022 (USD Million) 150
20.2.11. China 151
20.2.12. Japan 151
20.2.13. South Korea 151
20.2.14. India 151
20.2.15. Thailand 151
20.2.16. Indonesia 151
20.2.17. Vietnam 151
20.2.18. Malaysia 151
20.2.19. Philippines 151
20.2.20. Taiwan 151
20.2.21. Rest of Asia Pacific 151
Chapter No. 21 : Trencher Market – Latin America 152
21.1. Latin America 152
21.2. Key Highlights 152
21.2.1. Latin America Trencher Market Volume, By Country, 2017 – 2022 (K Units) 153
21.2.2. Latin America Trencher Market Revenue, By Country, 2017 – 2022 (USD Million) 154
21.2.3. Latin America Trencher Market Volume, By Type, 2017 – 2022 (K Units) 155
21.2.4. Latin America Trencher Market Revenue, By Type, 2017 – 2022 (USD Million) 156
21.2.5. Latin America Trencher Market Volume, By Application, 2017 – 2022 (K Units) 157
21.2.6. Latin America Trencher Market Revenue, By Application, 2017 – 2022 (USD Million) 158
21.2.7. Latin America Trencher Market Volume, By Operating Type, 2017 – 2022 (K Units) 159
21.2.8. Latin America Trencher Market Revenue, By Operating Type, 2017 – 2022 (USD Million) 160
21.2.9. Latin America Trencher Market Volume, By Sales Channel, 2017 – 2022 (K Units) 161
21.2.10. Latin America Trencher Market Revenue, By Sales Channel, 2017 – 2022 (USD Million) 162
21.2.11. Brazil 163
21.2.12. Argentina 163
21.2.13. Colombia 163
21.2.14. Chile 163
21.2.15. Peru 163
21.2.16. Rest of Latin America 163
Chapter No. 22 : Trencher Market – Middle East 164
22.1. The Middle-East 164
22.2. Key Highlights 164
22.2.1. Middle East Trencher Market Volume, By Country, 2017 – 2022 (K Units) 165
22.2.2. Middle East Trencher Market Revenue, By Country, 2017 – 2022 (USD Million) 166
22.2.3. Middle East Trencher Market Volume, By Type, 2017 – 2022 (K Units) 167
22.2.4. Middle East Trencher Market Revenue, By Type, 2017 – 2022 (USD Million) 168
22.2.5. Middle East Trencher Market Volume, By Application, 2017 – 2022 (K Units) 169
22.2.6. Middle East Trencher Market Revenue, By Application, 2017 – 2022 (USD Million) 170
22.2.7. Middle East Trencher Market Volume, By Operating Type, 2017 – 2022 (K Units) 171
22.2.8. Middle East Trencher Market Revenue, By Operating Type, 2017 – 2022 (USD Million) 172
22.2.9. Middle East Trencher Market Volume, By Sales Channel, 2017 – 2022 (K Units) 173
22.2.10. Middle East Trencher Market Revenue, By Sales Channel, 2017 – 2022 (USD Million) 174
22.2.11. GCC Countries 175
22.2.12. Israel 175
22.2.13. Turkey 175
22.2.14. Iran 175
22.2.15. Rest of Middle East & Africa 175
Chapter No. 23 : Trencher Market – Africa 176
23.1. Africa 176
23.2. Key Highlights 176
23.2.1. Africa Trencher Market Volume, By Country, 2017 – 2022 (K Units) 177
23.2.2. Africa Trencher Market Revenue, By Country, 2017 – 2022 (USD Million) 178
23.2.3. Africa Trencher Market Volume, By Type, 2017 – 2022 (K Units) 179
23.2.4. Africa Trencher Market Revenue, By Type, 2017 – 2022 (USD Million) 180
23.2.5. Africa Trencher Market Volume, By Application, 2017 – 2022 (K Units) 181
23.2.6. Africa Trencher Market Revenue, By Application, 2017 – 2022 (USD Million) 182
23.2.7. Africa Trencher Market Volume, By Operating Type, 2017 – 2022 (K Units) 183
23.2.8. Africa Trencher Market Revenue, By Operating Type, 2017 – 2022 (USD Million) 184
23.2.9. Africa Trencher Market Volume, By Sales Channel, 2017 – 2022 (K Units) 185
23.2.10. Africa Trencher Market Revenue, By Sales Channel, 2017 – 2022 (USD Million) 186
23.2.11. South Africa 187
23.2.12. Egypt 187
23.2.13. Nigeria 187
23.2.14. Algeria 187
23.2.15. Morocco 187
23.2.16. Rest of Africa 187
Chapter No. 24 : Company Profiles 188
24.1. Ditch Witch 188
24.1.1. Company Overview 188
24.1.2. Product Portfolio 188
24.1.3. Swot Analysis 188
24.1.4. Business Strategy 189
24.1.5. Financial Overview 189
24.2. Vermeer Corporation 190
24.3. TESMEC S.p.A 190
24.4. Wolfe Equipment 190
24.5. Barreto Manufacturing, Inc. 190
24.6. Cleveland Trencher Company, Inc. 190
24.7. Inter-Drain Sales BV 190
24.8. EZ-Trench, LLC 190
24.9. Port Industries 190
24.10. UNAC SAS 190
24.11. The Toro Company 190
24.12. Guntert & Zimmerman Const. Div., Inc. 190
24.13. Mastenbroek Limited 190
24.14. Shandong Gaotang Xinhang Machinery Co. Ltd. 190
24.15. Rongcheng Shenyuan County Machinery co., LTD. 190
Chapter No. 25 : Research Methodology 191
25.1. Research Methodology 191
25.2. Phase I – Secondary Research 192
25.3. Phase II – Data Modeling 192
25.3.1. Company Share Analysis Model 193
25.3.2. Revenue Based Modeling 193
25.4. Phase III – Primary Research 194
25.5. Research Limitations 195
25.5.1. Assumptions 195
List of Figures
FIG NO. 1. Global Trencher Market Volume & Revenue, 2017 – 2022 (K Units) (USD Million) 33
FIG NO. 2. Porter’s Five Forces Analysis for Global Trencher Market 42
FIG NO. 3. Value Chain Analysis for Global Trencher Market 43
FIG NO. 4. Global Trencher Market Import Volume/Revenue, By Region, 2017 – 2022 45
FIG NO. 5. Global Trencher Market Export Volume/Revenue, By Region, 2017 – 2022 46
FIG NO. 6. Global Trencher Market Demand Volume/Revenue, By Region, 2017 – 2022 47
FIG NO. 7. Global Trencher Market Supply Volume/Revenue, By Region, 2017 – 2022 48
FIG NO. 8. Global Trencher Market Production, By Region, 2017 – 2022 49
FIG NO. 9. Global Trencher Market Price, By Region, 2017 – 2022 50
FIG NO. 10. Global Trencher Market Price, By Type, 2017 – 2022 51
FIG NO. 11. Raw Materials Price Trend Analysis, 2017 – 2022 52
FIG NO. 12. Manufacturing Cost Analysis 53
FIG NO. 13. Manufacturing Process 53
FIG NO. 14. Company Share Analysis, 2022 54
FIG NO. 15. Company Share Analysis, 2022 54
FIG NO. 16. Company Share Analysis, 2022 55
FIG NO. 17. Company Share Analysis, 2022 55
FIG NO. 18. Trencher Market – Company Volume Market Share, 2022 56
FIG NO. 19. Trencher Market – Company Revenue Market Share, 2022 57
FIG NO. 20. Trencher Market Volume Share, By Type, 2022 & 2030 63
FIG NO. 21. Trencher Market Revenue Share, By Type, 2022 & 2030 63
FIG NO. 22. Market Attractiveness Analysis, By Type 64
FIG NO. 23. Incremental Revenue Growth Opportunity by Type 64
FIG NO. 24. Trencher Market Revenue, By Type, 2017, 2022, 2026 & 2030 65
FIG NO. 25. Global Trencher Market for Wheel Trencher, Volume & Revenue (K Units) (USD Million) 2017 – 2030 66
FIG NO. 26. Global Trencher Market for Chain Trencher, Volume & Revenue (K Units) (USD Million) 2017 – 2030 68
FIG NO. 27. Global Trencher Market for Micro Trencher, Volume & Revenue (K Units) (USD Million) 2017 – 2030 70
FIG NO. 28. Global Trencher Market for Surface Trencher, Volume & Revenue (K Units) (USD Million) 2017 – 2030 72
FIG NO. 29. Global Trencher Market for Others, Volume & Revenue (K Units) (USD Million) 2017 – 2030 74
FIG NO. 30. Trencher Market Volume Share, By Application, 2022 & 2030 77
FIG NO. 31. Trencher Market Revenue Share, By Application, 2022 & 2030 77
FIG NO. 32. Market Attractiveness Analysis, By Application 78
FIG NO. 33. Incremental Revenue Growth Opportunity by Application 78
FIG NO. 34. Trencher Market Revenue, By Application, 2017, 2022, 2026 & 2030 79
FIG NO. 35. Global Trencher Market for Oil and gas pipeline, Volume & Revenue (K Units) (USD Million) 2017 – 2030 80
FIG NO. 36. Global Trencher Market for Energy cables and fiber optic laying, Volume & Revenue (K Units) (USD Million) 2017 – 2030 82
FIG NO. 37. Global Trencher Market for Telecommunication networks construction, Volume & Revenue (K Units) (USD Million) 2017 – 2030 84
FIG NO. 38. Global Trencher Market for Sewers and water pipelines, Volume & Revenue (K Units) (USD Million) 2017 – 2030 86
FIG NO. 39. Global Trencher Market for Others (Mining & Agriculture), Volume & Revenue (K Units) (USD Million) 2017 – 2030 88
FIG NO. 40. Trencher Market Volume Share, By Operating Type, 2022 & 2030 91
FIG NO. 41. Trencher Market Revenue Share, By Operating Type, 2022 & 2030 91
FIG NO. 42. Market Attractiveness Analysis, By Operating Type 92
FIG NO. 43. Incremental Revenue Growth Opportunity by Operating Type 92
FIG NO. 44. Trencher Market Revenue, By Operating Type, 2017, 2022, 2026 & 2030 93
FIG NO. 45. Global Trencher Market for Ride-on, Volume & Revenue (K Units) (USD Million) 2017 – 2030 94
FIG NO. 46. Global Trencher Market for Walk-behind, Volume & Revenue (K Units) (USD Million) 2017 – 2030 96
FIG NO. 47. Trencher Market Revenue Share, By Sales Channel, 2022 & 2030 99
FIG NO. 48. Trencher Market Revenue Share, By Sales Channel, 2022 & 2030 99
FIG NO. 49. Market Attractiveness Analysis, By Sales Channel 100
FIG NO. 50. Incremental Revenue Growth Opportunity by Sales Channel 100
FIG NO. 51. Trencher Market Revenue, By Sales Channel, 2017, 2022, 2026 & 2030 101
FIG NO. 52. Global Trencher Market for Direct Channel, Volume & Revenue (K Units) (USD Million) 2017 – 2030 102
FIG NO. 53. Global Trencher Market for Distribution Channel, Volume & Revenue (K Units) (USD Million) 2017 – 2030 104
FIG NO. 54. Global Trencher Market Volume Share, By Region, 2022 & 2030 107
FIG NO. 55. Global Trencher Market Revenue Share, By Region, 2022 & 2030 107
FIG NO. 56. Market Attractiveness Analysis, By Region 108
FIG NO. 57. Incremental Revenue Growth Opportunity by Region 108
FIG NO. 58. Trencher Market Revenue, By Region, 2017, 2022, 2026 & 2030 109
FIG NO. 59. North America Trencher Market Volume & Revenue, 2017 – 2022 (K Units) (USD Million) 115
FIG NO. 60. Europe Trencher Market Volume & Revenue, 2017 – 2022 (K Units) (USD Million) 127
FIG NO. 61. Asia Pacific Trencher Market Volume & Revenue, 2017 – 2022 (K Units) (USD Million) 139
FIG NO. 62. Latin America Trencher Market Volume & Revenue, 2017 – 2022 (K Units) (USD Million) 151
FIG NO. 63. The Middle-East Trencher Market Volume & Revenue, 2017 – 2022 (K Units) (USD Million) 163
FIG NO. 64. Africa Trencher Market Volume & Revenue, 2017 – 2022 (K Units) (USD Million) 175
FIG NO. 65. Research Methodology – Detailed View 190
FIG NO. 66. Research Methodology 191
List of Tables
TABLE NO. 1. : Global Trencher Market: Snapshot 31
TABLE NO. 2. : Drivers for the Trencher Market: Impact Analysis 37
TABLE NO. 3. : Restraints for the Trencher Market: Impact Analysis 39
TABLE NO. 4. : Global Trencher Market Volume & Revenue, By Region, 2017 – 2022 (K Units) 48
TABLE NO. 5. : Global Trencher Market Volume & Revenue, By Region, 2017 – 2022 49
TABLE NO. 6. : Global Trencher Market Volume & Revenue, By Type, 2017 – 2022 50
TABLE NO. 7. : Key Raw Materials & Suppliers 51
TABLE NO. 8. : Global Wheel Trencher Trencher Market Volume & Revenue, By Region, 2017 – 2022 (K Units) (USD Million) 66
TABLE NO. 9. : Global Wheel Trencher Trencher Market Volume & Revenue, By Region, 2023– 2030 (K Units) (USD Million) 66
TABLE NO. 10. : Global Chain Trencher Trencher Market Volume & Revenue, By Region, 2017 – 2022 (K Units) (USD Million) 68
TABLE NO. 11. : Global Chain Trencher Trencher Market Volume & Revenue, By Region, 2023– 2030 (K Units) (USD Million) 68
TABLE NO. 12. : Global Micro Trencher Trencher Market Volume & Revenue, By Region, 2017 – 2022 (K Units) (USD Million) 70
TABLE NO. 13. : Global Micro Trencher Trencher Market Volume & Revenue, By Region, 2023– 2030 (K Units) (USD Million) 70
TABLE NO. 14. : Global Surface Trencher Trencher Market Volume & Revenue, By Region, 2017 – 2022 (K Units) (USD Million) 72
TABLE NO. 15. : Global Surface Trencher Trencher Market Volume & Revenue, By Region, 2023– 2030 (K Units) (USD Million) 72
TABLE NO. 16. : Global Others Trencher Market Volume & Revenue, By Region, 2017 – 2022 (K Units) (USD Million) 74
TABLE NO. 17. : Global Others Trencher Market Volume & Revenue, By Region, 2023– 2030 (K Units) (USD Million) 74
TABLE NO. 18. : Global Oil and gas pipeline Trencher Market Volume & Revenue, By Region, 2017 – 2022 (K Units) (USD Million) 80
TABLE NO. 19. : Global Oil and gas pipeline Trencher Market Volume & Revenue, By Region, 2023– 2030 (K Units) (USD Million) 80
TABLE NO. 20. : Global Energy cables and fiber optic laying Trencher Market Volume & Revenue, By Region, 2017 – 2022 (K Units) (USD Million) 82
TABLE NO. 21. : Global Energy cables and fiber optic laying Trencher Market Volume & Revenue, By Region, 2023– 2030 (K Units) (USD Million) 82
TABLE NO. 22. : Global Telecommunication networks construction Trencher Market Volume & Revenue, By Region, 2017 – 2022 (K Units) (USD Million) 84
TABLE NO. 23. : Global Telecommunication networks construction Trencher Market Volume & Revenue, By Region, 2023– 2030 (K Units) (USD Million) 84
TABLE NO. 24. : Global Sewers and water pipelines Trencher Market Volume & Revenue, By Region, 2017 – 2022 (K Units) (USD Million) 86
TABLE NO. 25. : Global Sewers and water pipelines Trencher Market Volume & Revenue, By Region, 2023– 2030 (K Units) (USD Million) 86
TABLE NO. 26. : Global Others (Mining & Agriculture) Trencher Market Volume & Revenue, By Region, 2017 – 2022 (K Units) (USD Million) 88
TABLE NO. 27. : Global Others (Mining & Agriculture) Trencher Market Volume & Revenue, By Region, 2023– 2030 (K Units) (USD Million) 88
TABLE NO. 28. : Global Ride-on Trencher Market Volume & Revenue, By Region, 2017 – 2022 (K Units) (USD Million) 94
TABLE NO. 29. : Global Ride-on Trencher Market Volume & Revenue, By Region, 2023– 2030 (K Units) (USD Million) 94
TABLE NO. 30. : Global Walk-behind Trencher Market Volume & Revenue, By Region, 2017 – 2022 (K Units) (USD Million) 96
TABLE NO. 31. : Global Walk-behind Trencher Market Volume & Revenue, By Region, 2023– 2030 (K Units) (USD Million) 96
TABLE NO. 32. : Global Direct Channel Trencher Market Volume & Revenue, By Region, 2017 – 2022 (K Units) (USD Million) 102
TABLE NO. 33. : Global Direct Channel Trencher Market Volume & Revenue, By Region, 2023– 2030 (K Units) (USD Million) 102
TABLE NO. 34. : Global Distribution Channel Trencher Market Volume & Revenue, By Region, 2017 – 2022 (K Units) (USD Million) 104
TABLE NO. 35. : Global Distribution Channel Trencher Market Volume & Revenue, By Region, 2023– 2030 (K Units) (USD Million) 104
TABLE NO. 36. : Global Trencher Market Volume & Revenue, By Region, 2017 – 2022 (K Units) (USD Million) 109
TABLE NO. 37. : Global Trencher Market Volume & Revenue, By Region, 2023– 2030 (K Units) (USD Million) 109
TABLE NO. 38. : Global Trencher Market Volume & Revenue, By Type, 2017 – 2022 (K Units) (USD Million) 110
TABLE NO. 39. : Global Trencher Market Volume & Revenue, By Type, 2023– 2030 (K Units) (USD Million) 110
TABLE NO. 40. : Global Trencher Market Volume & Revenue, By Application, 2017 – 2022 (K Units) (USD Million) 111
TABLE NO. 41. : Global Trencher Market Volume & Revenue, By Application, 2023– 2030 (K Units) (USD Million) 111
TABLE NO. 42. : Global Trencher Market Volume & Revenue, By Operating Type, 2017 – 2022 (K Units) (USD Million) 112
TABLE NO. 43. : Global Trencher Market Volume & Revenue, By Operating Type, 2023– 2030 (K Units) (USD Million) 112
TABLE NO. 44. : Global Trencher Market Volume & Revenue, By Sales Channel, 2017 – 2022 (K Units) (USD Million) 113
TABLE NO. 45. : Global Trencher Market Volume & Revenue, By Sales Channel, 2023– 2030 (K Units) (USD Million) 113
TABLE NO. 46. : North America Trencher Market Volume, By Country, 2017 – 2022 (K Units) 115
TABLE NO. 47. : North America Trencher Market Volume, By Country, 2023– 2030 (K Units) 115
TABLE NO. 48. : North America Trencher Market Revenue, By Country, 2017 – 2022 (USD Million) 116
TABLE NO. 49. : North America Trencher Market Revenue, By Country, 2023– 2030 (USD Million) 116
TABLE NO. 50. : North America Trencher Market Volume, By Type, 2017 – 2022 (K Units) 117
TABLE NO. 51. : North America Trencher Market Volume, By Type, 2023– 2030 (K Units) 117
TABLE NO. 52. : North America Trencher Market Revenue, By Type, 2017 – 2022 (USD Million) 118
TABLE NO. 53. : North America Trencher Market Revenue, By Type, 2023– 2030 (USD Million) 118
TABLE NO. 54. : North America Trencher Market Volume, By Application, 2017 – 2022 (K Units) 119
TABLE NO. 55. : North America Trencher Market Volume, By Application, 2023– 2030 (K Units) 119
TABLE NO. 56. : North America Trencher Market Revenue, By Application, 2017 – 2022 (USD Million) 120
TABLE NO. 57. : North America Trencher Market Revenue, By Application, 2023– 2030 (USD Million) 120
TABLE NO. 58. : North America Trencher Market Volume, By Operating Type, 2017 – 2022 (K Units) 121
TABLE NO. 59. : North America Trencher Market Volume, By Operating Type, 2023– 2030 (K Units) 121
TABLE NO. 60. : North America Trencher Market Revenue, By Operating Type, 2017 – 2022 (USD Million) 122
TABLE NO. 61. : North America Trencher Market Revenue, By Operating Type, 2023– 2030 (USD Million) 122
TABLE NO. 62. : North America Trencher Market Volume, By Sales Channel, 2017 – 2022 (K Units) 123
TABLE NO. 63. : North America Trencher Market Volume, By Sales Channel, 2023– 2030 (K Units) 123
TABLE NO. 64. : North America Trencher Market Revenue, By Sales Channel, 2017 – 2022 (USD Million) 124
TABLE NO. 65. : North America Trencher Market Revenue, By Sales Channel, 2023– 2030 (USD Million) 124
TABLE NO. 66. : Europe Trencher Market Volume, By Country, 2017 – 2022 (K Units) 127
TABLE NO. 67. : Europe Trencher Market Volume, By Country, 2023– 2030 (K Units) 127
TABLE NO. 68. : Europe Trencher Market Revenue, By Country, 2017 – 2022 (USD Million) 128
TABLE NO. 69. : Europe Trencher Market Revenue, By Country, 2023– 2030 (USD Million) 128
TABLE NO. 70. : Europe Trencher Market Volume, By Type, 2017 – 2022 (K Units) 129
TABLE NO. 71. : Europe Trencher Market Volume, By Type, 2023– 2030 (K Units) 129
TABLE NO. 72. : Europe Trencher Market Revenue, By Type, 2017 – 2022 (USD Million) 130
TABLE NO. 73. : Europe Trencher Market Revenue, By Type, 2023– 2030 (USD Million) 130
TABLE NO. 74. : Europe Trencher Market Volume, By Application, 2017 – 2022 (K Units) 131
TABLE NO. 75. : Europe Trencher Market Volume, By Application, 2023– 2030 (K Units) 131
TABLE NO. 76. : Europe Trencher Market Revenue, By Application, 2017 – 2022 (USD Million) 132
TABLE NO. 77. : Europe Trencher Market Revenue, By Application, 2023– 2030 (USD Million) 132
TABLE NO. 78. : Europe Trencher Market Volume, By Operating Type, 2017 – 2022 (K Units) 133
TABLE NO. 79. : Europe Trencher Market Volume, By Operating Type, 2023– 2030 (K Units) 133
TABLE NO. 80. : Europe Trencher Market Revenue, By Operating Type, 2017 – 2022 (USD Million) 134
TABLE NO. 81. : Europe Trencher Market Revenue, By Operating Type, 2023– 2030 (USD Million) 134
TABLE NO. 82. : Europe Trencher Market Volume, By Sales Channel, 2017 – 2022 (K Units) 135
TABLE NO. 83. : Europe Trencher Market Volume, By Sales Channel, 2023– 2030 (K Units) 135
TABLE NO. 84. : Europe Trencher Market Revenue, By Sales Channel, 2017 – 2022 (USD Million) 136
TABLE NO. 85. : Europe Trencher Market Revenue, By Sales Channel, 2023– 2030 (USD Million) 136
TABLE NO. 86. : Asia Pacific Trencher Market Volume, By Country, 2017 – 2022 (K Units) 139
TABLE NO. 87. : Asia Pacific Trencher Market Volume, By Country, 2023– 2030 (K Units) 139
TABLE NO. 88. : Asia Pacific Trencher Market Revenue, By Country, 2017 – 2022 (USD Million) 140
TABLE NO. 89. : Asia Pacific Trencher Market Revenue, By Country, 2023– 2030 (USD Million) 140
TABLE NO. 90. : Asia Pacific Trencher Market Volume, By Type, 2017 – 2022 (K Units) 141
TABLE NO. 91. : Asia Pacific Trencher Market Volume, By Type, 2023– 2030 (K Units) 141
TABLE NO. 92. : Asia Pacific Trencher Market Revenue, By Type, 2017 – 2022 (USD Million) 142
TABLE NO. 93. : Asia Pacific Trencher Market Revenue, By Type, 2023– 2030 (USD Million) 142
TABLE NO. 94. : Asia Pacific Trencher Market Volume, By Application, 2017 – 2022 (K Units) 143
TABLE NO. 95. : Asia Pacific Trencher Market Volume, By Application, 2023– 2030 (K Units) 143
TABLE NO. 96. : Asia Pacific Trencher Market Revenue, By Application, 2017 – 2022 (USD Million) 144
TABLE NO. 97. : Asia Pacific Trencher Market Revenue, By Application, 2023– 2030 (USD Million) 144
TABLE NO. 98. : Asia Pacific Trencher Market Volume, By Operating Type, 2017 – 2022 (K Units) 145
TABLE NO. 99. : Asia Pacific Trencher Market Volume, By Operating Type, 2023– 2030 (K Units) 145
TABLE NO. 100. : Asia Pacific Trencher Market Revenue, By Operating Type, 2017 – 2022 (USD Million) 146
TABLE NO. 101. : Asia Pacific Trencher Market Revenue, By Operating Type, 2023– 2030 (USD Million) 146
TABLE NO. 102. : Asia Pacific Trencher Market Volume, By Sales Channel, 2017 – 2022 (K Units) 147
TABLE NO. 103. : Asia Pacific Trencher Market Volume, By Sales Channel, 2023– 2030 (K Units) 147
TABLE NO. 104. : Asia Pacific Trencher Market Revenue, By Sales Channel, 2017 – 2022 (USD Million) 148
TABLE NO. 105. : Asia Pacific Trencher Market Revenue, By Sales Channel, 2023– 2030 (USD Million) 148
TABLE NO. 106. : Latin America Trencher Market Volume, By Country, 2017 – 2022 (K Units) 151
TABLE NO. 107. : Latin America Trencher Market Volume, By Country, 2023– 2030 (K Units) 151
TABLE NO. 108. : Latin America Trencher Market Revenue, By Country, 2017 – 2022 (USD Million) 152
TABLE NO. 109. : Latin America Trencher Market Revenue, By Country, 2023– 2030 (USD Million) 152
TABLE NO. 110. : Latin America Trencher Market Volume, By Type, 2017 – 2022 (K Units) 153
TABLE NO. 111. : Latin America Trencher Market Volume, By Type, 2023– 2030 (K Units) 153
TABLE NO. 112. : Latin America Trencher Market Revenue, By Type, 2017 – 2022 (USD Million) 154
TABLE NO. 113. : Latin America Trencher Market Revenue, By Type, 2023– 2030 (USD Million) 154
TABLE NO. 114. : Latin America Trencher Market Volume, By Application, 2017 – 2022 (K Units) 155
TABLE NO. 115. : Latin America Trencher Market Volume, By Application, 2023– 2030 (K Units) 155
TABLE NO. 116. : Latin America Trencher Market Revenue, By Application, 2017 – 2022 (USD Million) 156
TABLE NO. 117. : Latin America Trencher Market Revenue, By Application, 2023– 2030 (USD Million) 156
TABLE NO. 118. : Latin America Trencher Market Volume, By Operating Type, 2017 – 2022 (K Units) 157
TABLE NO. 119. : Latin America Trencher Market Volume, By Operating Type, 2023– 2030 (K Units) 157
TABLE NO. 120. : Latin America Trencher Market Revenue, By Operating Type, 2017 – 2022 (USD Million) 158
TABLE NO. 121. : Latin America Trencher Market Revenue, By Operating Type, 2023– 2030 (USD Million) 158
TABLE NO. 122. : Latin America Trencher Market Volume, By Sales Channel, 2017 – 2022 (K Units) 159
TABLE NO. 123. : Latin America Trencher Market Volume, By Sales Channel, 2023– 2030 (K Units) 159
TABLE NO. 124. : Latin America Trencher Market Revenue, By Sales Channel, 2017 – 2022 (USD Million) 160
TABLE NO. 125. : Latin America Trencher Market Revenue, By Sales Channel, 2023– 2030 (USD Million) 160
TABLE NO. 126. : Middle East Trencher Market Volume, By Country, 2017 – 2022 (K Units) 163
TABLE NO. 127. : Middle East Trencher Market Volume, By Country, 2023– 2030 (K Units) 163
TABLE NO. 128. : Middle East Trencher Market Revenue, By Country, 2017 – 2022 (USD Million) 164
TABLE NO. 129. : Middle East Trencher Market Revenue, By Country, 2023– 2030 (USD Million) 164
TABLE NO. 130. : Middle East Trencher Market Volume, By Type, 2017 – 2022 (K Units) 165
TABLE NO. 131. : Middle East Trencher Market Volume, By Type, 2023– 2030 (K Units) 165
TABLE NO. 132. : Middle East Trencher Market Revenue, By Type, 2017 – 2022 (USD Million) 166
TABLE NO. 133. : Middle East Trencher Market Revenue, By Type, 2023– 2030 (USD Million) 166
TABLE NO. 134. : Middle East Trencher Market Volume, By Application, 2017 – 2022 (K Units) 167
TABLE NO. 135. : Middle East Trencher Market Volume, By Application, 2023– 2030 (K Units) 167
TABLE NO. 136. : Middle East Trencher Market Revenue, By Application, 2017 – 2022 (USD Million) 168
TABLE NO. 137. : Middle East Trencher Market Revenue, By Application, 2023– 2030 (USD Million) 168
TABLE NO. 138. : Middle East Trencher Market Volume, By Operating Type, 2017 – 2022 (K Units) 169
TABLE NO. 139. : Middle East Trencher Market Volume, By Operating Type, 2023– 2030 (K Units) 169
TABLE NO. 140. : Middle East Trencher Market Revenue, By Operating Type, 2017 – 2022 (USD Million) 170
TABLE NO. 141. : Middle East Trencher Market Revenue, By Operating Type, 2023– 2030 (USD Million) 170
TABLE NO. 142. : Middle East Trencher Market Volume, By Sales Channel, 2017 – 2022 (K Units) 171
TABLE NO. 143. : Middle East Trencher Market Volume, By Sales Channel, 2023– 2030 (K Units) 171
TABLE NO. 144. : Middle East Trencher Market Revenue, By Sales Channel, 2017 – 2022 (USD Million) 172
TABLE NO. 145. : Middle East Trencher Market Revenue, By Sales Channel, 2023– 2030 (USD Million) 172
TABLE NO. 146. : Africa Trencher Market Volume, By Country, 2017 – 2022 (K Units) 175
TABLE NO. 147. : Africa Trencher Market Volume, By Country, 2023– 2030 (K Units) 175
TABLE NO. 148. : Africa Trencher Market Revenue, By Country, 2017 – 2022 (USD Million) 176
TABLE NO. 149. : Africa Trencher Market Revenue, By Country, 2023– 2030 (USD Million) 176
TABLE NO. 150. : Africa Trencher Market Volume, By Type, 2017 – 2022 (K Units) 177
TABLE NO. 151. : Africa Trencher Market Volume, By Type, 2023– 2030 (K Units) 177
TABLE NO. 152. : Africa Trencher Market Revenue, By Type, 2017 – 2022 (USD Million) 178
TABLE NO. 153. : Africa Trencher Market Revenue, By Type, 2023– 2030 (USD Million) 178
TABLE NO. 154. : Africa Trencher Market Volume, By Application, 2017 – 2022 (K Units) 179
TABLE NO. 155. : Africa Trencher Market Volume, By Application, 2023– 2030 (K Units) 179
TABLE NO. 156. : Africa Trencher Market Revenue, By Application, 2017 – 2022 (USD Million) 180
TABLE NO. 157. : Africa Trencher Market Revenue, By Application, 2023– 2030 (USD Million) 180
TABLE NO. 158. : Africa Trencher Market Volume, By Operating Type, 2017 – 2022 (K Units) 181
TABLE NO. 159. : Africa Trencher Market Volume, By Operating Type, 2023– 2030 (K Units) 181
TABLE NO. 160. : Africa Trencher Market Revenue, By Operating Type, 2017 – 2022 (USD Million) 182
TABLE NO. 161. : Africa Trencher Market Revenue, By Operating Type, 2023– 2030 (USD Million) 182
TABLE NO. 162. : Africa Trencher Market Volume, By Sales Channel, 2017 – 2022 (K Units) 183
TABLE NO. 163. : Africa Trencher Market Volume, By Sales Channel, 2023– 2030 (K Units) 183
TABLE NO. 164. : Africa Trencher Market Revenue, By Sales Channel, 2017 – 2022 (USD Million) 184
TABLE NO. 165. : Africa Trencher Market Revenue, By Sales Channel, 2023– 2030 (USD Million) 184