Market Overview
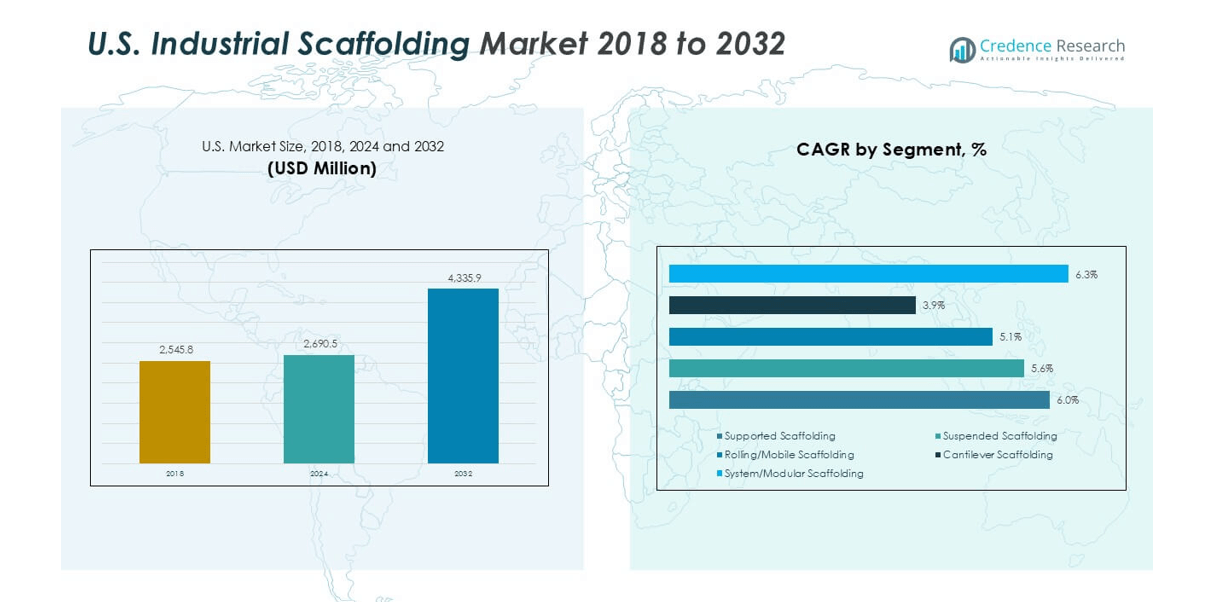
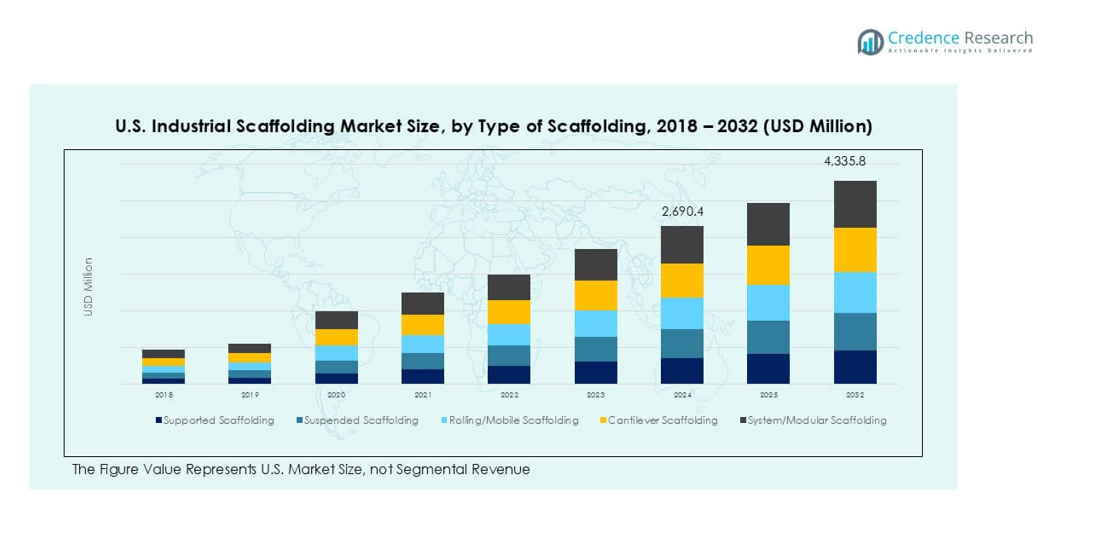
U.S. Industrial Scaffolding market size was valued at USD 2,545.84 million in 2018, reached USD 2,690.48 million in 2024, and is anticipated to reach USD 4,335.87 million by 2032, at a CAGR of 6.15% during the forecast period.
| REPORT ATTRIBUTE | DETAILS |
|---|---|
| Historical Period | 2020-2023 |
| Base Year | 2024 |
| Forecast Period | 2025-2032 |
| U.S. Industrial Scaffolding Market Size 2024 | USD 2,690.48 million |
| U.S. Industrial Scaffolding Market , CAGR | 6.15% |
| U.S. Industrial Scaffolding Market Size 2032 | USD 4,335.87 million |
The U.S. industrial scaffolding market is led by key players such as BrandSafway, SafwayAtlantic, Universal Manufacturing Corp, Granite Industries, Bil-Jax (Haulotte Group), Bee Access Products, Doka USA Ltd., Matakana Scaffolding, and Northern Scaffold Access Inc. These companies dominate through extensive service networks, turnkey solutions, and strong compliance with OSHA safety standards. The South region holds the largest share at 35.0%, driven by refinery expansions, LNG terminals, and petrochemical projects, followed by the West at 27.0%, supported by energy infrastructure upgrades and mining activities. Competitive strategies focus on modular scaffolding innovations, skilled labor deployment, and partnerships to expand capacity and meet growing demand for safe, efficient access solutions in industrial maintenance and construction projects.
Market Insights
- The U.S. industrial scaffolding market was valued at USD 2,690.48 million in 2024 and is projected to reach USD 4,335.87 million by 2032, growing at a 6.15% CAGR.
- Infrastructure upgrades, refinery turnarounds, and strict OSHA safety standards drive steady demand for supported and modular scaffolding systems across industries.
- Trends include rising adoption of modular and mobile scaffolding for faster assembly, use of lightweight materials, and integration of digital planning and safety monitoring tools.
- The market is moderately consolidated, with players such as BrandSafway, SafwayAtlantic, and Granite Industries focusing on turnkey solutions, trained labor, and compliance-driven services.
- Regionally, the South leads with 35.0% share, followed by the West at 27.0%, while supported scaffolding dominates with 45% share, driven by its stability and suitability for large-scale industrial projects.
Market Segmentation Analysis:
By Type of Scaffolding
Supported scaffolding dominates the U.S. industrial scaffolding market, accounting for over 45% share due to its versatility and ease of assembly in large-scale projects. It is widely preferred for construction, maintenance, and industrial shutdown activities because of its high load-bearing capacity and safety. The demand is driven by expansion projects in refineries, power plants, and manufacturing facilities. Rolling or mobile scaffolding is gaining traction in maintenance projects requiring frequent movement, while system/modular scaffolding is increasingly used for complex industrial sites where quick assembly and dismantling reduce downtime.
- For instance, Layher’s Lightweight system increases truck payload by 12% while reducing erection time of birdcage structures by up to 10% vs standard Allround system.
By Application
The oil and gas industry hold the largest share, exceeding 40%, as regular maintenance, turnarounds, and expansions in refineries and petrochemical facilities create consistent scaffolding demand. Scaffolding is critical for accessing elevated structures and ensuring worker safety in hazardous environments. Power generation facilities, including thermal and nuclear plants, represent the second-largest application segment, supported by ongoing upgrades and compliance with safety standards. Mining, metallurgy, and chemical industries also contribute steadily, with demand linked to periodic inspection, shutdown, and repair cycles in large industrial plants.
- For example, the LOBO System used in Valero refinery operations saved over US$8 million in seven years by cutting scaffold hire costs and enabling faster assembly.
By Material
Steel scaffolding leads the market with over 60% share, driven by its superior strength, durability, and ability to withstand heavy loads in industrial settings. Steel’s reusability and compatibility with modular designs make it the preferred material for long-term projects in oil, gas, and power plants. Aluminum scaffolding is gaining adoption in projects requiring lightweight, corrosion-resistant structures, particularly in chemical facilities. Fiberglass/composite scaffolding serves niche applications where electrical insulation and chemical resistance are crucial, such as in power and petrochemical environments, though its higher cost limits widespread use.
Market Overview
Infrastructure Modernization and Industrial Expansion
Infrastructure upgrades and expansions across refineries, power plants, and manufacturing facilities drive scaffolding demand. Federal investments in energy infrastructure and industrial plant maintenance projects boost construction and maintenance activities. Large-scale turnarounds and shutdowns in oil and gas facilities require extensive scaffolding for safe access and inspection. The growing number of industrial capital projects, including LNG terminals and chemical plants, continues to generate recurring scaffolding requirements. These factors collectively ensure strong demand from both new construction and ongoing maintenance, supporting long-term growth for scaffolding service providers.
- For instance, Global Site Solutions (GSS) supported the Corpus Christi LNG project with over 18,000 scaffold requests, logging more than 2,250,000 man-hours and supplying upwards of 6,500 tonnes of scaffold material.
Focus on Worker Safety and Regulatory Compliance
Stringent OSHA safety standards and regulatory compliance requirements encourage industries to adopt reliable scaffolding systems. Companies invest in high-quality supported and modular scaffolding solutions to minimize accidents and improve site safety. The rising emphasis on workplace safety training and use of advanced scaffolding systems with guardrails, toe boards, and fall-protection features supports market growth. Compliance with evolving regulations also drives demand for certified scaffolding services and regular inspections, creating steady opportunities for suppliers to offer safer, innovative systems for hazardous industrial environments.
- For instance, OSHA regulation 29 CFR 1926.451(a)(1) mandates that every scaffold and scaffold component be capable of supporting, without failure, its own weight plus four times the maximum intended load applied or transmitted to
Rising Demand from Energy and Utility Sector
The energy sector remains a major driver, with consistent demand from power generation, oil, and gas industries. Aging infrastructure and the shift toward cleaner energy projects create significant scaffolding needs for retrofits, maintenance, and construction. Nuclear facility upgrades and renewable energy installations also require extensive scaffolding for complex structural work. Growth in shale gas and refinery capacity expansions further strengthen the need for reliable scaffolding solutions. This sustained demand from critical energy facilities supports recurring revenue streams for scaffolding manufacturers and service contractors.
Key Trends and Opportunities
Adoption of Modular and Mobile Scaffolding Systems
Industries are rapidly shifting toward modular scaffolding systems for faster assembly, reduced labor costs, and improved site efficiency. Mobile scaffolding solutions are increasingly used for maintenance projects that require frequent repositioning. These systems minimize downtime during plant operations and support lean project execution. Manufacturers focus on developing lightweight, easy-to-transport scaffolding with enhanced safety features. This trend creates opportunities for suppliers offering customized, flexible systems suited for industrial turnarounds, shutdowns, and high-frequency maintenance activities, particularly in oil, gas, and power generation facilities.
- For instance, in a test at a university construction site, wireless strain sensors were used on a modular scaffold frame; data from those sensors fed into a finite element method (FEM) model to adapt to changing loads in real time.
Integration of Digital and Smart Safety Solutions
The market is witnessing the adoption of digital tools for scaffolding management, including 3D modeling and design software for planning layouts. IoT-enabled sensors are being used for real-time load monitoring and safety compliance checks. Digital tracking systems help reduce assembly errors and improve efficiency during large-scale projects. This digital transformation creates opportunities for companies offering integrated solutions combining scaffolding hardware with software platforms. Contractors leveraging data analytics and remote monitoring can deliver safer, faster, and cost-effective services, gaining a competitive edge.
- For instance, in a study combining point cloud data from a 3D laser scanner with IoT sensors on scaffold components, real-time modulus of deformation was tracked during a simulated wind load, improving detection of deformation from millimetres up to several centimetres.
Key Challenges
High Labor and Installation Costs
Labor-intensive assembly and dismantling processes significantly impact overall project costs. Shortage of skilled scaffolders in the U.S. further raises wage rates and project expenses. This cost pressure can delay projects or lead to reduced scaffolding budgets in some industrial sites. Companies are exploring automation, modular systems, and prefabricated designs to optimize labor use, but adoption remains gradual due to upfront investment costs. Managing costs while maintaining safety and compliance remains a critical challenge for contractors and service providers in this market.
Stringent Regulatory and Safety Compliance
Strict safety regulations impose additional costs for inspections, certifications, and employee training. Non-compliance can result in penalties, project delays, and reputational risks. Constantly evolving OSHA standards require companies to regularly update equipment and processes. Small and mid-sized service providers face challenges meeting these requirements while staying cost-competitive. Ensuring continuous compliance while managing project timelines and budgets adds complexity for contractors. This challenge encourages partnerships with certified scaffolding providers and investment in standardized, regulation-compliant systems.
Regional Analysis
Northeast
The Northeast accounts for 17.0% of the U.S. industrial scaffolding market in 2024, highlighting its importance in urban and industrial maintenance projects. Strong demand comes from chemical plants, pharmaceutical facilities, and port infrastructure upgrades that require safe, reliable access solutions. Supported scaffolding dominates usage due to its stability in dense construction zones. The region’s aging bridges, water systems, and manufacturing sites continue to require frequent overhauls and retrofits. High safety standards and strict regulatory compliance drive the use of certified scaffolding systems, supporting steady growth in this mature but maintenance-intensive market.
Midwest
The Midwest holds 21.0% market share, supported by its concentration of heavy industries and power generation facilities. The region’s demand is driven by refinery turnarounds, grid modernization, and upgrades to steel mills and automotive plants. Supported and modular scaffolding systems are widely adopted for complex industrial projects requiring high load capacity. Industrial maintenance cycles create recurring business opportunities, ensuring a stable demand base. Continued investment in manufacturing infrastructure and renewable energy projects further boosts market growth, making the Midwest a key region for scaffolding service providers and equipment suppliers.
South
The South leads with 35.0% market share, making it the largest regional contributor to the U.S. industrial scaffolding market. Growth is propelled by extensive oil and gas operations, LNG terminals, and petrochemical projects along the Gulf Coast. Regular maintenance shutdowns and large-scale capital expansion projects fuel consistent demand for scaffolding services. Power generation projects, including thermal and renewable energy plants, add to the region’s requirements. High construction activity and industrial investments position the South as the most dynamic market, attracting key players offering turnkey scaffolding solutions and specialized manpower.
West
The West represents 27.0% of the U.S. industrial scaffolding market, with strong activity in energy infrastructure, mining, and water treatment projects. The region’s demand is driven by refinery upgrades, renewable energy installations, and large-scale construction in urban centers. Modular scaffolding systems are increasingly used due to complex site layouts and strict safety regulations. The presence of major ports and manufacturing hubs also supports recurring demand for scaffolding during maintenance cycles. Growth is reinforced by state-level sustainability initiatives and investments in green energy infrastructure, which create opportunities for innovative scaffolding solutions.
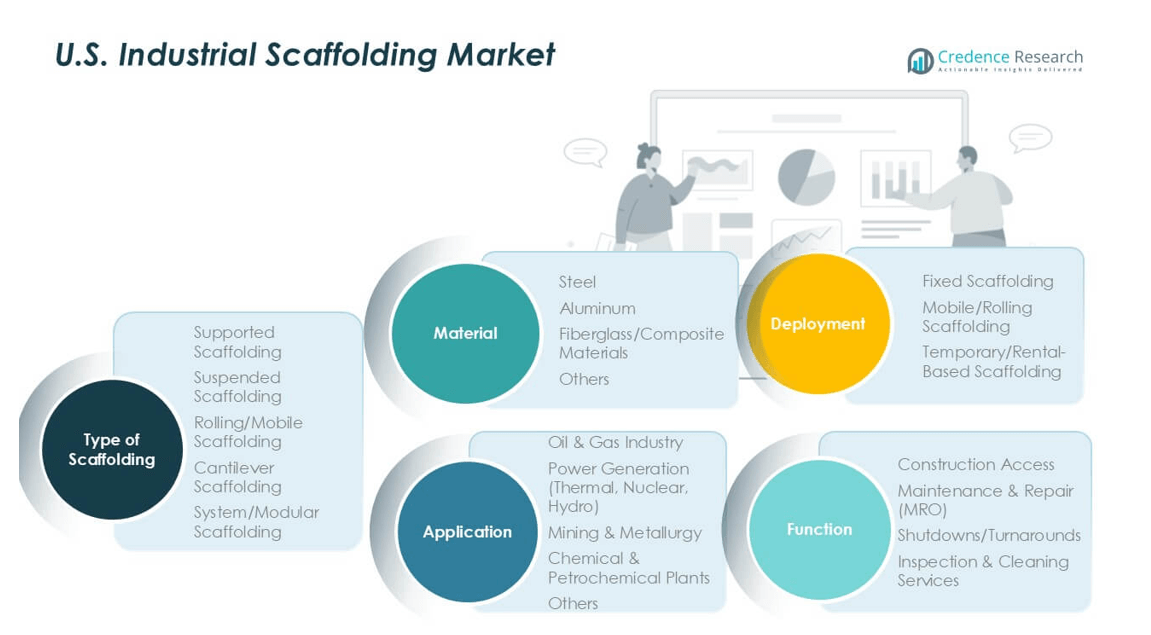
Market Segmentations:
By Type of Scaffolding
- Supported Scaffolding
- Suspended Scaffolding
- Rolling/Mobile Scaffolding
- Cantilever Scaffolding
- System/Modular Scaffolding
By Application
- Oil & Gas Industry
- Power Generation (Thermal, Nuclear, Hydro)
- Mining & Metallurgy
- Chemical & Petrochemical Plants
- Others
By Material
- Steel
- Aluminum
- Fiberglass/Composite Materials
- Others
By Deployment
- Fixed Scaffolding
- Mobile/Rolling Scaffolding
- Temporary/Rental-Based Scaffolding
By Function
- Construction Access
- Maintenance & Repair (MRO)
- Shutdowns/Turnarounds
- Inspection & Cleaning Services
By Geography
- Northeast
- Midwest
- South
- West
Competitive Landscape
The U.S. industrial scaffolding market is moderately consolidated, with leading players such as BrandSafway, SafwayAtlantic, Universal Manufacturing Corp, and Granite Industries holding a significant share. These companies focus on delivering turnkey scaffolding solutions, including supported, modular, and mobile systems, to serve industries such as oil and gas, power generation, and manufacturing. Strategic partnerships, mergers, and acquisitions strengthen their service capabilities and geographic reach. Players invest in safety-certified equipment, skilled labor training, and digital planning tools to meet stringent OSHA regulations and improve project efficiency. Mid-sized and regional players like Northern Scaffold Access Inc. and Bee Access Products cater to specialized projects, offering customized systems and competitive pricing. Innovation in lightweight materials and modular designs helps companies differentiate and reduce installation time. Overall, competition is driven by safety compliance, cost efficiency, rapid project execution, and the ability to handle large-scale shutdowns and maintenance turnarounds across multiple industries.
Key Player Analysis
- BrandSafway
- SafwayAtlantic
- Universal Manufacturing Corp
- Granite Industries
- Bil-Jax (a Haulotte Group brand)
- Bee Access Products, Inc.
- Doka USA Ltd.
- Matakana Scaffolding
- Northern Scaffold Access Inc.
Recent Developments
- In July 2022, A major developer and provider of formwork and scaffolding systems, PERI Formwork Systems, Inc., has developed what would become a new industry standard for bridge construction. VPS ensures a safety and efficiency gap through a highly versatile system that is adjustable, rentable, and productive in forming bridge columns and caps.
- In July 2022, Doka, a key player in formwork solutions and services to the construction industry has taken its collaboration with the well-known American scaffolding company AT-PAC to the next level by making a significant investment in the US-based firm. The two companies first teamed up in 2020 to offer comprehensive solutions for building sites, and their partnership has only grown stronger since then.
- In July 2022, A Glasgow subsidiary named StepUp Scaffold UK from StepUp Scaffold Group in Memphis has completed the purchase of MP House ApS located near Copenhagen during July 2022. The company MP House stands as the dominant supplier of tools and equipment along with accessories to scaffolding operators based in Denmark.
- In April 2022, Layher Holding GmbH Co KG has introduced the Allround Scaffold, a name that reflects the company and perhaps represents the pinnacle of modular scaffolding solutions. The Modular Scaffolding System is essentially the Layher Allround Scaffolding. This system is comparable to Allround Performance, as it serves multiple purposes within a single framework. No matter how complex the designs, architectural styles, or strict safety standards may be, Allround Scaffolding consistently proves to be the quicker, safer, and more economical choice
Report Coverage
The research report offers an in-depth analysis based on Type of Scaffolding, Application, Material, Deployment, and Geography. It details leading market players, providing an overview of their business, product offerings, investments, revenue streams, and key applications. Additionally, the report includes insights into the competitive environment, SWOT analysis, current market trends, as well as the primary drivers and constraints. Furthermore, it discusses various factors that have driven market expansion in recent years. The report also explores market dynamics, regulatory scenarios, and technological advancements that are shaping the industry. It assesses the impact of external factors and global economic changes on market growth. Lastly, it provides strategic recommendations for new entrants and established companies to navigate the complexities of the market.
Future Outlook
- The market will grow steadily with increasing demand from oil, gas, and power industries.
- Infrastructure modernization projects will boost scaffolding requirements across industrial and construction sectors.
- Adoption of modular scaffolding will rise for faster assembly and reduced project downtime.
- Digital tools and 3D modeling will improve planning, safety, and project efficiency.
- Skilled labor training will remain a focus to meet OSHA safety compliance requirements.
- Investment in lightweight and corrosion-resistant materials will expand for harsh industrial environments.
- Maintenance shutdowns and turnarounds will create recurring demand for scaffolding services.
- Regional demand will remain highest in the South, driven by refinery and petrochemical projects.
- Competition will intensify as players offer turnkey solutions and integrated digital services.
- Sustainability initiatives will drive use of reusable systems and eco-friendly materials.

Request a Free Sample
Fill in your details and we'll send you a free sample report.
- Sample data tables & charts
- Research methodology
Market Dynamics
Infrastructure Modernization and Industrial Expansion
Ongoing upgrades and expansions in refineries, power plants, and manufacturing facilities are driving demand for industrial scaffolding, as these projects require extensive access solutions for construction and maintenance.
Stringent OSHA Safety and Regulatory Compliance
Strict enforcement of OSHA standards compels industries to invest in high-quality, certified scaffolding systems, boosting demand for advanced, compliant solutions and regular inspection services.
Recurring Maintenance Shutdowns and Turnarounds
Frequent maintenance cycles and shutdowns in oil, gas, and power generation facilities create steady, recurring demand for scaffolding services to ensure safe access and efficient project execution.
Adoption of Modular and Digital Scaffolding Solutions
The shift toward modular scaffolding and integration of digital planning and safety monitoring tools enables faster assembly, reduced labor costs, and improved site efficiency, encouraging broader adoption across industrial sectors.
Growth in Energy and Utility Sector Projects
Expansion of LNG terminals, refinery upgrades, and renewable energy installations in the U.S. South and West regions are fueling sustained demand for industrial scaffolding to support complex, large-scale infrastructure projects.
Need a Custom Version of This Report?
Tailor the scope, geography, or segments to your exact requirements.
- Custom geography or segment scope
- Direct access to our analyst team
Frequently Asked Questions
What is the current market size for the U.S. Industrial Scaffolding market, and what is its projected size in 2032?
At what Compound Annual Growth Rate is the U.S. Industrial Scaffolding market projected to grow between 2025 and 2032?
Which U.S. Industrial Scaffolding market segment held the largest share in 2024?
What are the primary factors fueling the growth of the U.S. Industrial Scaffolding market?
Who are the leading companies in the U.S. Industrial Scaffolding market?
Which region commanded the largest share of the U.S. Industrial Scaffolding market in 2024?
Table of Content
Chapter 1 Market Segmentation
- 1.1 Segmentation Framework
- 1.1.1 Product and Service Classification
- 1.1.2 Application and End-Use Classification
- 1.1.3 Technology and Solution Classification
- 1.1.4 Customer and Distribution Channel Classification
- 1.1.5 Geographic Segmentation
- 1.1.6 Market Segment Definitions and Boundaries
- 1.2 By Material
- 1.2.1 Steel
- 1.2.2 Aluminum
- 1.2.3 Fiberglass/Composite Materials
- 1.2.4 Others
- 1.3 By Application
- 1.3.1 Oil & Gas Industry
- 1.3.2 Power Generation (Thermal, Nuclear, Hydro)
- 1.3.3 Mining & Metallurgy
- 1.3.4 Chemical & Petrochemical Plants
- 1.3.5 Others
- 1.4 By Type of Scaffolding
- 1.4.1 Supported Scaffolding
- 1.4.2 Suspended Scaffolding
- 1.4.3 Rolling/Mobile Scaffolding
- 1.4.4 Cantilever Scaffolding
- 1.4.5 System/Modular Scaffolding
Chapter 2 Introduction
- 2.1 Report Objectives and Scope
- 2.2 Product Definition and Industry Terminology
- 2.3 Market Inclusions and Exclusions
- 2.4 Research Process
- 2.4.1 Primary Research and Expert Interviews
- 2.4.2 Secondary Research and Source Review
- 2.4.3 Top-Down and Bottom-Up Estimation
- 2.4.4 Data Triangulation and Verification
- 2.5 Market Size Measurement Basis
- 2.5.1 2018: USD 2,690.48 million → 2032: USD 4,335.87 million
- 2.6 Historical and Forecast Reference Periods
- 2.6.1 Base Year: 2018
- 2.6.2 Forecast Period: 2018-2032
- 2.7 Research Assumptions and Limitations
Chapter 3 Executive Summary
- 3.1 Market Snapshot and Key Findings
- 3.2 Base-Year Market Size, 2018
- 3.3 Forecast Market Size, 2032
- 3.4 Revenue and Volume Growth Outlook
- 3.5 Key Demand and Supply Indicators
- 3.6 Leading Market Segments
- 3.7 Fastest-Growing Market Opportunities
- 3.8 Regional Performance Highlights
- 3.9 Technology and Industry Transformation
- 3.10 Competitive Landscape Summary
- 3.11 Analyst View and Strategic Implications
Chapter 4 U.S. Industrial Scaffolding Market Trends and Developments
- 4.1 Historical Industry Development
- 4.2 Recent Market Trends and Developments
- 4.3 Demand and Customer Behavior Trends
- 4.4 Technology and Product Innovation
- 4.5 Artificial Intelligence, Automation and Digitalization
- 4.6 Local Manufacturing and Supply Chain Realignment
- 4.7 Industry Partnerships, Mergers and Acquisitions
- 4.8 Sustainability and Circular Economy Developments
- 4.9 Government and Private Sector Investment Trends
- 4.10 Emerging Business Models and Commercialization
- 4.11 Industry Developments and Announcements
Chapter 5 U.S. Industrial Scaffolding Market Production, Supply and Demand Analysis
- 5.1 Demand Trend and Consumption Analysis
- 5.2 Demand Forecast, 2018-2032
- 5.3 Production and Output Trend
- 5.4 Production and Output Forecast, 2018-2032
- 5.5 Installed Capacity and Capacity Utilization
- 5.6 Company-Wise Production Plants and Statistics
- 5.6.1 Installed Production Capacity
- 5.6.2 Actual Production
- 5.6.3 Planned Capacity and Expansion Targets
- 5.7 Supply Chain Structure and Procurement Trends
- 5.8 Supply-Demand Gap and Bottlenecks
- 5.9 Import Dependence and Sourcing Structure
- 5.10 Contract Manufacturing and Outsourcing
- 5.11 Regional Supply and Demand Concentration
Chapter 6 U.S. Industrial Scaffolding Market Pricing Analysis
- 6.1 Pricing Structure and Measurement
- 6.2 Historical Pricing Trends
- 6.3 Pricing Outlook, 2018-2032
- 6.4 Average Selling Price and Unit Economics
- 6.5 Pricing by Product and Market Segment
- 6.6 Geographic Pricing Differences
- 6.7 Key Input, Energy, Labor and Logistics Costs
- 6.8 Contract Pricing and Purchasing Models
- 6.9 Pricing Sensitivity and Competitive Positioning
- 6.10 Price, Margin and Profitability Implications
Chapter 7 U.S. Industrial Scaffolding Market Dynamics
- 7.1 Market Growth Drivers
- 7.1.1 Demand-Side Drivers
- 7.1.2 Technology and Innovation Drivers
- 7.1.3 Infrastructure and Investment Drivers
- 7.1.4 Regulatory and Policy Drivers
- 7.2 Market Restraints
- 7.2.1 Cost and Affordability Constraints
- 7.2.2 Technology and Adoption Barriers
- 7.2.3 Supply Chain and Operational Constraints
- 7.3 Market Challenges
- 7.3.1 Competitive Pressure and Margin Erosion
- 7.3.2 Skills, Infrastructure and Implementation Gaps
- 7.4 Emerging Market Opportunities
- 7.5 Market Dynamics Impact and Time-Horizon Assessment
Chapter 8 U.S. Industrial Scaffolding Value Chain Analysis
- 8.1 Industry Value Chain Overview
- 8.2 Upstream Suppliers and Critical Inputs
- 8.3 Technology and Component Providers
- 8.4 Manufacturing or Service Delivery
- 8.5 Distribution, Channel Partners and Integrators
- 8.6 Downstream Applications and End Users
- 8.7 Value Addition and Profit Pools
- 8.8 Vertical Integration and Outsourcing
- 8.9 Supplier Concentration and Risk
- 8.10 Supply Chain Localization and Resilience
Chapter 9 U.S. Industrial Scaffolding Market Regulations and Policies
- 9.1 Relevant Laws, Standards and Compliance Frameworks
- 9.2 Product, Service, Safety and Quality Requirements
- 9.3 Government Policies, Incentives and Subsidies
- 9.4 Imports, Exports and Trade Barriers
- 9.5 Public Procurement and Local Content Requirements
- 9.6 Environmental and Sustainability Compliance
- 9.7 Upcoming Policy Changes and Market Implications
Chapter 10 U.S. Industrial Scaffolding Market Hotspots and Opportunities
- 10.1 Market Opportunity Mapping and Growth Hotspots
- 10.2 High-Growth Applications and Customer Groups
- 10.3 Underserved Markets and White-Space Opportunities
- 10.4 Emerging Technology and Product Opportunities
- 10.5 New Capacity and Investment Hotspots
- 10.6 Market Entry and Expansion Opportunities
- 10.7 Distribution and Partnership Opportunities
- 10.8 Near-Term and Long-Term Commercial Potential
- 10.9 Opportunity Attractiveness and Execution Risks
Chapter 11 U.S. Industrial Scaffolding Market Outlook, 2018-2032
- 11.1 Market Size and Analysis
- 11.1.1 Revenue (Market Measurement: 2018: USD 2,690.48 million → 2032: USD 4,335.87 million)
- 11.1.2 Market Volume and Quantity Sold
- 11.1.3 Historical Market Size
- 11.1.4 Base-Year Market Size, 2018
- 11.2 Market Forecast, 2018-2032
- 11.2.1 Revenue Forecast to 2032
- 11.2.2 Volume Forecast to 2032
- 11.2.3 CAGR and Year-on-Year Growth
- 11.2.4 Incremental Revenue Opportunity
- 11.3 Forecast Assumptions and Scenario Analysis
- 11.3.1 Base-Case Forecast
- 11.3.2 Optimistic and Conservative Scenarios
- 11.3.3 Technology, Pricing and Policy Sensitivities
- 11.4 Market Attractiveness and Growth Outlook
Chapter 12 U.S. Industrial Scaffolding Market Segmentation and Outlook
- 12.1 Segmentation Summary and Market Shares, 2018
- 12.2 Largest and Fastest-Growing Segments
- 12.3 By Material - Market Size and Forecast, 2018-2032
- 12.3.1 Segment Definition and Scope
- 12.3.2 Historical Market Size
- 12.3.3 Revenue Forecast, 2018-2032
- 12.3.4 Volume Forecast, 2018-2032
- 12.3.5 Base-Year Market Share, 2018
- 12.3.6 Segment CAGR and Growth Drivers
- 12.3.7 Subsegment Market Size and Forecast
- 12.3.7.1 Steel
- 12.3.7.2 Aluminum
- 12.3.7.3 Fiberglass/Composite Materials
- 12.3.7.4 Others
- 12.3.8 Subsegment Pricing and Adoption Trends
- 12.3.9 Leading Suppliers and Competition
- 12.3.10 Regional Demand and Opportunities
- 12.4 By Application - Market Size and Forecast, 2018-2032
- 12.4.1 Segment Definition and Scope
- 12.4.2 Historical Market Size
- 12.4.3 Revenue Forecast, 2018-2032
- 12.4.4 Volume Forecast, 2018-2032
- 12.4.5 Base-Year Market Share, 2018
- 12.4.6 Segment CAGR and Growth Drivers
- 12.4.7 Subsegment Market Size and Forecast
- 12.4.7.1 Oil & Gas Industry
- 12.4.7.2 Power Generation (Thermal, Nuclear, Hydro)
- 12.4.7.3 Mining & Metallurgy
- 12.4.7.4 Chemical & Petrochemical Plants
- 12.4.7.5 Others
- 12.4.8 Subsegment Pricing and Adoption Trends
- 12.4.9 Leading Suppliers and Competition
- 12.4.10 Regional Demand and Opportunities
- 12.5 By Type of Scaffolding - Market Size and Forecast, 2018-2032
- 12.5.1 Segment Definition and Scope
- 12.5.2 Historical Market Size
- 12.5.3 Revenue Forecast, 2018-2032
- 12.5.4 Volume Forecast, 2018-2032
- 12.5.5 Base-Year Market Share, 2018
- 12.5.6 Segment CAGR and Growth Drivers
- 12.5.7 Subsegment Market Size and Forecast
- 12.5.7.1 Supported Scaffolding
- 12.5.7.2 Suspended Scaffolding
- 12.5.7.3 Rolling/Mobile Scaffolding
- 12.5.7.4 Cantilever Scaffolding
- 12.5.7.5 System/Modular Scaffolding
- 12.5.8 Subsegment Pricing and Adoption Trends
- 12.5.9 Leading Suppliers and Competition
- 12.5.10 Regional Demand and Opportunities
- 12.6 Segment Growth Comparison
- 12.7 Segment Attractiveness and Priority Matrix
Chapter 13 U.S. Industrial Scaffolding End-Use and Application Market Outlook
- 13.1 End-Use Industry and Customer Demand Structure
- 13.2 Leading Applications and Customer Groups
- 13.3 End-Use Market Size, Share and Forecast
- 13.4 Major End-Use Industry Deep Dives
- 13.4.1 Customer Requirements and Use Cases
- 13.4.2 Demand and Replacement Cycles
- 13.4.3 Technical and Regulatory Considerations
- 13.4.4 Purchasing and Procurement Models
- 13.4.5 Leading Vendors and Distribution Channels
- 13.4.6 Forecast and Commercial Opportunities
- 13.5 Emerging Applications and Cross-Segment Demand
- 13.6 End-Use Industry Investment Priorities
Chapter 14 U.S. Industrial Scaffolding Geographic Market Outlook, 2018-2032
- 14.1 Domestic Market Distribution and Demand Clusters
- 14.2 State- or Province-Wise Market Size and Forecast, 2018-2032
- 14.3 City and Metropolitan Market Outlook
- 14.4 Industrial, Manufacturing and Commercial Clusters
- 14.5 Geographic Concentration of Key End Users
- 14.6 Local Pricing and Purchasing Differences
- 14.7 Domestic Production Facilities and Capacity Map
- 14.8 Local Infrastructure and Project Pipeline
- 14.9 State-Level Policy and Incentive Differences
- 14.10 Subnational Investment Hotspots and Opportunities
- 14.11 Distribution and Logistics Networks
- 14.12 Domestic Competitive Footprint
Chapter 15 U.S. Industrial Scaffolding Technology, Innovation and Sustainability Outlook
- 15.1 Technology Landscape and Maturity
- 15.2 Product, Process and Service Innovation
- 15.3 AI, Automation and Digital Tools in the Industry
- 15.4 Technology Adoption and Performance Benchmarking
- 15.5 Innovation Pipeline and R&D Investment
- 15.6 Patent and Intellectual Property Trends
- 15.7 Energy Efficiency and Resource Management
- 15.8 Sustainability, Recycling and Circularity
- 15.9 Technology Roadmap, 2018-2032
- 15.10 Risks of Obsolescence and Technology Substitution
Chapter 16 U.S. Industrial Scaffolding Market Key Strategic Imperatives
- 16.1 Growth and Market Entry Priorities
- 16.2 High-Return Products and Segments
- 16.3 Pricing, Profitability and Cost Optimization
- 16.4 Technology Investment and Product Differentiation
- 16.5 Supply Chain Localization and Resilience
- 16.6 Distribution and Customer Acquisition
- 16.7 Partnership, Acquisition and Capacity Strategy
- 16.8 Regional Expansion Priorities
- 16.9 Short-, Medium- and Long-Term Actions
Chapter 17 Competition Outlook
- 17.1 Industry Competition Characteristics
- 17.2 Market Structure and Concentration
- 17.3 Market Share and Competitive Positioning, 2018
- 17.4 Company-Wise Revenue and Product Benchmarking
- 17.5 Production and Service Capacity Benchmarking
- 17.6 Technology, Pricing and Differentiation
- 17.7 Regional Footprint and Distribution Strength
- 17.8 Mergers, Acquisitions and Strategic Alliances
- 17.9 New Entrants and Competitive Threats
- 17.10 Porter's Five Forces and Industry Attractiveness
- 17.11 Competitive Outlook, 2018-2032
Chapter 18 Company Profiles
- 18.1 Company Coverage and Selection Criteria
- 18.2 BrandSafway
- 18.2.1 Business Description
- 18.2.2 Company Ownership and Geographic Presence
- 18.2.3 Product and Service Portfolio
- 18.2.4 Manufacturing and Operating Footprint
- 18.2.5 Production Capacity and Expansion Plans
- 18.2.6 Financial Performance and Investment
- 18.2.7 Market Share and Competitive Position
- 18.2.8 Technology and Innovation Capabilities
- 18.2.9 Strategic Alliances or Partnerships
- 18.2.10 Recent Developments
- 18.2.11 Growth Strategy and Outlook
- 18.3 SafwayAtlantic
- 18.4 Universal Manufacturing Corp
- 18.5 Granite Industries
- 18.6 Bil-Jax (Haulotte Group)
- 18.7 Bee Access Products
- 18.8 Doka USA Ltd.
- 18.9 Matakana Scaffolding
- 18.10 Northern Scaffold Access Inc.
- 18.11 PERI Formwork Systems, Inc.
- 18.12 Other Relevant Market Participants
Note: Every listed company is profiled on the structure shown under the first company. The company list is preliminary and may change based on research findings, market developments, data availability and client requirements.
Chapter 19 Disclaimer
- 19.1 Research and Forecast Disclaimer
- 19.2 Data Source and Estimation Limitations
Note: The depth of individual sections depends on data availability for this market. Volume, capacity, trade and other unit-based metrics are included where applicable.