Market Overview
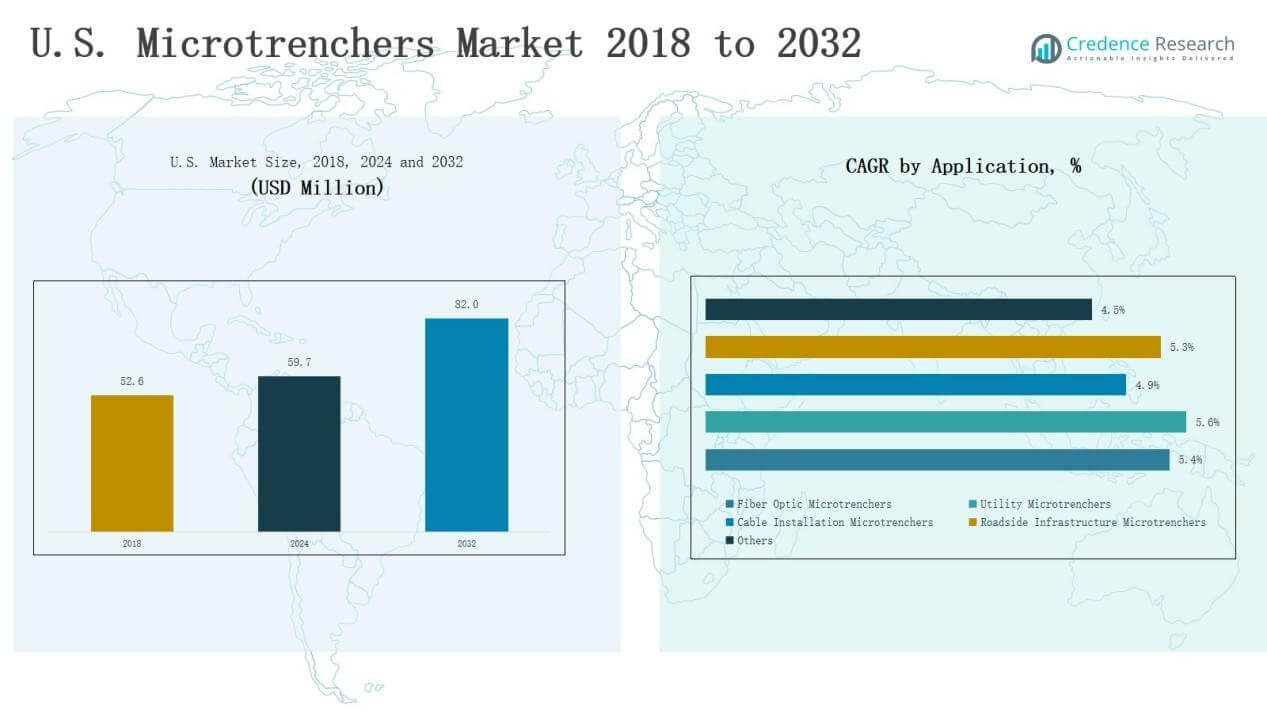
U.S. Microtrenchers Market size was valued at USD 52.6 million in 2018 to USD 59.7 million in 2024 and is anticipated to reach USD 82.0 million by 2032, at a CAGR of 4.05% during the forecast period.
| REPORT ATTRIBUTE |
DETAILS |
| Historical Period |
2020-2023 |
| Base Year |
2024 |
| Forecast Period |
2025-2032 |
| U.S. Microtrenchers Market Size 2024 |
USD 59.7 Million |
| U.S. Microtrenchers Market, CAGR |
4.05% |
| U.S. Microtrenchers Market Size 2032 |
USD 82.0 Million |
The U.S. Microtrenchers Market is shaped by established players such as Ditch Witch, Vermeer, Tesmec, Toro, Barreto, Soni Agrotech, E-Z Trench, Ground Hog, Mastenbroek, and Marais. These companies compete on innovation, efficiency, and service support, with global leaders focusing on automation and eco-friendly trenching solutions, while regional firms strengthen competitiveness with cost-effective models tailored to smaller contractors. Strategic partnerships with telecom operators, utility providers, and municipalities enhance their market penetration. Among regions, the South leads with a 33% share in 2024, driven by rapid urban expansion, 5G rollouts, and renewable energy projects that sustain strong demand for advanced trenching equipment.
Market Insights
- The U.S. Microtrenchers Market grew from USD 52.6 million in 2018 to USD 59.7 million in 2024 and will reach USD 82.0 million by 2032.
- Leading companies include Ditch Witch, Vermeer, Tesmec, Toro, Barreto, Soni Agrotech, E-Z Trench, Ground Hog, Mastenbroek, and Marais, competing on innovation and cost efficiency.
- By type, the 0.5 to 2 Tons segment dominates with 46% share in 2024, driven by compact size, efficiency, and strong urban project demand.
- By application, fiber optic trenchers hold 41% share in 2024, supported by broadband rollouts and 5G expansion, while utility trenchers follow with 27% share.
- Regionally, the South leads with 33% share in 2024, followed by the Northeast at 26%, Midwest at 21%, and West at 20%.
Access crucial information at unmatched prices!
Request your sample report today & start making informed decisions powered by Credence Research Inc.!
Download Sample
Market Segment Insights
By Type
In the U.S. Microtrenchers Market, the 0.5 to 2 Tons segment holds the dominant 46% share in 2024. Its compact size, fuel efficiency, and adaptability make it the preferred choice for urban fiber optic projects and municipal infrastructure upgrades. Growing investments in broadband expansion and smart city programs are strengthening demand for this category. The 2 to 5 Tons segment follows with 28% share, driven by higher-capacity requirements for deeper and longer trenching tasks in utility and energy projects.
- For instance, Vermeer’s microtrencher attachments are designed specifically for urban fiber optics installations, enabling narrow and shallow trench cuts that preserve roadways and reduce surface damage, addressing the need for efficient fiber deployment in dense city environments.
By Application
The Fiber Optic Micro Trenchers segment leads with a 41% share in 2024, supported by nationwide broadband rollouts and rising 5G infrastructure development. Telecom operators increasingly adopt these trenchers for cost-effective, rapid, and low-disruption installations in urban settings. Utility trenchers account for 27% share, backed by electricity, water, and gas pipeline upgrades across cities. Cable installation and roadside infrastructure segments also contribute steadily as states modernize transportation and utility corridors.
- For instance, the California Department of Transportation (Caltrans) has applied trenching machinery in roadway upgrades to integrate fiber optic cabling along major highways, supporting connected transportation initiatives.
By Sales Channel
The Direct Channel dominates with a 62% share in 2024, as major OEMs and equipment manufacturers build strong direct relationships with telecom operators, contractors, and municipal bodies. Direct sales offer advantages such as better after-sales support, customized financing, and reliable supply, which appeal to large-scale projects. The Distribution Channel holds 38% share, playing a key role in reaching smaller contractors and regional markets where localized dealer networks provide accessibility and service coverage.
Market Overview
Key Growth Drivers
Expanding Fiber Optic and 5G Infrastructure
The U.S. is witnessing large-scale investments in broadband expansion and 5G deployment, which drive strong demand for microtrenchers. Telecom operators rely on compact and efficient trenching solutions to lay fiber quickly in dense urban areas while minimizing surface disruption. Federal and state-led initiatives, such as broadband-for-all programs, further boost adoption. The ability of microtrenchers to reduce project timelines and labor costs makes them the preferred equipment for telecom contractors, ensuring consistent growth in this segment.
- For instance, AT&T announced in 2022 that it would expand its fiber internet service to more than 30 million customer locations by 2025, a rollout where faster trenching methods are essential to meet deadlines.
Urban Infrastructure Modernization
Rapid urbanization and government-backed smart city projects are fueling demand for trenching solutions that deliver efficiency and low environmental impact. Microtrenchers are particularly suited for roadside and municipal infrastructure upgrades, including water, power, and communication networks. Their compact size and reduced noise output allow operators to perform projects in congested environments with minimal disruption. With U.S. cities prioritizing resilient and digitally connected infrastructure, demand for microtrenchers is expected to accelerate across both public and private sector projects.
- For instance, in 2023, Verizon used microtrenching to accelerate its 5G fiber deployment across U.S. cities such as Boston and Houston, reducing surface disruption compared to conventional trenching.
Focus on Cost-Efficient Utility Installations
Utility companies are adopting microtrenchers to optimize installation and maintenance of pipelines and cables. Traditional trenching methods involve higher labor costs, longer project timelines, and greater disruption to roadways. Microtrenchers address these issues by offering precise, narrow cuts that reduce restoration expenses and improve project efficiency. Rising emphasis on sustainable construction practices also supports their use, as they consume less fuel and reduce emissions compared to heavier equipment. These advantages strengthen their position as a cost-effective solution in the U.S. market.
Key Trends & Opportunities
Integration of Automation and Smart Features
Manufacturers are integrating automation, GPS guidance, and telematics into microtrenchers, improving precision and reducing operator dependency. These smart features enable contractors to monitor performance, reduce downtime, and ensure compliance with regulatory standards. As digitalization spreads across construction equipment, the U.S. market has a significant opportunity to benefit from advanced, connected trenching systems. Contractors can leverage these innovations to improve safety and productivity, while manufacturers differentiate offerings with cutting-edge technologies.
- For instance, Ditch Witch’s MT26 Microtrencher is part of a complete microtrenching system that allows contractors to cut narrow, clean trenches with extreme precision for fiber optic installations using hydraulic controls and variable depth adjustments.
Growing Adoption in Renewable Energy Projects
Rising investments in renewable energy, particularly solar and wind farms, create opportunities for microtrenchers in cable and utility installations. These projects require reliable underground connections for transmission and control systems, making efficient trenching solutions essential. Microtrenchers provide the flexibility and precision needed for distributed energy infrastructure in both rural and semi-urban locations. As renewable energy expansion accelerates in the U.S., contractors and suppliers will increasingly turn to microtrenching solutions to meet project demands.
- For instance, India has added around 30 GW of renewable energy capacity in 2025 alone, with extensive solar and wind infrastructure deployments demanding flexible and precise trenching solutions for distributed energy networks.
Key Challenges
High Initial Capital Investment
Despite long-term cost savings, microtrenchers require significant upfront investment, which may limit adoption among small contractors. Many regional firms struggle to justify capital expenditure without guaranteed project pipelines, leading them to rely on traditional trenching methods. Financing options remain limited, and smaller operators often face challenges accessing advanced equipment. This barrier slows wider adoption, particularly in secondary markets where telecom and utility projects are less frequent.
Limited Awareness Among Small Contractors
While large-scale operators recognize the efficiency of microtrenchers, many smaller contractors remain unaware of their benefits. A lack of training and familiarity with microtrenching methods hinders adoption in regional markets. Resistance to changing from conventional trenching practices also delays market penetration. Without broader education and demonstration programs, smaller players continue to rely on outdated methods, slowing the pace of transition to modern trenching solutions in the U.S.
Regulatory and Permit Constraints
Microtrenching projects must comply with stringent municipal and state regulations, which often vary by location. Permit approvals can delay deployments, and inconsistent standards across jurisdictions add complexity for contractors. In urban centers, restrictions on working hours, noise levels, and excavation depth further limit trenching operations. Navigating these regulatory hurdles increases project timelines and costs, reducing the appeal of microtrenching for some contractors. Harmonization of standards and streamlined permitting are needed to support wider adoption.
Regional Analysis
Northeast
The Northeast holds a 26% share of the U.S. Microtrenchers Market in 2024. The region benefits from strong investments in broadband expansion and dense urban infrastructure requiring efficient trenching solutions. Telecom operators in states like New York and Massachusetts are accelerating fiber optic deployments, driving consistent demand. Municipalities prioritize compact equipment to minimize road disruption in highly populated areas. It continues to be a hub for early adoption of smart city technologies. Contractors and equipment suppliers gain steady growth opportunities through state-funded connectivity programs.
Midwest
The Midwest accounts for a 21% share of the U.S. Microtrenchers Market in 2024. Infrastructure modernization and utility upgrades in industrial states such as Illinois and Ohio drive adoption. It supports demand for trenchers suited to wide-area utility and energy distribution networks. Agricultural communities also use trenchers for water and power line installations. Contractors value the cost savings provided by narrow-cut trenching in large-scale projects. Federal and state-level funding for rural broadband access strengthens the market presence in the region.
South
The South leads with a 33% share of the U.S. Microtrenchers Market in 2024. Rapid population growth and urban expansion in states such as Texas and Florida drive high demand for fiber optic and utility trenching. It benefits from strong investment in 5G networks and smart infrastructure projects. Contractors rely heavily on compact trenchers for fast project delivery in congested urban areas. Energy infrastructure, including renewable projects, further strengthens adoption. The region continues to attract OEMs and distributors due to its expanding contractor base.
West
The West represents a 20% share of the U.S. Microtrenchers Market in 2024. States such as California and Washington drive demand through large-scale telecom projects and smart city initiatives. Contractors focus on sustainability, making microtrenchers an attractive choice for eco-friendly trenching. It benefits from strong utility and transportation projects requiring efficient underground cabling. Regulations encouraging low-disruption construction practices also support adoption. Continued investment in renewable energy and technology-driven infrastructure ensures steady growth for suppliers in the region.
Market Segmentations:
By Type
- Less than 0.5 Tons
- 5 to 2 Tons
- 2 to 5 Tons
- 10 Tons and Above
By Application
- Fiber Optic Micro Trenchers
- Utility Micro Trenchers
- Cable Installation Micro Trenchers
- Roadside Infrastructure Micro Trenchers
- Others
By Sales Channel
- Direct Channel
- Distribution Channel
By Region
- Northeast
- Midwest
- South
- West
Competitive Landscape
The U.S. Microtrenchers Market is characterized by the presence of both global and regional players competing on technology, efficiency, and service support. Leading companies such as Ditch Witch, Vermeer, Tesmec, Toro, and Barreto dominate the landscape with established product portfolios, dealer networks, and strong brand reputation. These players emphasize innovation in compact design, automation, and eco-friendly trenching solutions to address rising demand from telecom and utility sectors. Regional players like Soni Agrotech, E-Z Trench, and Ground Hog strengthen competition by offering cost-effective and specialized models tailored to smaller contractors. Strategic partnerships with telecom operators, construction firms, and municipal agencies play a key role in securing large-scale contracts. Companies also invest in after-sales services, financing options, and training programs to expand market reach. The competitive intensity remains high, with product differentiation, pricing strategies, and customer support determining market leadership across diverse U.S. regions.
Key Players
- Ditch Witch
- Vermeer
- Tesmec
- Barreto
- Soni Agrotech
- E-Z Trench
- Ground Hog
- Toro
- Mastenbroek
- Marais
Recent Developments
- In June 2025, Vermeer launched the MTR516 microtrencher attachment, designed for fiber-optic installations in urban areas. The equipment cuts trenches up to 17 inches deep and 1–2 inches wide while containing debris through shrouded cutting wheels.
- In March 2025, Cross Country Infrastructure Services partnered with Tesmec USA to deliver advanced trenching solutions, including M5 and 985 models, for U.S. infrastructure and energy projects.
- In January 2025, Vermeer acquired an ownership stake in Vac Truck Industries to co-develop vacuum excavation and trenching systems, enhancing innovation for U.S. applications.
Report Coverage
The research report offers an in-depth analysis based on Type, Application, Sales Channel and Region. It details leading market players, providing an overview of their business, product offerings, investments, revenue streams, and key applications. Additionally, the report includes insights into the competitive environment, SWOT analysis, current market trends, as well as the primary drivers and constraints. Furthermore, it discusses various factors that have driven market expansion in recent years. The report also explores market dynamics, regulatory scenarios, and technological advancements that are shaping the industry. It assesses the impact of external factors and global economic changes on market growth. Lastly, it provides strategic recommendations for new entrants and established companies to navigate the complexities of the market.
Future Outlook
- Rising demand will be driven by expanding fiber optic and 5G networks across urban areas.
- Compact trenchers will dominate urban projects due to efficiency, reduced disruption, and cost advantages.
- Smart city programs will accelerate adoption of trenchers for modern communication and utility infrastructure development nationwide.
- Renewable energy expansion will create consistent demand for trenchers in underground cabling and distribution projects.
- Direct sales channels will strengthen through strategic partnerships with contractors, telecom operators, and municipalities.
- Manufacturers will increasingly integrate automation, telematics, and GPS features to enhance precision and reduce downtime.
- Training programs and demonstrations will improve awareness, boosting adoption among smaller contractors and regional operators.
- Streamlined regulations and permit processes will encourage faster deployment of trenchers in major urban centers.
- Environmental regulations will drive adoption of trenchers offering lower emissions, fuel efficiency, and sustainable construction practices.
- Competitive intensity will increase as regional players launch affordable, specialized models for localized trenching needs.


