
Market Overview
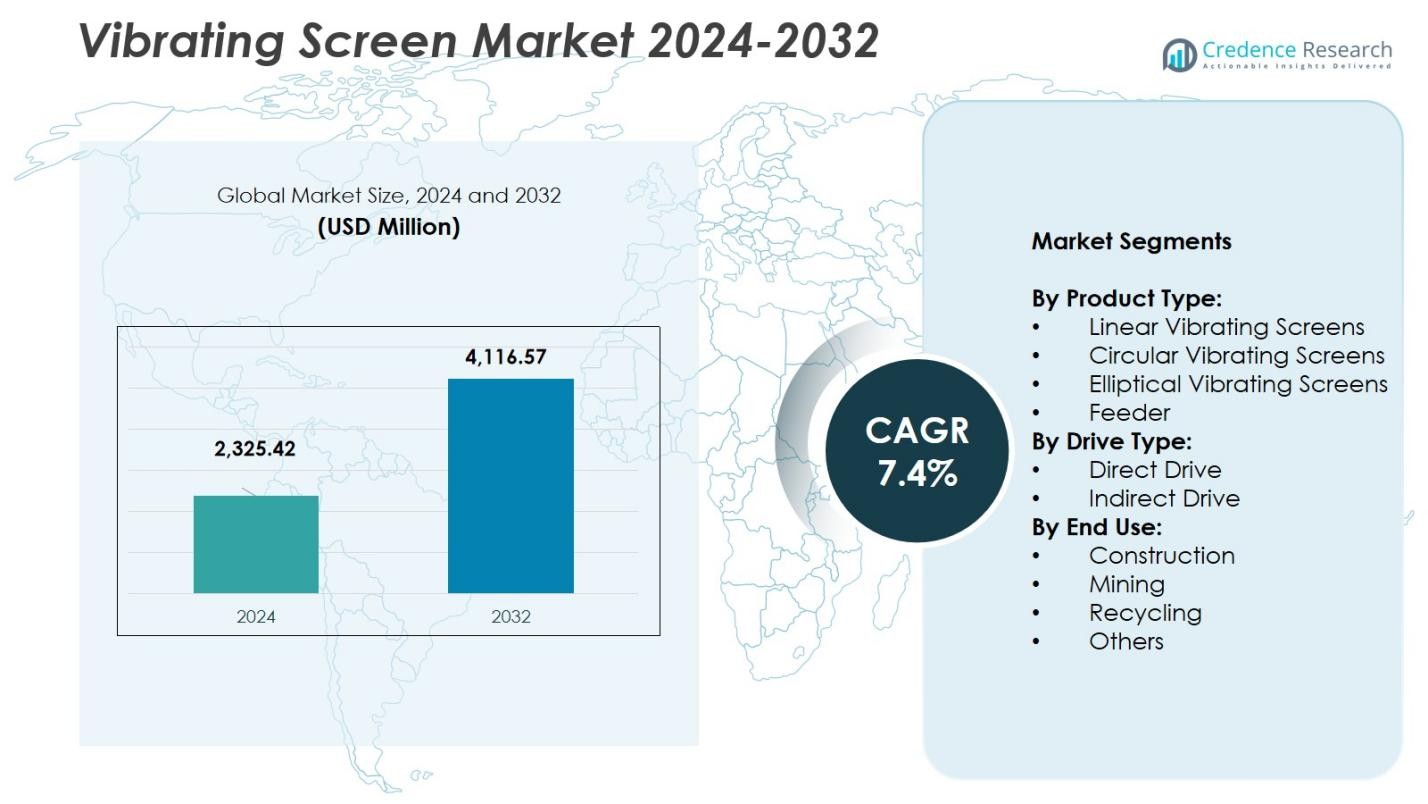
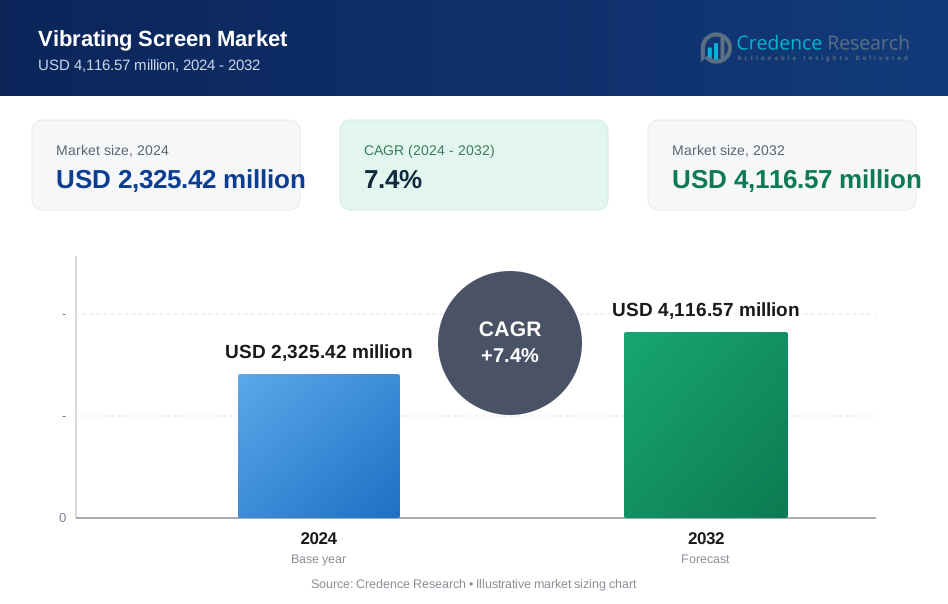
The Vibrating Screen Market size was valued at USD 2,325.42 million in 2024 and is anticipated to reach USD 4,116.57 million by 2032, at a CAGR of 7.4% during the forecast period.
| REPORT ATTRIBUTE | DETAILS |
|---|---|
| Historical Period | 2020-2023 |
| Base Year | 2024 |
| Forecast Period | 2025-2032 |
| Vibrating Screen Market Size 2024 | USD 2,325.42 Million |
| Vibrating Screen Market, CAGR | 7.4% |
| Vibrating Screen Market Size 2032 | USD 4,116.57 Million |
Vibrating Screen Market is driven by the strong presence of key players such as Terex Corporation, Haulotte Group, Oshkosh Corporation, Linamar Corporation, Tadano Ltd, Aichi Corporation, MEC Aerial Work Platforms, Palfinger AG, Hunan Sinoboom Heavy Industries Co. Ltd., and Zheijiang Dingli Machinery Co. Ltd., all focusing on advancing screening efficiency, expanding product lines, and integrating digital monitoring systems. Asia-Pacific emerges as the leading regional market with a 34% share, supported by extensive mining activity, rapid industrialization, and large-scale infrastructure projects. North America follows with 32%, driven by equipment modernization and growing demand for high-capacity screening systems across construction and mineral processing industries.
Market Insights
- The Vibrating Screen Market reached USD 2,325.42 million in 2024 and is forecast to grow at a CAGR of 7.4% through 2032, driven by rising demand across mining and construction industries.
- Market growth is supported by expanding mineral processing activities and increasing adoption of high-capacity screening systems, with the mining segment holding 36.6% share due to its extensive material classification requirements.
- Key trends include rapid integration of IoT-enabled monitoring, modular screen designs, and energy-efficient direct-drive systems, with Circular Vibrating Screens leading the product segment at 48.8% share.
- Major players such as Terex Corporation, Palfinger AG, Tadano Ltd, and Haulotte Group enhance their presence by focusing on product innovation, advanced drive technologies, and stronger aftermarket networks.
- Asia-Pacific leads regional adoption with 34% share, followed by North America at 32% and Europe at 24%, driven by strong industrial expansion, large-scale mining operations, and increasing infrastructure development.
 Market Segmentation Analysis:
By Product Type
The product type segment of the vibrating screen market is led by Circular Vibrating Screens, holding a precise share of 48.8% in 2025. This segment’s dominance is driven by its versatility across mining, construction, and recycling applications and its proven ability to handle large-volume, coarse material separation with reliable performance. The established process flows, growing infrastructure investment, and preference for robust screening equipment have reinforced its leading position in the market.
- For instance, FLSmidth offers Circular Vibrating Screens used extensively in screening rock, ore, and bulk materials across mining and recycling sectors, emphasizing dependable performance for large-volume processing.
By Drive Type
In the drive type segment, Direct Drive systems command the highest share, measured at 54.3% in the relevant market modelling. The leadership of direct drive units stems from their improved energy efficiency, lower mechanical complexity (eliminating belts or coupling), and greater reliability in heavy-duty screening operations. As key end-users demand higher uptime and reduced maintenance costs, direct drive technology continues to gain rapid adoption over indirect drive alternatives.
- For instance, Mainstream Fluid & Air reports that direct drive fans improve mechanical efficiency by up to 15% by eliminating belt and pulley losses, resulting in significant energy savings and lower maintenance needs.
By End Use
Within the end-use categorisation, the Mining sector is the dominant sub-segment, accounting for 36.6% of the market in 2025. The mining industry’s strong demand for screening and classification of ores, the increasing scale of extraction operations, and implementation of high-throughput equipment in mineral processing circuits drive the large share. Growth in infrastructure raw materials, industrial minerals, and the need for efficient material separation underpins mining as the key end-use for vibrating screens.
Key Growth Drivers
Expansion of Mining and Mineral Processing Activities
The expansion of global mining and mineral processing activities serves as a primary growth driver for the vibrating screen market. Rising demand for metals, minerals, and aggregates-fueled by infrastructure development, energy transition initiatives, and industrial output-has increased the adoption of high-capacity screening equipment. Vibrating screens enable efficient material separation, ore grading, and throughput optimization, making them essential for modern mining operations. Additionally, advancements in extraction technologies and expansion of open-pit and underground mines continue to boost demand for durable and high-performance screening solutions.
- For instance, copper mines utilize vibrating screens to sort crushed ore, enhancing extraction efficiency and product quality.
Growing Infrastructure and Construction Sector
Robust infrastructure development, urban expansion, and rising construction spending are significantly accelerating the need for vibrating screens. These systems play a critical role in processing aggregates, sand, and construction materials used in building roads, railways, commercial structures, and housing projects. The demand for precise material sizing and high-efficiency screening has encouraged construction firms to deploy technologically advanced screens. As emerging economies invest heavily in smart cities, transportation networks, and utility infrastructure, the requirement for reliable screening equipment will continue to strengthen across the construction segment.
- For instance, Haver & Boecker Niagara's T-Class vibrating screen features innovations like lockbolted frames and a Drop Guard system, enhancing uptime and durability in aggregate processing.
Shift Toward Automation and Energy-Efficient Screening Equipment
The increasing shift toward automation and energy-efficient industrial machinery is driving widespread adoption of advanced vibrating screens. Modern plants prioritize operational efficiency, reduced downtime, and improved process accuracy, leading to growing demand for automated monitoring, adjustable vibration frequency, and low-energy drive technologies. Intelligent screening systems equipped with sensors and condition-based monitoring support predictive maintenance, improving productivity while lowering operational costs. As industries aim to optimize workflows and comply with sustainability goals, automated and energy-efficient vibrating screens are becoming essential components in material processing environments.
Key Trends & Opportunities
Integration of IoT and Predictive Maintenance Technologies
A major trend reshaping the vibrating screen market is the integration of IoT-enabled sensors and predictive maintenance tools. Real-time tracking of vibration patterns, load distribution, and machine health enables operators to identify faults early and minimize unplanned downtimes. Manufacturers are increasingly offering digitalized screening systems that support cloud-based analytics and remote diagnostics. This shift not only enhances operational reliability but also creates opportunities for value-added service models. As industries modernize production lines, the demand for intelligent, data-driven screening equipment is expected to grow rapidly.
- For instance, NCD’s Industrial IoT wireless vibration and temperature sensor transmits accurate 3-axis vibration data up to 2 miles away using a wireless mesh network, allowing real-time machine health monitoring and early fault detection.
Rising Adoption of Customized and Modular Screening Solutions
Growing preference for customized and modular vibrating screens presents a significant market opportunity. Industries require tailored solutions to manage varying feed types, particle sizes, moisture levels, and throughput demands. Modular screen decks, replaceable panels, and adjustable vibration mechanisms allow users to optimize performance across changing applications. Manufacturers offering configurable screening systems gain a competitive edge by reducing installation time and improving operational flexibility. As sectors like recycling, aggregate processing, and specialty minerals expand, the demand for adaptable screening equipment will continue to rise.
- For instance, Shanbao Machinery’s S5X series incorporates modular vibrators and screen mesh tension plates that can be quickly replaced, reducing maintenance downtime and operational costs.
Key Challenges
High Maintenance Requirements and Downtime Concerns
Frequent maintenance needs and downtime pose major challenges for vibrating screen users. Continuous exposure to heavy loads, abrasive materials, and dynamic vibration forces accelerates wear on screen decks, bearings, and drive components. Maintenance interruptions can lead to productivity losses and increased operational costs, especially in mining and industrial plants operating around the clock. Ensuring reliable performance requires consistent inspection, lubrication, and component replacement, which can strain operational budgets. Overcoming this challenge depends on improved durability, predictive maintenance systems, and robust aftermarket support.
Volatility in Raw Material Prices and Manufacturing Costs
Fluctuations in steel, alloys, and industrial component prices significantly impact the manufacturing cost of vibrating screens. Economic uncertainties, supply chain disruptions, and geopolitical tensions contribute to unstable raw material prices, making cost planning difficult for both manufacturers and end users. Rising production expenses often lead to higher equipment prices, affecting procurement decisions in cost-sensitive sectors. Additionally, the need for high-quality materials to ensure durability further increases manufacturing complexity. Managing cost pressure while maintaining performance standards remains a key challenge for industry participants.
Regional Analysis
North America
North America holds 32% market share in the Vibrating Screen Market, driven by strong demand from mining, aggregates, and construction sectors. The United States leads regional adoption, supported by large-scale mineral processing operations, modernization of screening equipment, and replacement of legacy systems with energy-efficient technologies. Infrastructure refurbishment programs and the expansion of metal extraction activities continue to boost equipment procurement. Additionally, the region’s focus on automated process control and advanced material-handling systems strengthens the demand for high-performance vibrating screens across industrial segments, ensuring continued market leadership.
Europe
Europe accounts for 24% market share, supported by well-established industrial manufacturing, recycling infrastructure, and aggregate production activities. Countries such as Germany, the UK, and France continue to invest in advanced screening technologies to meet stringent environmental regulations and efficiency standards. Demand is further driven by growth in metal recycling and quarrying operations, where precision material separation is essential. The region’s focus on sustainable production, equipment digitalization, and high-quality industrial machinery reinforces the adoption of technologically enhanced vibrating screens. Strong aftermarket services and OEM presence also contribute to steady regional growth.
Asia-Pacific
Asia-Pacific leads global growth momentum with a 34% market share, driven by rapid industrialization, large-scale mining activity, and expanding construction markets in China, India, and Southeast Asia. Massive infrastructure investments, including transport corridors, housing development, and energy projects, continue to increase the need for high-capacity screening equipment. The region’s mineral extraction sector, particularly coal, iron ore, and industrial minerals, significantly boosts equipment demand. Additionally, growing manufacturing output and accelerated urbanization promote extensive adoption of vibrating screens. The emergence of local OEMs offering cost-competitive machinery further strengthens regional market expansion.
Latin America
Latin America holds 6% market share, supported primarily by mining-driven economies such as Brazil, Chile, and Peru. The region’s vast reserves of copper, iron ore, lithium, and precious metals sustain continuous investment in mineral screening and material-handling equipment. Vibrating screens are widely used in beneficiation plants and aggregate processing, driven by rising export demand for minerals. Infrastructure development initiatives and quarrying activities add to market opportunities. However, economic fluctuations and inconsistent industrial spending remain challenges. Despite these constraints, ongoing mining modernization efforts help maintain steady demand across the region.
Middle East & Africa
The Middle East & Africa region accounts for 4% market share, with growth anchored in expanding mining operations, quarrying activities, and construction developments across Gulf countries and Sub-Saharan Africa. Increased extraction of gold, diamonds, phosphates, and industrial metals drives the adoption of vibrating screens in mineral processing. Infrastructure expansion-including roads, commercial construction, and industrial projects-further supports equipment usage. Although political and economic instability impacts some markets, rising foreign investments in mining and ongoing resource exploration initiatives contribute to gradual but consistent regional market growth.
Market Segmentations:
By Product Type:
- Linear Vibrating Screens
- Circular Vibrating Screens
- Elliptical Vibrating Screens
- Feeder
By Drive Type:
- Direct Drive
- Indirect Drive
By End Use:
- Construction
- Mining
- Recycling
- Others
By Region
- North America
- U.S.
- Canada
- Mexico
- Europe
- Germany
- France
- U.K.
- Italy
- Spain
- Rest of Europe
- Asia Pacific
- China
- Japan
- India
- South Korea
- South-east Asia
- Rest of Asia Pacific
- Latin America
- Brazil
- Argentina
- Rest of Latin America
- Middle East & Africa
- GCC Countries
- South Africa
- Rest of the Middle East and Africa
Competitive Landscape
The competitive landscape of the Vibrating Screen Market is shaped by leading players such as Terex Corporation, Haulotte Group, Oshkosh Corporation, Linamar Corporation, Tadano Ltd, Aichi Corporation, MEC Aerial Work Platforms, Palfinger AG, Hunan Sinoboom Heavy Industries Co. Ltd., and Zheijiang Dingli Machinery Co. Ltd. These companies focus on expanding product portfolios, improving screening efficiency, and integrating digital monitoring technologies to strengthen market presence. Innovation in drive mechanisms, modular screen designs, and high-capacity equipment remains central to competitive differentiation. Strategic initiatives such as mergers, facility expansions, and regional distribution enhancements enable stronger global reach. Key players also invest in R&D to develop energy-efficient, low-maintenance systems tailored for mining, construction, and recycling industries. Moreover, partnerships with end-use industries help enhance performance customization and service capabilities. Overall, competition intensifies as manufacturers prioritize technological advances, cost optimization, and aftermarket service expansion to capture greater market share.
Key Player Analysis
- Zheijiang Dingli Machinery Co. Ltd.
- Terex Corporation
- MEC Aerial Work Platforms
- Tadano Ltd
- Hunan Sinoboom Heavy Industries Co. Ltd.
- Linamar Corporation
- Palfinger AG
- Haulotte Group
- Oshkosh Corporation
- Aichi Corporation
Recent Developments
- In October 2025, Finlay launched new inclined screeners (models 693 and 694).
- In July 2024, Weir introduced the ENDURON Orbital vibrating screens (elliptical motion horizontal + circular motion inclined types) for sand, aggregates and mining applications.
- In 2025, Galaxy SIVTEK Pvt. Ltd. launched a new tumbler screen as part of its product expansion in the vibrating screen market.
Report Coverage
The research report offers an in-depth analysis based on Product Type, Drive Type, End Use and Region. It details leading market players, providing an overview of their business, product offerings, investments, revenue streams, and key applications. Additionally, the report includes insights into the competitive environment, SWOT analysis, current market trends, as well as the primary drivers and constraints. Furthermore, it discusses various factors that have driven market expansion in recent years. The report also explores market dynamics, regulatory scenarios, and technological advancements that are shaping the industry. It assesses the impact of external factors and global economic changes on market growth. Lastly, it provides strategic recommendations for new entrants and established companies to navigate the complexities of the market.
Future Outlook
- The market will experience steady demand growth driven by expanding mining, construction, and infrastructure development activities.
- Adoption of energy-efficient vibrating screens will increase as industries prioritize sustainability and operational cost reduction.
- Integration of IoT, automation, and predictive maintenance features will become standard in modern screening equipment.
- Demand for modular and customizable screen designs will rise to support diverse material-processing requirements.
- The recycling and waste management sector will generate new opportunities for advanced screening solutions.
- Manufacturers will strengthen aftermarket services to enhance uptime, maintenance efficiency, and equipment longevity.
- Emerging economies in Asia-Pacific and Africa will drive high-volume equipment procurement through industrial expansion.
- Hybrid and smart drive technologies will gain prominence for improving machine performance and reliability.
- Increased focus on occupational safety will encourage adoption of low-noise and vibration-controlled screen systems.
- Strategic collaborations and capacity expansions will shape competitive positioning and global market penetration.
Request a Free Sample
Fill in your details and we'll send you a free sample report.
- Sample data tables & charts
- Research methodology
Need a Custom Version of This Report?
Tailor the scope, geography, or segments to your exact requirements.
- Custom geography or segment scope
- Direct access to our analyst team
Frequently Asked Questions
What is the current market size for the Vibrating Screen Market, and what is its projected size in 2032?
At what Compound Annual Growth Rate is the Vibrating Screen Market projected to grow between 2025 and 2032?
Which Vibrating Screen Market segment held the largest share in 2024?
What are the primary factors fueling the growth of the Vibrating Screen Market?
Who are the leading companies in the Vibrating Screen Market?
Which region commanded the largest share of the Vibrating Screen Market in 2024?
Table of Content
Chapter 1. Report Introduction
- 1.1 Report Description & Purpose
- 1.1.1 Report Title & Market Definition
- 1.1.2 Unique Selling Propositions (USP) & Key Differentiators
- 1.1.3 Value Proposition for Stakeholders
- 1.2 Research Objectives
- 1.2.1 Market Sizing Objectives (Volume & Revenue) (Volume Where Applicable)
- 1.2.2 Segmentation Objectives
- 1.2.3 Competitive Intelligence Objectives
- 1.2.4 Forecast & Scenario Objectives
- 1.3 Report Scope
- 1.3.1 Vibrating Screen Scope – Segments & Subsegments Covered
- 1.3.2 Geographic Scope – Regions & Countries Covered
- 1.3.3 Historical Period, Base Year & Forecast Period (2024; forecast to 2032)
- 1.3.4 Inclusions & Exclusions
- 1.4 Industry Classification & Applicable Codes
- 1.5 Currency, Measurement Units & Valuation Basis
- 1.6 Target Stakeholders
- 1.7 Limitations & Assumptions
Chapter 2. Executive Summary
- 2.1 Global Vibrating Screen Market Snapshot
- 2.1.1 Market Size – Historical (2024) & Forecast (2024-2032) (2024: USD 2,325.42 million → 2032: USD 4,116.57 million)
- 2.1.2 Volume & Revenue – Global Totals (Volume Where Applicable)
- 2.1.3 Key Market Highlights – Top Five Facts
- 2.2 Vibrating Screen Market Segmentation Snapshot
- 2.2.1 Market Split by Region – 2024 vs. 2032
- 2.3 Competitive Snapshot
- 2.3.1 Top 10 Players by Revenue Share – 2024
- 2.3.2 Top 10 Players by Volume Share – 2024 (Volume Where Applicable)
- 2.3.3 Recent Strategic Developments (18-Month Summary)
- 2.4 Key Investment Highlights & Strategic Conclusions
Chapter 3. Vibrating Screen Market Dynamics & Industry Analysis
- 3.1 Market Overview & Context
- 3.1.1 Vibrating Screen Market Position in the Broader Industry Value Chain
- 3.1.2 Demand Structure & Purchasing Dynamics
- 3.1.3 Market Maturity & Development Stage by Region
- 3.2 Vibrating Screen Market Drivers
- 3.3 Vibrating Screen Market Restraints & Challenges
- 3.4 Vibrating Screen Market Opportunities
- 3.5 Porter's Five Forces Analysis
- 3.5.1 Threat of New Entrants
- 3.5.2 Bargaining Power of Suppliers
- 3.5.3 Bargaining Power of Buyers
- 3.5.4 Threat of Substitutes
- 3.5.5 Competitive Rivalry – Intensity Assessment
- 3.6 Vibrating Screen Value Chain Analysis
- 3.6.1 Upstream – Key Inputs, Resources & Suppliers
- 3.6.1.1 Key Input/Resource 1
- 3.6.1.2 Key Input/Resource 2
- 3.6.1.3 Key Input/Resource 3
- 3.6.2 Midstream – Core Operations & Value Creation
- 3.6.2.1 Operating Model & Process Overview
- 3.6.2.2 Key Operating Locations & Capabilities by Company
- 3.6.3 Downstream – Market Channels & End Users
- 3.6.3.1 Direct Sales & Customer Engagement Channels
- 3.6.3.2 Indirect Sales, Intermediaries & Partner Channels
- 3.6.4 Value Chain Profitability Analysis
- 3.6.1 Upstream – Key Inputs, Resources & Suppliers
- 3.7 PESTEL Analysis
- 3.7.1 Political Factors
- 3.7.2 Economic Factors
- 3.7.3 Social Factors
- 3.7.4 Technological Factors
- 3.7.5 Environmental Factors
- 3.7.6 Legal Factors
- 3.8 Vibrating Screen Supply Chain Analysis
- 3.8.1 Critical Input & Resource Availability Risk Assessment
- 3.8.2 Supplier & Operational Concentration Risk (Geographic Exposure)
- 3.8.3 Supply & Service Disruption Impact Analysis
- 3.9 Regulatory & Policy Landscape
Note: The regulatory and policy landscape section covers regulations based on their applicability to the market, Vibrating Screen category, geography, and scope of the study. Only regulatory frameworks with a material impact on operations, compliance, trade, sustainability, or market access are analyzed in detail.
Chapter 4. Key Investment Pockets & Opportunity Analysis
- 4.1 Vibrating Screen Market Attractiveness Analysis
- 4.1.1 By Region – Investment Attractiveness Matrix (Market Size × CAGR)
- 4.2 Absolute Revenue Growth Opportunity
- 4.2.1 By Region – Absolute Revenue Growth Through 2032
- 4.3 Incremental Demand Opportunity
- 4.3.1 By Region – Incremental Demand Through 2032
- 4.3.2 Segment – Incremental Demand
- 4.4 Emerging Submarket Opportunity Deep Dive (Subject to Applicability)
- 4.5 Priority Market Opportunity Scorecards
- 4.5.1 United States
- 4.5.2 Europe
- 4.5.3 Asia
- 4.5.4 Middle East & Africa
Note: Priority market opportunity scorecards reflect the geographic scope and strategic relevance of the study. Listed markets are indicative and may be adapted to the industry.
Chapter 5. Vibrating Screen Cross-Border Trade & Market Access Analysis
- 5.1 International Trade & Cross-Border Activity Overview
- 5.1.1 Global Export Value by Country (2024)
- 5.1.2 Global Export Volume by Country (2024) (Volume Where Applicable)
- 5.1.3 Global Import Value by Country (2024)
- 5.1.4 Global Import Volume by Country (2024) (Volume Where Applicable)
- 5.1.5 Net Trade Balance by Country (2024)
- 5.2 Export Analysis – Segment
- 5.2.1 Category 1 (Applicable Classification Code)
- 5.2.2 Category 2 (Applicable Classification Code)
- 5.2.3 Category 3 (Applicable Classification Code)
- 5.2.4 Category 4 (Applicable Classification Code)
- 5.2.5 Category 5 (Applicable Classification Code)
- 5.3 Import Analysis – Segment
- 5.3.1 Category 1 (Applicable Classification Code)
- 5.3.2 Category 2 (Applicable Classification Code)
- 5.3.3 Category 3 (Applicable Classification Code)
- 5.3.4 Category 4 (Applicable Classification Code)
- 5.3.5 Category 5 (Applicable Classification Code)
- 5.4 Cross-Border Pricing & Transaction Benchmarks
- 5.4.1 Export Pricing – Segment & Country
- 5.4.2 Import Pricing – Segment & Source Country
- 5.4.3 Price Trends (2024)
- 5.5 Key Cross-Border Trade & Delivery Routes
- 5.5.1 Cross-Border Trade/Delivery Route 1
- 5.5.2 Cross-Border Trade/Delivery Route 2
- 5.5.3 Cross-Border Trade/Delivery Route 3
- 5.5.4 Cross-Border Trade/Delivery Route 4
- 5.5.5 Cross-Border Trade/Delivery Route 5
- 5.6 Trade Policy & Market Access Impact Assessment
- 5.6.1 Tariff & Non-Tariff Barriers
- 5.6.2 Regional Trade & Economic Integration Frameworks
- 5.6.3 Bilateral & Multilateral Trade Agreements
- 5.6.4 Cross-Border Operating, Licensing & Localization Requirements
Note: This chapter applies where cross-border trade or delivery is relevant to Vibrating Screen. Goods, services, and digital offerings are assessed using applicable classifications and transaction measures. Import-export volumes, trade balances, and route analyses are included only where meaningful to the market.
Chapter 6. Competitive Landscape & Company Benchmarking
- 6.1 Vibrating Screen Market Concentration & Structure
- 6.1.1 Herfindahl-Hirschman Index (HHI) – the historical period vs. 2024
- 6.1.2 Leading, Mid-Sized & Emerging Player Structure
- 6.1.3 Global, Regional & Local Player Dynamics
- 6.2 Vibrating Screen Market Share Analysis – 2024
- 6.2.1 Global Revenue Share by Company
- 6.2.2 Global Volume Share by Company (Volume Where Applicable)
- 6.2.3 Regional Revenue Share
- 6.2.4 Market Share Evolution (the historical period vs. 2024)
- 6.2.5 Company Market Share by Key Segment
- 6.2.6 Company Market Share by Customer Group
- 6.3 Operating Scale, Capacity & Infrastructure Analysis
- 6.3.1 Global Operating Scale & Supply Capacity
- 6.3.2 Resource Utilization & Operating Efficiency
- 6.3.3 Output, Service Delivery & Activity Metrics
- 6.3.4 Operating Footprint & Infrastructure Map
- 6.3.5 Planned Operational & Capacity Expansion
- 6.4 Vibrating Screen Competitive Benchmarking Matrix
- 6.4.1 Revenue, Growth, Profitability & Operating Metric Comparison
- 6.4.2 Channel Revenue Mix
- 6.4.3 Geographic Revenue Exposure
- 6.4.4 R&D Intensity
- 6.4.5 Sustainability Maturity
- 6.5 Strategic Developments in Vibrating Screen (Last 24 Months)
- 6.5.1 Mergers, Acquisitions & Divestments
- 6.5.2 New Products, Services & Solutions in Vibrating Screen
- 6.5.3 Operational & Infrastructure Expansions
- 6.5.4 Strategic Alliances, Joint Ventures & Partnerships
- 6.5.5 Distribution Expansion & Market Entry
- 6.5.6 Sustainability & ESG Initiatives
- 6.6 Competitive Strategy Mapping
- 6.6.1 Leader, Challenger, Follower & Niche Classification
- 6.6.2 Pricing Strategy Comparison
- 6.6.3 Channel Strategy Matrix
Note: Strategic developments are included based on their materiality and the availability of reliable information.
Chapter 7. Global Vibrating Screen Market – By Sales & Delivery Channel
- 7.1 Segment Overview
- 7.1.1 Volume & Revenue Split by Channel (2024 & 2032) (Volume Where Applicable)
- 7.1.2 Channel Mix Evolution (2024-2032)
Chapter 8. Regional Market Analysis – Global Overview
- 8.1 Global Regional Overview
- 8.1.1 Regional Volume Share (Volume Where Applicable)
- 8.1.2 Regional Revenue Share
- 8.1.3 Regional Volume by Region (Volume Where Applicable)
- 8.1.4 Regional Revenue by Region
- 8.1.5 Regional Forecast Through 2032
- 8.2 Cross-Regional Segment Analysis
- 8.2.1 By Sales & Delivery Channel
- 8.2.2 By Competitive Positioning & Price Tier
Chapter 9. North America Vibrating Screen Market
- 9.1 United States
- 9.2 Canada
- 9.3 Mexico
Chapter 10. Europe Vibrating Screen Market
- 10.1 Germany
- 10.2 France
- 10.3 Italy
- 10.4 United Kingdom
- 10.5 Spain
- 10.6 Poland
- 10.7 Russia
- 10.8 Netherlands
- 10.9 Belgium
- 10.10 Sweden
- 10.11 Denmark
- 10.12 Norway
- 10.13 Rest of Europe
Chapter 11. Asia Pacific Vibrating Screen Market
- 11.1 China
- 11.2 India
- 11.3 Japan
- 11.4 South Korea
- 11.5 Thailand
- 11.6 Indonesia
- 11.7 Vietnam
- 11.8 Malaysia
- 11.9 Australia
- 11.10 Rest of Asia Pacific
Chapter 12. Latin America Vibrating Screen Market
- 12.1 Brazil
- 12.2 Argentina
- 12.3 Colombia
- 12.4 Chile
- 12.5 Rest of Latin America
Chapter 13. Middle East Vibrating Screen Market
- 13.1 Saudi Arabia
- 13.2 United Arab Emirates
- 13.3 Turkey
- 13.4 Israel
- 13.5 Iran
- 13.6 Rest of the Middle East
Chapter 14. Africa Vibrating Screen Market
- 14.1 South Africa
- 14.2 Egypt
- 14.3 Nigeria
- 14.4 Morocco
- 14.5 Rest of Africa
Chapter 15. Vibrating Screen Company Profiles
- 15.1 [Company 01]
- 15.1.1 Company Overview
- 15.1.2 Key Management Personnel
- 15.1.3 Products & Services Portfolio
- 15.1.4 Financial Performance
- 15.1.5 Key Market Focus & Geographic Presence
- 15.1.6 Recent Developments & Strategic Initiatives
Note: The company profile list is preliminary and may change based on research findings, market developments, data availability, and client requirements.
Chapter 16. Appendices
- Appendix A – List of Abbreviations & Acronyms
- Appendix B – Industry Classification Code Reference – Full Series
- Appendix C – Supply, Output & Operating Capacity Data Tables
- Appendix D – End-Use & Demand Base Tables
- Appendix E – Demand, Adoption & Usage Assumptions
- Appendix F – Pricing & Revenue Metric Reference Tables
- Appendix G – Company Operations & Infrastructure Database
- Appendix H – Cross-Border Trade & Activity Data Tables (Where Applicable)
- Appendix I – Regulatory Summary Tables
- Appendix J – Primary Research Participant List (Anonymized)
- Appendix K – Primary Research Questionnaire Framework
- Appendix L – Data Sources & Bibliography
- Appendix M – Market Size Divergence & Source Comparison
Chapter 17. Research Methodology
- 17.1 Research Framework & Philosophy
- 17.2 Secondary Research – Sources, Hierarchy & Data Extraction
- 17.3 Data Modeling – Bottom-Up & Top-Down Market Sizing
- 17.4 Primary Research – Stakeholder Framework, LOI & Sample Sizes
- 17.5 Forecast Methodology – Regression, Scenario & Sensitivity Analysis
- 17.6 Quality Control – Four-Layer Validation Framework
- 17.7 Limitations & Standard Assumptions
- 17.8 Disclaimer
