Market Overview
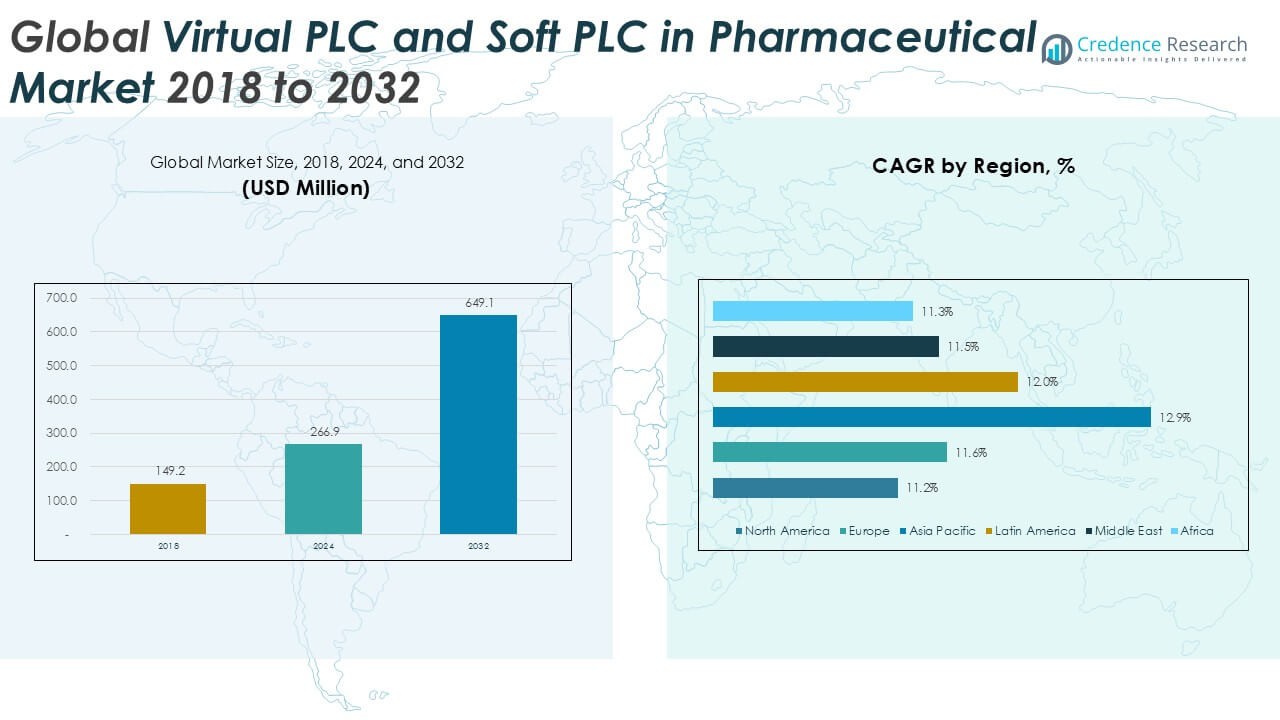
Global Virtual PLC and Soft PLC in Pharmaceutical market size was valued at USD 149.2 million in 2018 and grew to USD 266.9 million in 2024. It is anticipated to reach USD 649.1 million by 2032, expanding at a CAGR of 11.90% during the forecast period.
| REPORT ATTRIBUTE |
DETAILS |
| Historical Period |
2020-2023 |
| Base Year |
2024 |
| Forecast Period |
2025-2032 |
| Virtual PLC and Soft PLC in Pharmaceutical Market Size 2024 |
USD 266.9 Million |
| Virtual PLC and Soft PLC in Pharmaceutical Market, CAGR |
11.90% |
| Virtual PLC and Soft PLC in Pharmaceutical Market Size 2032 |
USD 649.1 Million |
The Global Virtual PLC and Soft PLC in Pharmaceutical market is shaped by leading players such as Siemens, CODESYS Group, Copa-Data, Beckhoff Automation, ABB Ltd., and Delta Electronics, Inc., who compete through innovation in cloud-based platforms, IoT integration, and compliance-driven automation solutions. These companies focus on enhancing flexibility, scalability, and regulatory adherence to meet rising pharmaceutical automation needs. North America led the market with a 33.6% share in 2018, driven by advanced pharmaceutical manufacturing and stringent FDA requirements, while Asia Pacific is projected to expand fastest with a CAGR of 12.9%, supported by cost-effective drug production in China and India. Europe follows closely with 22.3% share in 2018, reflecting strong EMA-driven compliance adoption.
Access crucial information at unmatched prices!
Request your sample report today & start making informed decisions powered by Credence Research Inc.!
Download Sample
Market Insights
- The Global Virtual PLC and Soft PLC in Pharmaceutical market was valued at USD 149.2 million in 2018, reached USD 266.9 million in 2024, and is projected to hit USD 649.1 million by 2032, growing at a CAGR of 11.9%.
- Market growth is driven by increasing automation in pharmaceutical production, with Soft PLC dominating by over 60% share in 2024, due to flexibility, cost efficiency, and easy integration with IoT and analytics platforms.
- Key trends include the rapid adoption of cloud deployment, holding nearly 65% share in 2024, as firms seek scalability, predictive analytics, and global compliance readiness, while process automation leads applications with over 40% share.
- The competitive landscape features Siemens, ABB, Beckhoff, CODESYS, Copa-Data, and Delta Electronics, focusing on product innovation, cloud-based control systems, and AI-driven compliance solutions.
- Regionally, North America led with 33.6% share in 2018, while Asia Pacific is expanding fastest at 12.9% CAGR, supported by large-scale manufacturing hubs in China and India.
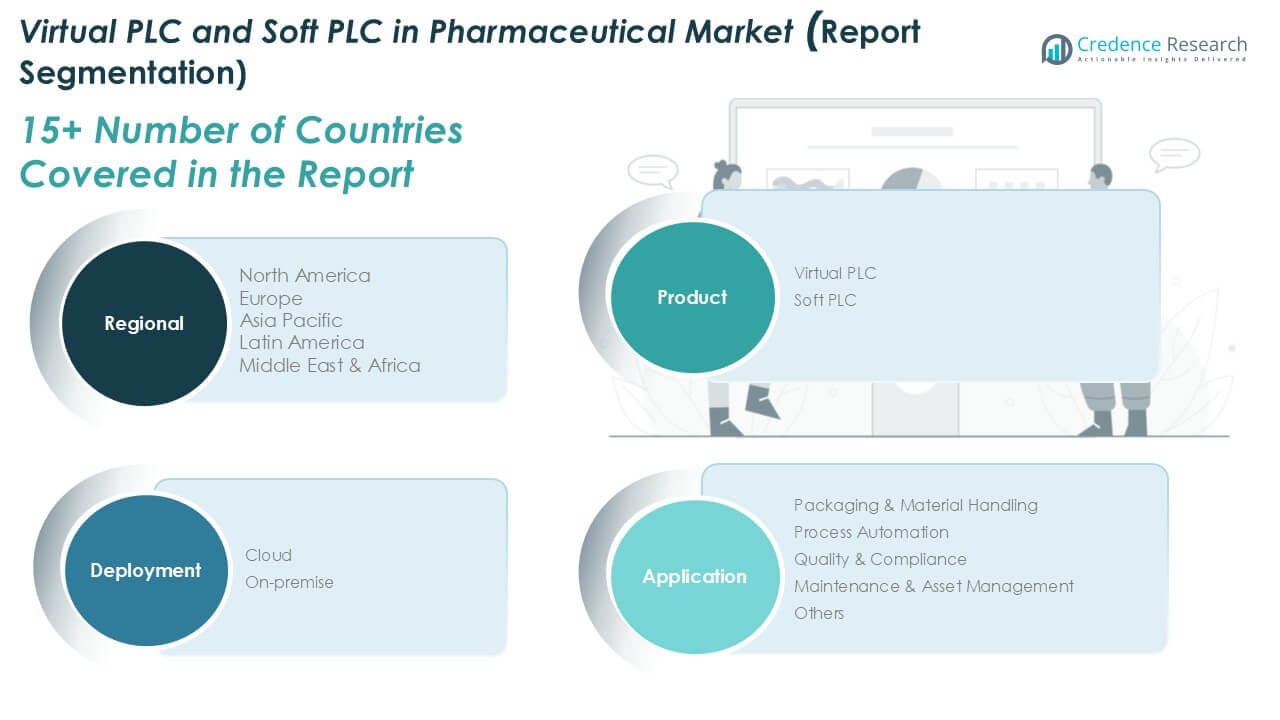
Market Segmentation Analysis:
By Product
The product segment of the Virtual PLC and Soft PLC in pharmaceutical market is divided into Virtual PLC and Soft PLC. Soft PLC held the dominant share of nearly 60% in 2024, driven by its flexibility, compatibility with existing hardware, and reduced cost of ownership. Pharmaceutical firms are adopting Soft PLC solutions to streamline automation in packaging lines and quality control systems without heavy investment in dedicated controllers. Growing demand for efficient integration with IoT platforms and real-time data analytics further strengthens the leadership of Soft PLC across pharmaceutical manufacturing operations.
- For instance, Siemens continues to be a major provider of automation technology, including Soft PLC solutions, for the pharmaceutical industry, where it supports applications like packaging automation and electronic batch record compliance.
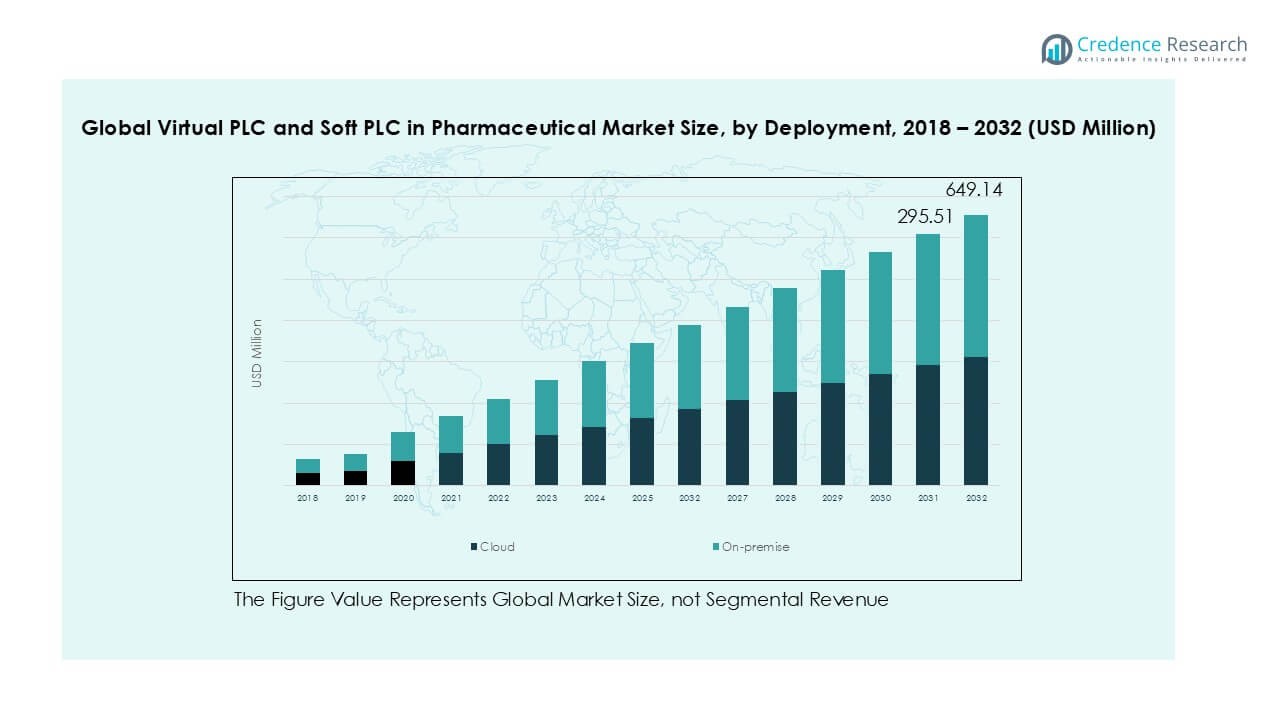
By Deployment
In terms of deployment, the market is segmented into cloud and on-premise solutions. Cloud deployment accounted for around 65% of the market in 2024, leading the segment due to rising adoption of digital transformation strategies in pharmaceutical facilities. The cloud model enables remote monitoring, faster scalability, and centralized control, which are critical for global operations and regulatory compliance. Growing investments in Industry 4.0 and cybersecurity frameworks further accelerate cloud adoption, while on-premise systems remain relevant for facilities requiring localized control and data security.
- For instance, Rockwell Automation launched its PharmaSuite MES with cloud-enabled Soft PLC integration in 2023, allowing remote monitoring of over 100 production lines across multiple continents.
By Application
The application segment includes packaging & material handling, process automation, quality & compliance, maintenance & asset management, and others. Process automation led the segment with over 40% share in 2024, as pharmaceutical companies increasingly depend on automated workflows to improve production efficiency and reduce manual errors. Automated control systems in drug formulation, sterile manufacturing, and batch processing enhance consistency while meeting stringent regulatory requirements. The demand for validated, real-time monitoring systems to ensure compliance with FDA and EMA guidelines continues to drive strong adoption of process automation within pharmaceutical plants.
Key Growth Drivers
Rising Automation in Pharmaceutical Manufacturing
Pharmaceutical companies are rapidly shifting toward advanced automation to improve efficiency, reduce costs, and maintain regulatory compliance. Virtual PLC and Soft PLC systems allow streamlined control across packaging, formulation, and quality monitoring without requiring heavy investments in dedicated hardware. Adoption is fueled by the need for precise and consistent production, particularly in sterile environments where manual errors can impact product safety. With the rise of Industry 4.0, these solutions integrate seamlessly with IoT and smart sensors, enabling real-time monitoring of production lines. As drug manufacturing becomes more complex with biologics and personalized medicine, automation using software-based PLC platforms ensures scalability, flexibility, and faster validation processes, driving sustained demand across global facilities.
- For instance, GSK has collaborated with Siemens on the digitalization of vaccine development and manufacturing processes, utilizing a ‘digital twin’ concept to simulate production and optimize operations. Separately, at its Ware facility, GSK has pursued automation initiatives with other software providers, such as AspenTech, to transition from manual to electronic batch records, reducing manual data entry.
Integration of Cloud-Based Solutions
The increasing adoption of cloud technology is a major driver for Virtual and Soft PLCs in the pharmaceutical sector. Cloud-based deployment models offer centralized monitoring, real-time data access, and predictive analytics across multiple facilities, making them highly attractive for multinational companies. This capability is vital for pharmaceutical firms managing global operations under stringent regulatory frameworks such as FDA and EMA guidelines. Cloud integration allows quick scalability to meet production surges, while also reducing IT infrastructure costs. Additionally, the ability to apply advanced AI and machine learning algorithms in the cloud enhances predictive maintenance, process optimization, and compliance reporting. The growing reliance on cloud platforms for connected manufacturing ecosystems is positioning cloud-enabled Virtual PLC and Soft PLC solutions as key enablers of digital transformation in pharmaceutical production.
- For instance, Novartis deployed Rockwell Automation’s PharmaSuite MES with cloud-based Soft PLC integration in 2023, enabling predictive analytics and centralized monitoring across 14 global manufacturing facilities.
Growing Regulatory Focus on Quality and Compliance
Regulatory compliance is a central driver in the pharmaceutical industry, directly influencing automation system adoption. Virtual PLC and Soft PLC platforms offer precise control, real-time tracking, and advanced validation features that align with global compliance standards like GMP, FDA 21 CFR Part 11, and EMA requirements. The demand for audit-ready data management and electronic batch records encourages manufacturers to deploy these solutions for transparent reporting. With regulators increasingly emphasizing data integrity, error-proofing, and automated quality assurance, the adoption of software-driven PLCs is gaining momentum. By minimizing human intervention and providing traceable records, these systems help companies avoid costly recalls and maintain trust with healthcare providers. The pharmaceutical industry’s heightened focus on risk mitigation and continuous compliance ensures a strong growth outlook for Virtual PLC and Soft PLC solutions.
Key Trends & Opportunities
Expansion of Process Automation and Digital Twins
A major trend shaping the market is the adoption of digital twins and advanced process automation in pharmaceutical facilities. Virtual PLCs enable companies to simulate, test, and optimize production workflows before implementation, significantly reducing downtime and validation costs. This trend is creating opportunities for pharmaceutical firms to accelerate new drug production cycles and improve operational flexibility. By integrating digital twin technologies with Soft PLC platforms, manufacturers can predict performance, identify bottlenecks, and ensure compliance with regulatory standards in real-time. Growing investments in smart factories and continuous manufacturing processes are expected to further expand opportunities for software-driven automation solutions in the pharmaceutical sector.
- For instance, in October 2022, Sanofi partnered with Dassault Systèmes to use its digital twin technology to optimize production at its new “EVolutive” vaccine facilities in France and Singapore.
Increasing Adoption of AI and Predictive Maintenance
The integration of AI-driven analytics with Virtual and Soft PLC systems is emerging as a key opportunity. Predictive maintenance, enabled by AI algorithms, reduces unplanned downtime and extends equipment life cycles in pharmaceutical facilities. By analyzing large data sets in real time, AI-enhanced PLC solutions can forecast potential failures and recommend preventive measures, ensuring continuous operations. This capability is particularly valuable in sterile drug manufacturing, where downtime can cause compliance risks and revenue losses. As pharmaceutical firms adopt AI-powered PLC platforms, opportunities for vendors providing intelligent and adaptive automation systems are growing rapidly.
Key Challenges
Cybersecurity Risks in Cloud-Based Deployments
While cloud-enabled Virtual and Soft PLC solutions bring scalability and connectivity benefits, they also expose pharmaceutical facilities to cybersecurity threats. Sensitive production data, regulatory records, and intellectual property stored in cloud environments remain vulnerable to breaches and cyberattacks. Any compromise in system security could disrupt production, delay compliance reporting, and harm patient safety. With rising adoption of remote monitoring and connected automation systems, pharmaceutical companies must invest heavily in cybersecurity infrastructure and advanced encryption protocols. This increases deployment costs and may hinder adoption in cost-sensitive regions. Ensuring secure and compliant cloud environments remains a critical challenge for the widespread adoption of Virtual and Soft PLCs in pharmaceuticals.
High Transition and Integration Costs
Another major challenge is the high cost and complexity of transitioning from legacy hardware-based PLC systems to Virtual and Soft PLC platforms. Many pharmaceutical facilities still operate with traditional automation frameworks that require significant reconfiguration for software-based solutions. The integration process often involves retraining staff, restructuring IT infrastructure, and upgrading production lines, all of which add to capital expenditure. Small and mid-sized manufacturers face barriers in justifying these investments, despite the long-term benefits. Additionally, the lack of skilled professionals capable of managing advanced PLC systems slows adoption rates. These factors pose hurdles to the rapid scaling of Virtual and Soft PLC systems across the pharmaceutical industry.
Regional Analysis
North America
North America accounted for the largest regional share, holding 33.6% of the market in 2018 with a size of USD 51.74 million. By 2024, the region expanded to USD 89.50 million and is forecasted to reach USD 207.73 million by 2032, growing at a CAGR of 11.2%. The dominance stems from strong pharmaceutical manufacturing bases in the U.S. and Canada, alongside heavy investments in Industry 4.0 adoption. Stringent FDA regulations encourage the use of automated, validated systems, boosting the adoption of Virtual PLC and Soft PLC platforms across packaging and quality control applications.
Europe
Europe represented 22.3% of the global market in 2018, valued at USD 34.34 million. The region’s size reached USD 60.38 million in 2024 and is projected to climb to USD 143.46 million by 2032, registering a CAGR of 11.6%. The market is driven by strong emphasis on compliance with EMA guidelines and increasing automation across pharmaceutical hubs in Germany, Switzerland, and the U.K. Rising demand for digital monitoring, predictive maintenance, and cloud deployment further supports adoption, positioning Europe as a key contributor to global Virtual PLC and Soft PLC integration.
Asia Pacific
Asia Pacific accounted for 25.4% of the market in 2018, with a value of USD 39.11 million. By 2024, it expanded to USD 74.30 million and is expected to reach USD 194.74 million by 2032, at the highest regional CAGR of 12.9%. Growth is driven by large-scale pharmaceutical production in India, China, and Japan, alongside expanding R&D facilities and cost-efficient manufacturing hubs. Governments promoting smart manufacturing initiatives and rapid adoption of IoT-based automation also fuel demand. Asia Pacific’s leadership in pharmaceutical exports strengthens its role as the fastest-growing region for Virtual PLC and Soft PLC systems.
Latin America
Latin America represented 8.6% of the market in 2018, valued at USD 13.30 million. The region grew to USD 23.98 million in 2024 and is forecasted to reach USD 58.94 million by 2032, recording a CAGR of 12.0%. Brazil and Mexico lead adoption, supported by growing pharmaceutical outsourcing and modernization of production facilities. Regional companies are investing in advanced automation to align with international quality standards, creating opportunities for Virtual PLC and Soft PLC providers. Increasing regulatory reforms and expanding generic drug production also support higher demand across the region.
Middle East
The Middle East accounted for 4.6% of the global market in 2018, valued at USD 7.13 million. By 2024, it reached USD 12.51 million and is projected to expand to USD 29.60 million by 2032, advancing at a CAGR of 11.5%. Growth is supported by investments in pharmaceutical manufacturing under diversification initiatives, particularly in Saudi Arabia and the UAE. Adoption of advanced automation systems helps local manufacturers meet export standards and regulatory requirements. The demand for high-quality production and reduced operational risks makes Virtual PLC and Soft PLC solutions increasingly relevant in this region.
Africa
Africa held a smaller share of 2.3% in 2018, with a market size of USD 3.61 million. The region grew to USD 6.28 million in 2024 and is projected to reach USD 14.67 million by 2032, growing at a CAGR of 11.3%. Pharmaceutical production across South Africa, Nigeria, and Egypt is modernizing, driving early adoption of digital automation. Local challenges in compliance and production efficiency are encouraging facilities to invest in scalable and cost-effective Virtual PLC and Soft PLC systems. While adoption is gradual, Africa presents long-term opportunities as governments increase focus on local drug manufacturing.
Market Segmentations:
By Product
By Deployment
By Application
- Packaging & Material Handling
- Process Automation
- Quality & Compliance
- Maintenance & Asset Management
- Others
By Geography
- North America
- Europe
- Germany
- France
- U.K.
- Italy
- Spain
- Rest of Europe
- Asia Pacific
- China
- Japan
- India
- South Korea
- South-east Asia
- Rest of Asia Pacific
- Latin America
- Brazil
- Argentina
- Rest of Latin America
- Middle East & Africa
- GCC Countries
- South Africa
- Rest of the Middle East and Africa
Competitive Landscape
The competitive landscape of the Global Virtual PLC and Soft PLC in Pharmaceutical market is characterized by the presence of established automation leaders and specialized solution providers. Key players such as Siemens, CODESYS Group, Copa-Data, Beckhoff Automation, ABB Ltd., and Delta Electronics dominate the market with extensive product portfolios and strong global reach. These companies focus on integrating cloud-based platforms, IoT connectivity, and AI-driven analytics to support pharmaceutical manufacturers in achieving regulatory compliance, operational efficiency, and process optimization. Strategic moves such as partnerships, product launches, and expansions into emerging markets remain central to their growth. For instance, Siemens and ABB emphasize smart automation platforms tailored to pharmaceutical production, while CODESYS and Copa-Data provide flexible software solutions for virtual control. With rising demand for validated, secure, and scalable automation systems, competition is intensifying, driving continuous innovation and investment across the industry.
Shape Your Report to Specific Countries or Regions & Enjoy 30% Off!
Key Player Analysis
- Siemens
- CODESYS Group
- Copa-Data
- Beckhoff Automation
- ABB Ltd.
- Delta Electronics, Inc.
- Other Key Players
Recent Developments
- In January 2025, Beckhoff Automation announced a partnership with Riedel, a manufacturer of communication systems, to simplify the integration of their respective control technologies for entertainment venues.
- In July 2025, Delta Electronics announced a partnership with Microchip Technology to incorporate Microchip’s mSiC™ (silicon carbide) technology into its power management and smart energy solutions, targeting high-growth sectors like artificial intelligence and e-mobility.
- In February 2025, Mitsubishi Electric revealed a new technology that enhances system maintenance by visualizing and sharing know-how derived from operator experience.
- In July 2023, Schneider Electric announced a partnership with leading software vendors to enhance the integration of soft PLCs into their EcoStruxure platform. This collaboration aims to provide customers with more flexible and scalable automation solutions.
- In September 2023, ABB introduced new virtualized control solutions that leverage soft PLC technology to enhance industrial automation processes. These solutions aim to improve system responsiveness and reduce operational costs.
Report Coverage
The research report offers an in-depth analysis based on Product, Deployment, Application and Geography. It details leading market players, providing an overview of their business, product offerings, investments, revenue streams, and key applications. Additionally, the report includes insights into the competitive environment, SWOT analysis, current market trends, as well as the primary drivers and constraints. Furthermore, it discusses various factors that have driven market expansion in recent years. The report also explores market dynamics, regulatory scenarios, and technological advancements that are shaping the industry. It assesses the impact of external factors and global economic changes on market growth. Lastly, it provides strategic recommendations for new entrants and established companies to navigate the complexities of the market.
Future Outlook
- The market will witness steady adoption of cloud-based Virtual PLC and Soft PLC platforms.
- Pharmaceutical firms will prioritize automation to improve compliance and reduce operational risks.
- Soft PLC solutions will continue to dominate due to flexibility and integration advantages.
- Virtual PLC adoption will grow as digital twins and simulation tools gain traction.
- AI-enabled predictive maintenance will become a standard feature in pharmaceutical facilities.
- Asia Pacific will emerge as the fastest-growing region with strong manufacturing expansion.
- North America will maintain leadership supported by strict FDA-driven compliance needs.
- Vendors will invest in cybersecurity to secure cloud-based automation systems.
- Partnerships between automation providers and pharmaceutical firms will intensify global reach.
- Long-term opportunities will rise from continuous manufacturing and personalized medicine production.


