Market Overview:
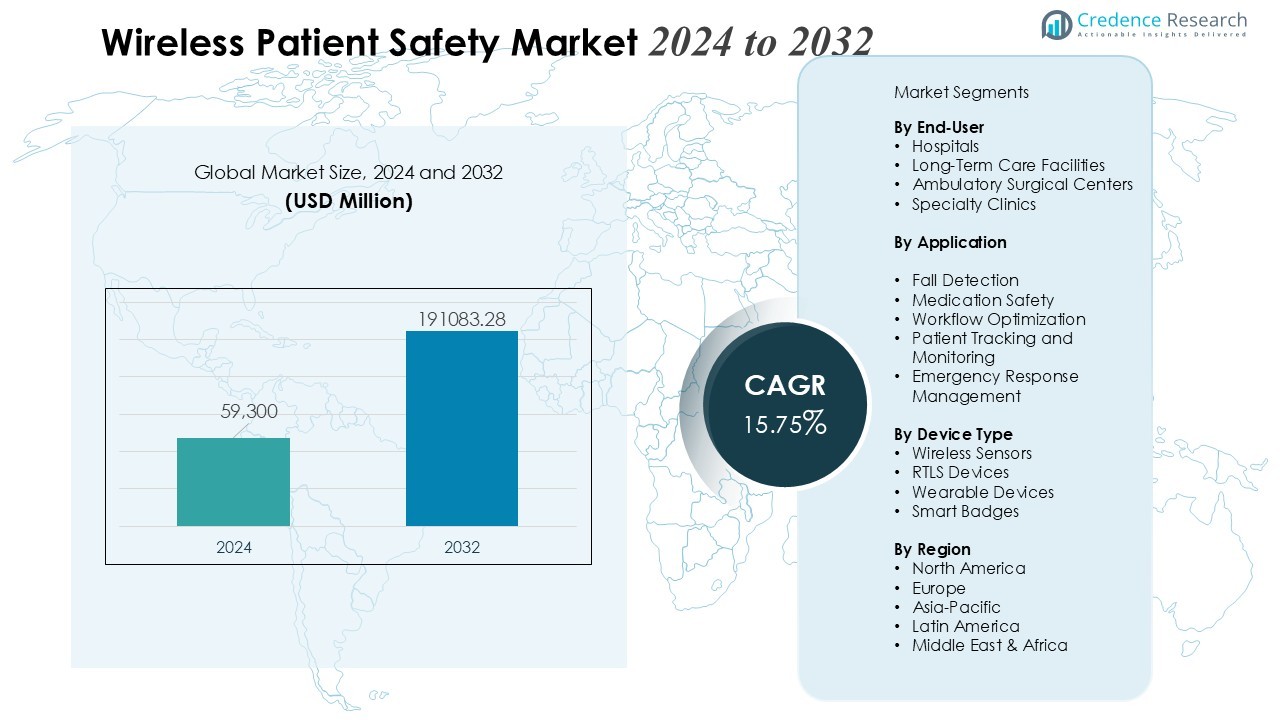
The Wireless Patient Safety Market size was valued at USD 59,300 million in 2024 and is anticipated to reach USD 191083.28 million by 2032, at a CAGR of 15.75% during the forecast period.
| REPORT ATTRIBUTE |
DETAILS |
| Historical Period |
2020-2023 |
| Base Year |
2024 |
| Forecast Period |
2025-2032 |
| Wireless Patient Safety Market Size 2024 |
USD 59,300 Million |
| Wireless Patient Safety Market, CAGR |
15.75% |
| Wireless Patient Safety Market Size 2032 |
USD 191083.28 Million |
Strong drivers shape market momentum, led by rising patient safety mandates, the growing need for continuous monitoring, and rapid adoption of IoT-enabled medical devices. Healthcare providers implement wireless solutions to reduce falls, medication errors, and critical-event response times. Increased deployment of RFID, RTLS, wireless nurse-call systems, and smart alerts strengthens operational efficiency. Higher investments in digital health infrastructure, coupled with demand for cost-effective, scalable safety systems, further accelerate adoption across care settings.
Regionally, North America retains a leading share due to advanced healthcare IT integration, strict regulatory compliance, and strong hospital spending on digital safety tools. Europe demonstrates steady growth supported by standardized patient-safety frameworks and increasing modernization of clinical infrastructure. Asia-Pacific records the fastest growth, driven by expanding hospital networks, rising healthcare digitization, and growing investments in intelligent patient-monitoring solutions.
Access crucial information at unmatched prices!
Request your sample report today & start making informed decisions powered by Credence Research Inc.!
Download Sample
Market Insights:
- The Wireless Patient Safety Market grows from USD 59,300 million (2024) to USD 191,083.28 million (2032), supported by a strong CAGR of 15.75% driven by rising safety mandates and continuous monitoring needs.
- Adoption of IoT-enabled devices, RFID, RTLS, and smart alert systems accelerates as hospitals aim to reduce falls, medication errors, and critical-event response times.
- Real-time monitoring gains priority as providers rely on automated alerts and wireless sensors to enhance early detection and improve response speeds across high-acuity settings.
- Integration of IoT and smart medical devices strengthens workflow accuracy, with advanced deployment improving location tracking, fall prevention, and medication safety.
- Regulatory pressure intensifies investment in wireless platforms, encouraging adoption of automated communication, remote monitoring, and closed-loop safety solutions.
- Infrastructure expansion and demand for scalable, cost-efficient care boost uptake, as hospitals seek flexible systems that improve productivity with minimal upgrades.
- North America leads with mature digital health adoption, Europe shows steady modernization, and Asia-Pacific records the fastest growth due to rapid digitization and smart-hospital investments.
 Market Drivers:
Strengthening Need for Real-Time Patient Monitoring and Risk Prevention
Healthcare providers elevate their focus on continuous visibility over patient conditions to reduce preventable errors. The Wireless Patient Safety Market gains momentum due to the growing shift toward real-time data transmission that supports rapid clinical decisions. Hospitals prioritize automated alerts and wireless sensors to identify deterioration early. It improves response speed and supports safer care delivery across high-acuity and routine settings.
- For instance, Medtronic offers various remote monitoring solutions, including the MyCareLink Smart Monitor, which enables wireless transmission of cardiac data from wearable devices to the Medtronic CareLink network. The broader CareLink network is used to remotely monitor more than 2 million patients with Medtronic cardiac implantable electronic devices (CIEDs) worldwide for timely interventions.
Rising Integration of IoT, RTLS, and Smart Medical Devices Across Care Environments
Digital adoption accelerates due to the need for interoperable and connected systems. IoT-enabled patient-safety tools integrate seamlessly with existing hospital networks to support location tracking, fall prevention, and medication accuracy. The Wireless Patient Safety Market benefits from strong investment in smart technologies that streamline operations. It also strengthens visibility over patient flows and enhances accuracy in high-demand units.
- For instance, Partners HealthCare deployed IoT home monitoring for over 3,000 congestive heart failure patients, achieving a 44% reduction in hospital readmissions over six years.
Growing Regulatory Pressure to Improve Patient Safety and Reduce Clinical Errors
Healthcare authorities enforce strict guidelines that encourage hospitals to invest in wireless safety solutions. Compliance requirements push providers to adopt automated alerting, closed-loop communication, and remote-monitoring platforms. The Wireless Patient Safety Market sees rising demand due to the need to prevent falls, adverse drug events, and workflow inefficiencies. It elevates the role of digital tools in sustaining accountability across care pathways.
Expanding Hospital Infrastructure and Increasing Need for Cost-Efficient Care Delivery
Rising patient volumes and chronic-disease cases drive demand for scalable safety systems. Hospitals implement wireless platforms to optimize staff productivity and reduce operational burden. The Wireless Patient Safety Market advances due to the preference for flexible deployment models that support long-term cost efficiency. It enables providers to manage risks with minimal infrastructure upgrades and stronger data accuracy.
Market Trends:
Accelerated Adoption of Advanced Wireless Monitoring, Automation, and AI-Enabled Patient Safety Solutions
Hospitals expand their digital capability to support safer and more responsive patient care. Providers integrate AI-driven analytics, wireless sensors, and automated alert systems to strengthen risk detection and improve workflow coordination. The Wireless Patient Safety Market sees strong advancement due to adoption of predictive insights that help clinicians identify deterioration earlier. It reinforces clinical decision-making by enabling continuous data capture across multiple patient touchpoints. Healthcare networks invest in scalable platforms that unify alerts, device integration, and remote supervision. Providers demand solutions that improve accuracy, reduce manual checks, and sustain operational consistency. Digital maturity also rises in long-term care facilities where real-time visibility supports stronger oversight.
- For Instance, GE HealthCare began a collaboration with AMC Health to offer remote patient monitoring (RPM) solutions, which leverage an FDA Class II 510(k)-cleared analytics platform.
Transition Toward Interoperable, Multi-Modal Safety Ecosystems and Broader Use of IoT, RTLS, and Cloud Platforms
Healthcare organizations shift toward integrated ecosystems that enable seamless communication between patient-monitoring devices, nurse call systems, and location-tracking tools. Providers deploy RTLS-enabled solutions to improve staff coordination and reduce safety incidents. The Wireless Patient Safety Market evolves due to expansion of IoT architecture that supports high-volume data exchange with strong reliability. It encourages hospitals to consolidate safety workflows under unified cloud-based platforms for better reporting. Demand grows for solutions with robust cybersecurity features that protect patient data across wireless networks. Hospitals emphasize flexibility and modular design to support future upgrades without major infrastructure changes. Cloud deployment also appeals to mid-sized facilities that require efficient scalability and strong operational uptime.
- For instance, RTLS modular systems from providers like Litum allow sensor additions without rewiring, supporting scalability. Facilities report significant time savings and efficiency improvements for expansions.
Market Challenges Analysis:
High Integration Complexity, Interoperability Gaps, and Infrastructure Limitations Across Healthcare Settings
Hospitals struggle to integrate wireless safety systems with legacy equipment and fragmented IT architectures. The Wireless Patient Safety Market faces delays when providers attempt to align multiple devices, protocols, and communication standards. It requires strong technical coordination to ensure stable connectivity and accurate data exchange. Many facilities lack adequate network capacity, which restricts deployment in older infrastructures. Cybersecurity vulnerabilities also increase integration risks. Providers often allocate extended timelines to ensure compliance and system validation.
Cost Pressures, Workforce Constraints, and Limited Technical Readiness in Resource-Constrained Environments
Healthcare organizations encounter financial challenges when adopting advanced wireless platforms, especially in mid-sized and rural facilities. High upfront investment limits adoption of real-time monitoring tools. The Wireless Patient Safety Market experiences slower penetration in regions with limited awareness and insufficient digital training. It becomes difficult for staff to manage new workflows without structured support. Some providers face resistance to technology-driven processes due to workflow disruptions. Maintenance requirements and continuous upgrades also raise operational burden for resource-limited facilities.
Market Opportunities:
Expansion Potential in AI-Driven Monitoring, Predictive Analytics, and Advanced Wireless Infrastructure
Healthcare providers explore next-generation patient safety models that rely on automation, AI-enabled insights, and real-time wireless monitoring. The Wireless Patient Safety Market gains strong opportunity from rising demand for predictive tools that identify deterioration earlier. It supports hospitals that aim to strengthen care coordination through continuous visibility and automated escalation pathways. Adoption of 5G networks creates room for higher device density and faster data exchange. Providers show interest in wearable sensors that improve mobility without compromising safety. Growing preference for interoperable platforms also broadens vendor opportunities in integration, analytics, and workflow optimization.
Growing Investment in Smart Hospitals, Remote Care Models, and Scalable Patient Safety Platforms
Governments and private healthcare networks increase funding for smart hospital development, which expands the opportunity landscape for advanced wireless solutions. Providers accelerate deployment of cloud-hosted safety platforms that deliver strong scalability and lower maintenance effort. The Wireless Patient Safety Market gains traction in remote care settings where fall detection, patient tracking, and automated alerts support proactive intervention. It creates opportunities for vendors to deliver modular solutions suited for long-term care facilities and high-acuity units. Rising emphasis on patient experience strengthens demand for systems that reduce response times. Market participants also benefit from hospital interest in unified dashboards that centralize safety data across multiple departments.
Market Segmentation Analysis:
By End-User
Hospitals hold a major share due to strong adoption of wireless alert systems, RTLS tools, and continuous monitoring solutions. The Wireless Patient Safety Market benefits from large-scale implementation in tertiary and multi-specialty facilities that require rapid clinical response. It also gains demand from long-term care centers where patient mobility, fall prevention, and real-time supervision remain priority. Ambulatory centers invest steadily in compact wireless platforms that support efficient patient flow. Growing preference for integrated dashboards strengthens uptake across all end-user categories.
- For instance, a tertiary hospital’s Remote Patient Monitoring System (RPMS) with automated R-EWS identified deteriorating patients needing ICU transfer with high sensitivity from critical alerts. ICU transfer patients received more alerts than those discharged normally.
By Application
Fall detection leads the segment due to high global fall-related incident rates. Hospitals deploy wireless sensors, location-tracking tools, and automated alerts to reduce risk in high-acuity units. Medication safety solutions gain traction through rising use of barcode-enabled and wireless verification systems. The Wireless Patient Safety Market sees growth in workflow optimization applications where automated communication reduces delays. It expands further through rising interest in emergency response tools that support fast escalation.
- For instance, Vocera’s hands-free wireless communication device improved staff workflow efficiency with 54%-88% positive perception ratings in acute care surveys.
By Device Type
Wireless sensors dominate due to their essential role in real-time monitoring, mobility support, and early risk detection. RTLS devices gain strong adoption in environments that require accurate tracking of patients and clinical assets. Wearables expand rapidly due to the need for comfort, mobility, and uninterrupted data flow. The Wireless Patient Safety Market benefits from wider use of smart badges, wireless nurse call systems, and IoT-enabled devices. It supports hospitals aiming to unify patient safety functions through a connected device ecosystem.
Segmentations:
By End-User
- Hospitals
- Long-Term Care Facilities
- Ambulatory Surgical Centers
- Specialty Clinics
By Application
- Fall Detection
- Medication Safety
- Workflow Optimization
- Patient Tracking and Monitoring
- Emergency Response Management
By Device Type
- Wireless Sensors
- RTLS Devices
- Wearable Devices
- Smart Badges
- Wireless Nurse Call Systems
By Region
- North America
- Europe
- Germany
- France
- U.K.
- Italy
- Spain
- Rest of Europe
- Asia Pacific
- China
- Japan
- India
- South Korea
- South-east Asia
- Rest of Asia Pacific
- Latin America
- Brazil
- Argentina
- Rest of Latin America
- Middle East & Africa
- GCC Countries
- South Africa
- Rest of the Middle East and Africa
Regional Analysis:
North America’s Strong Digital Health Ecosystem and High Adoption of Advanced Wireless Patient Safety Technologies
North America leads due to strong healthcare IT maturity and high investment in real-time safety systems. Hospitals deploy wireless sensors, RTLS platforms, and automated alerting tools at scale to improve clinical response. The Wireless Patient Safety Market gains traction in the region due to strict patient safety regulations and advanced interoperability standards. It benefits from strong presence of digital health vendors that support rapid system integration. Healthcare networks prioritize predictive analytics to reduce falls, medication errors, and workflow delays. Investment in smart hospitals and expansion of cloud-based monitoring platforms reinforce steady growth.
Europe’s Regulatory Alignment, Hospital Modernization, and Expansion of Interoperable Patient Safety Frameworks
Europe maintains robust participation due to harmonized safety policies and structured national digital-health strategies. Hospitals modernize clinical infrastructure with wireless tracking, fall detection, and nurse call systems to strengthen patient care standards. The Wireless Patient Safety Market progresses through demand for interoperable platforms that support efficient data exchange. It gains support from government initiatives aimed at elevating patient safety indicators across public hospitals. Providers emphasize process automation to reduce operational burden and maintain compliance. Western Europe leads adoption, while Eastern Europe shows rising potential driven by infrastructure upgrades.
Asia-Pacific’s Fastest Growth Driven by Healthcare Digitization, High Patient Volumes, and Rising Smart Hospital Investments
Asia-Pacific expands rapidly due to strong momentum in digital transformation across emerging healthcare markets. Hospitals invest in wireless monitoring tools to manage high patient loads and improve clinical efficiency. The Wireless Patient Safety Market grows due to rising deployment of IoT-enabled sensors, RTLS devices, and cloud-based safety platforms. It benefits from government funding directed toward smart hospitals and improved patient outcomes. Demand increases across private healthcare groups that prioritize safety automation and staff coordination. Large patient populations and expanding hospital networks in China, India, and Southeast Asia drive sustained growth.
Key Player Analysis:
- IBM – (U.S.)
- Epic Systems Corporation – (U.S.)
- Oracle – (U.S.)
- Qualcomm Technologies, Inc. – (U.S.)
- AT&T – (U.S.)
- Cambium Networks, Ltd. – (U.S.)
- Hewlett Packard Enterprise Development LP – (U.S.)
- BlueAlly – (U.S.)
- Verizon – (U.S.)
- Koninklijke Philips N.V. – (Netherlands)
Competitive Analysis:
Competitive landscape features leading digital health and technology companies that shape innovation, integration strength, and platform scalability. Key players include IBM (U.S.), Epic Systems Corporation (U.S.), Oracle (U.S.), Qualcomm Technologies, Inc. (U.S.), and AT&T (U.S.). The Wireless Patient Safety Market benefits from strong investment by these firms in AI-enabled analytics, wireless communication frameworks, and advanced data-management architectures. It progresses through expanded partnerships between telecom providers, software vendors, and healthcare systems that seek unified safety ecosystems. Players focus on interoperability, cybersecurity, and high-reliability networks to support real-time monitoring and rapid clinical response. Product portfolios emphasize scalable RTLS tools, predictive alert systems, cloud-based safety platforms, and integrated device connectivity. Competitive strategies center on long-term contracts, regional expansion, and integration of next-generation wireless capabilities that strengthen hospital digital readiness.
Recent Developments:
- In January 2025, IBM announced its planned acquisition of Applications Software Technology, an Oracle consultancy, focusing on public sector cloud application transformations.
- In October 2025, Oracle launched the Oracle AI Factory, bringing new customer and partner AI offerings to accelerate deployment and business outcomes.
Shape Your Report to Specific Countries or Regions & Enjoy 30% Off!
Report Coverage:
The research report offers an in-depth analysis based on End-User, Application, Device Type and Region. It details leading Market players, providing an overview of their business, product offerings, investments, revenue streams, and key applications. Additionally, the report includes insights into the competitive environment, SWOT analysis, current Market trends, as well as the primary drivers and constraints. Furthermore, it discusses various factors that have driven Market expansion in recent years. The report also explores Market dynamics, regulatory scenarios, and technological advancements that are shaping the industry. It assesses the impact of external factors and global economic changes on Market growth. Lastly, it provides strategic recommendations for new entrants and established companies to navigate the complexities of the Market.
Future Outlook:
- Growing adoption of AI-driven monitoring tools will strengthen predictive insights and support faster clinical response across all care settings.
- Expansion of smart hospital programs will accelerate integration of wireless sensors, RTLS platforms, and automated alert systems.
- Demand for interoperable safety ecosystems will rise as providers unify communication, tracking, and monitoring workflows.
- Cloud-based safety platforms will gain traction due to strong scalability, lower maintenance effort, and improved data accessibility.
- Wearable patient-monitoring devices will see wider acceptance due to need for mobility, comfort, and continuous oversight.
- Telehealth expansion will increase use of wireless safety tools in remote care, home care, and long-term care environments.
- Healthcare networks will prioritize cybersecurity enhancements to protect real-time patient data across wireless infrastructures.
- Vendors will focus on modular system design to support flexible upgrades and faster deployment within diverse clinical environments.
- IoT and 5G integration will elevate data transmission speed and device density, enabling advanced patient-safety automation.
- Global partnerships among telecom providers, IT firms, and healthcare institutions will strengthen innovation and accelerate regional market penetration.


