Market Overview
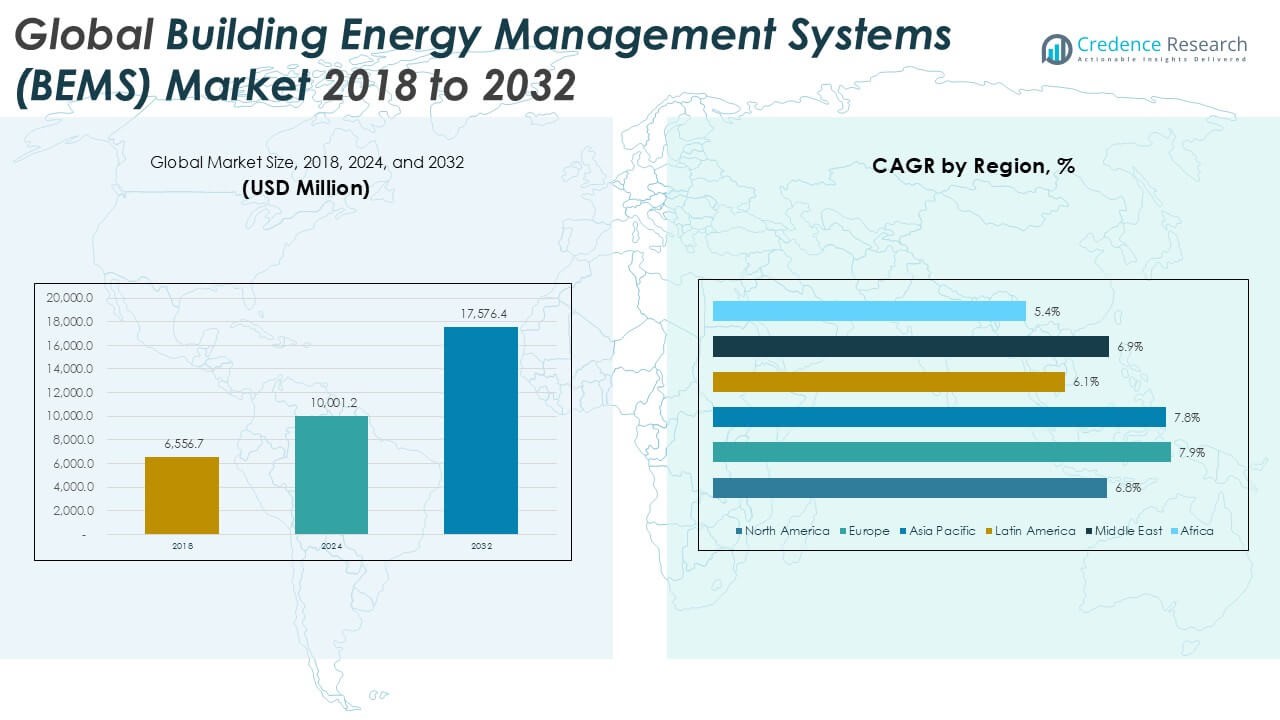
The Global Building Energy Management Systems (BE MS) Market is projected to grow from USD 10,001.2 million in 2024 to an estimated USD 17,576.4 million by 2032, with a compound annual growth rate (CAGR) of 7.33% from 2025 to 2032.
| REPORT ATTRIBUTE |
DETAILS |
| Historical Period |
2020-2023 |
| Base Year |
2024 |
| Forecast Period |
2025-2032 |
| Building Energy Management Systems (BEMS) Market Size 2023 |
USD 10,001.2 Million |
| Building Energy Management Systems (BEMS) Market, CAGR |
7.33% |
| Building Energy Management Systems (BEMS) Market Size 2032 |
USD 17,576.4 Million |
The market is driven by stringent government regulations aimed at reducing carbon emissions and promoting energy-efficient practices. Rising energy costs and increased awareness about environmental sustainability are pushing organizations to adopt BEMS solutions. Additionally, growing demand for smart building infrastructure and green certifications is influencing the adoption of automated energy management technologies. Trends such as demand response programs and integration with renewable energy sources are further shaping the market landscape.
Geographically, North America holds a substantial market share, supported by regulatory policies and widespread adoption of smart building technologies. Europe follows closely due to strong environmental initiatives and energy efficiency mandates. The Asia Pacific region is expected to witness the fastest growth, driven by rapid urbanization, infrastructure development, and government incentives in countries like China, India, and Japan. Key players operating in the Global BEMS Market include Honeywell International Inc., Johnson Controls International plc, Schneider Electric SE, Siemens AG, ABB Ltd, and Emerson Electric Co., among others.
Access crucial information at unmatched prices!
Request your sample report today & start making informed decisions powered by Credence Research Inc.!
Download Sample
Market Insights
- The market is projected to grow from USD 10,001.2 million in 2024 to USD 17,576.4 million by 2032, at a CAGR of 7.33%, driven by rising demand for intelligent energy control solutions.
- Strict government regulations, sustainability goals, and rising energy costs are prompting widespread adoption of BEMS across various sectors.
- Technological advancements such as IoT, AI, and cloud integration are enhancing system performance, real-time monitoring, and energy forecasting.
- High initial investment and complexity of integration with legacy systems remain key barriers for small and medium enterprises.
- Lack of skilled professionals and cybersecurity concerns can limit large-scale deployment of BEMS solutions.
- Asia Pacific leads in growth rate, supported by urban development and government initiatives in countries like China and India.
- North America and Europe dominate in market share due to early adoption of smart building technologies and strong regulatory frameworks.
 Market Drivers
Rising Energy Costs and the Need for Operational Efficiency Are Driving BEMS Adoption
The Global Building Energy Management Systems (BEMS) Market is expanding as organizations face increasing energy costs and seek more efficient energy use. Businesses aim to reduce operational expenses by monitoring and controlling their energy consumption through centralized systems. BEMS solutions allow real-time energy tracking, leading to timely interventions and cost savings. They help identify inefficiencies in HVAC, lighting, and other systems. With tighter budgets and growing utility expenses, enterprises are prioritizing energy-efficient upgrades. The financial benefits of reduced consumption are compelling building owners to invest in integrated energy management platforms.
- For instance, a case study in Europe reported that after implementing a BEMS in an office building with a floor area of 1,676 square meters, the annual energy bill was reduced by EUR €18,560, with energy savings of 121 kWh per square meter and a payback period of 7.3 years
Government Regulations and Sustainability Goals Are Accelerating Market Growth
Governments around the world are implementing strict energy efficiency mandates, building codes, and carbon reduction targets. The Global Building Energy Management Systems (BEMS) Market benefits from these regulations, which often require commercial and public buildings to install energy monitoring systems. Countries in North America, Europe, and Asia are enforcing green building standards and promoting sustainable construction. BEMS helps facilities meet these requirements while enhancing environmental performance. Policy-driven incentives and penalties motivate stakeholders to adopt compliant technologies. The shift toward low-carbon infrastructure is placing BEMS at the core of energy governance strategies.
- For instance, the U.S. Department of Energy reports that buildings in the United States account for nearly 40,000,000,000 kWh of energy consumption annually, and federal investment in grid modernization—including BEMS integration—exceeded $4,500,000,000 to support compliance with advanced building codes and carbon reduction mandates
Technology Integration and Smart Building Development Are Enhancing Market Value
The integration of technologies like IoT, AI, and cloud computing is transforming energy management in buildings. The Global Building Energy Management Systems (BEMS) Market is evolving as these innovations improve system automation, data analytics, and predictive capabilities. Smart sensors and meters feed real-time data into centralized platforms for better decision-making. AI-driven algorithms help forecast energy demand and optimize load distribution. Cloud-based dashboards enable remote access and multi-site control. These capabilities support efficient operations and reduce human error, making BEMS a key enabler of smart building ecosystems.
Growing Emphasis on Renewable Energy and Carbon Neutrality Is Supporting BEMS Expansion
The transition toward renewable energy and net-zero targets is influencing energy strategies in commercial infrastructure. The Global Building Energy Management Systems (BEMS) Market supports this shift by enabling better integration of solar panels, wind systems, and energy storage solutions. BEMS platforms manage distributed energy resources and align consumption patterns with generation capacity. Facilities aim to balance energy demand with on-site renewable production. BEMS ensures grid stability and prevents wastage by coordinating supply and usage effectively. It helps buildings become self-reliant and environmentally responsible while meeting long-term sustainability goals.
Market Trends
Integration of Artificial Intelligence and IoT Is Enhancing System Intelligence and Automation
The Global Building Energy Management Systems (BEMS) Market is witnessing a strong trend toward the adoption of AI and IoT for intelligent energy control. AI enables predictive maintenance and demand forecasting, while IoT sensors collect granular data across various building systems. This combination improves decision-making and allows facilities to adjust energy usage in real time. Smart systems are becoming essential for reducing waste and maintaining consistent performance. These technologies support dynamic energy pricing and optimize energy flows across different zones. The shift from manual controls to intelligent platforms is transforming how buildings manage their energy infrastructure.
- For instance, a government-backed study of Jakarta’s public buildings found that more than 100 government facilities integrated IoT-enabled energy management systems in 2024, resulting in significant improvements in energy efficiency and cost reduction, as reported by building managers and energy authorities
Cloud-Based Platforms Are Gaining Momentum Across Commercial and Industrial Sectors
Cloud-enabled BEMS platforms are growing in popularity due to their scalability, flexibility, and remote accessibility. The Global Building Energy Management Systems (BEMS) Market is moving toward cloud-based deployment models that support centralized monitoring across multiple facilities. These platforms reduce the need for on-premise infrastructure while enhancing data storage and security. Cloud systems enable real-time analytics, performance benchmarking, and automated reporting from any location. Enterprises with geographically dispersed operations benefit from unified control and streamlined upgrades. This shift supports cost-efficient operations and aligns with the increasing demand for digital transformation.
- For instance, in 2024, over 2,000 commercial buildings in the United States adopted cloud-based BEMS platforms to enable remote monitoring and unified control, according to a survey by a leading industry association
Focus on Smart Buildings and Digital Infrastructure Is Driving Market Innovation
Smart building initiatives are shaping the future of energy management. The Global Building Energy Management Systems (BEMS) Market is benefiting from construction projects that integrate digital infrastructure from the ground up. Smart buildings use BEMS to manage lighting, HVAC, security, and power distribution in an interconnected manner. Developers and property managers are focusing on energy transparency, occupant comfort, and environmental certifications. These systems contribute to LEED and BREEAM compliance, which are becoming key benchmarks for modern buildings. Demand for automated, data-driven building operations is expected to increase further.
Energy-as-a-Service and Demand Response Programs Are Creating New Business Models
BEMS providers are increasingly offering energy-as-a-service (EaaS) solutions that bundle system installation, management, and performance guarantees. The Global Building Energy Management Systems (BEMS) Market is adapting to these models, which reduce upfront capital costs for end-users. Demand response programs are also gaining traction, allowing buildings to adjust energy usage based on grid conditions. BEMS plays a central role in enabling this flexibility and improving energy reliability. These approaches promote shared value between service providers and customers. They also encourage faster adoption of energy-efficient technologies in both mature and emerging markets.
Market Challenges
High Implementation Costs and Integration Complexities Are Hindering Adoption
The Global Building Energy Management Systems (BEMS) Market faces significant challenges due to high initial investment and installation costs. Small and medium-sized enterprises often lack the budget to deploy advanced BEMS solutions across their facilities. Integrating BEMS with existing infrastructure, especially in older buildings, creates compatibility issues and requires substantial customization. The lack of standardized protocols further complicates integration with various energy systems and equipment. These technical and financial barriers limit adoption, particularly in price-sensitive markets. Many potential users hesitate to invest without clear short-term returns.
- For instance, industry data shows that the average cost to deploy a basic BEMS is approximately 20 to 30 units per square meter, which amounts to about 250,000 units for a 10,000 square meter building, making such investments a significant hurdle for small and medium-sized enterprises
Data Privacy Concerns and Skilled Workforce Shortage Are Slowing Market Expansion
BEMS platforms collect large volumes of operational data, raising concerns about cybersecurity and data privacy. The Global Building Energy Management Systems (BEMS) Market must address these concerns to build trust among users, especially in sectors handling sensitive information. Without robust security measures, organizations risk system breaches and data loss. Another key challenge is the shortage of skilled professionals who can implement, manage, and maintain BEMS technologies effectively. Many regions lack trained technicians and system integrators familiar with advanced energy management tools. This talent gap delays project deployment and limits system optimization.
Market Opportunities
Growing Smart City Projects and Green Building Initiatives Are Opening New Avenues
The Global Building Energy Management Systems (BEMS) Market has strong growth potential due to rising investments in smart city infrastructure. Governments and private developers are prioritizing energy efficiency and sustainability in urban planning. BEMS plays a central role in achieving these objectives by providing real-time control over energy usage across smart grids and smart buildings. Green building certifications such as LEED and BREEAM are further encouraging the use of intelligent energy systems. These initiatives create demand for advanced BEMS platforms in both new constructions and retrofits. The increasing alignment between urban policy and sustainable energy management is unlocking large-scale opportunities for market players.
Rising Adoption in Emerging Markets and Commercial Sectors Is Expanding Market Scope
Emerging economies are investing in digital infrastructure and energy-efficient technologies to support industrial growth and urban development. The Global Building Energy Management Systems (BEMS) Market is positioned to benefit from this shift as governments in Asia Pacific, Latin America, and the Middle East promote energy conservation. The commercial sector, including offices, retail, and hospitality, is also recognizing the long-term value of optimized energy operations. Cost savings, regulatory compliance, and ESG goals are pushing facility managers to explore BEMS integration. Rising electricity prices and grid instability in developing regions further highlight the need for energy management solutions. These conditions provide a favorable environment for BEMS providers to expand their reach.
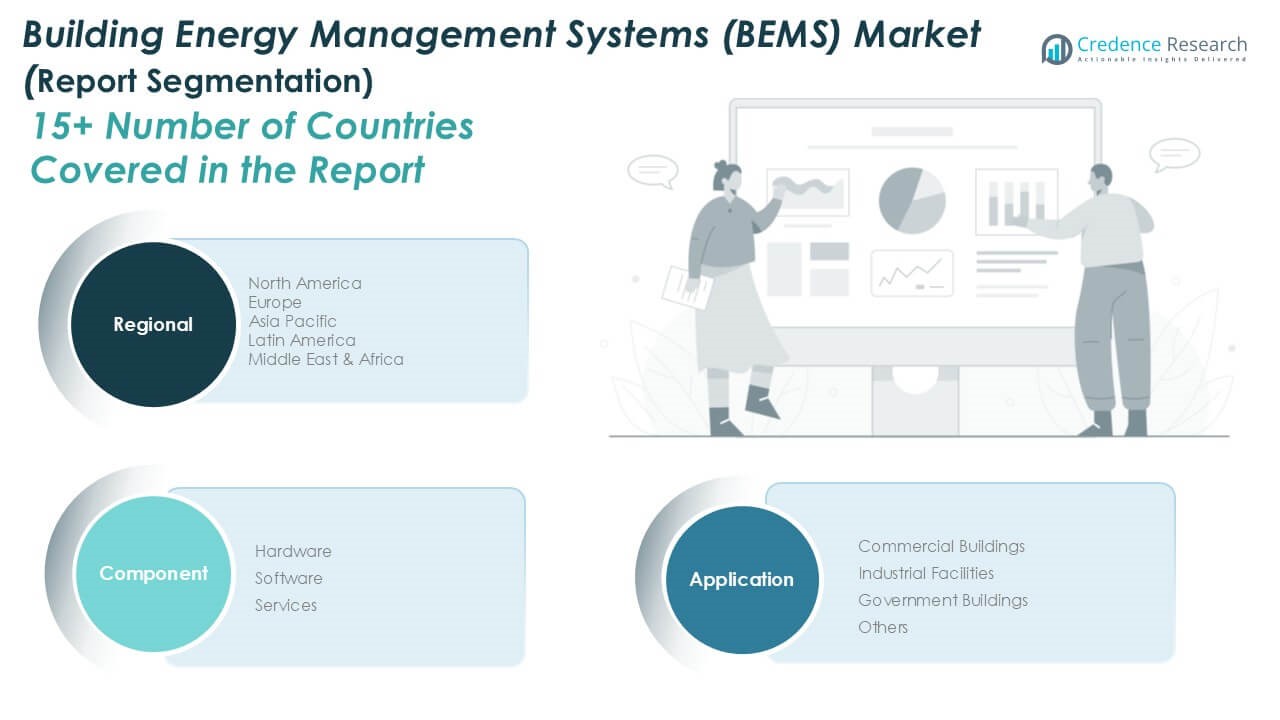
Market Segmentation Analysis
By Component
The Global Building Energy Management Systems (BEMS) Market is segmented into hardware, software, and services. Hardware holds a significant revenue share due to its essential role in collecting data from energy systems through sensors, controllers, and meters. Software is gaining traction as advanced analytics, visualization tools, and cloud-based platforms become critical for real-time decision-making and automation. The software segment is expected to grow at a strong pace driven by the increasing demand for intelligent platforms that optimize energy consumption and system performance. Services such as installation, maintenance, and consulting provide long-term value and ensure the effective deployment of BEMS solutions. It relies on this component mix to support diverse user requirements and ensure seamless integration with building infrastructure.
- For instance, a 2023 industry survey reported that over 2.1 million BEMS hardware units—including sensors, controllers, and meters—were installed in commercial and industrial buildings worldwide.
By Application
The Global Building Energy Management Systems (BEMS) Market, by application, includes commercial buildings, industrial facilities, government buildings, and others. Commercial buildings form the largest segment due to the widespread adoption of BEMS in offices, malls, hotels, and healthcare facilities seeking to reduce energy costs and improve operational efficiency. Industrial facilities use BEMS to manage complex processes and energy-intensive equipment while maintaining regulatory compliance. Government buildings are integrating BEMS to meet sustainability mandates and reduce public sector energy expenses. The “others” category includes educational institutions, residential complexes, and data centers, all increasingly adopting BEMS for better energy visibility and control. It caters to a diverse range of applications by offering tailored energy management solutions across sectors.
- For instance, according to a government energy report, more than 180,000 commercial buildings in the United States had implemented BEMS solutions as of 2023.
Segments
Based on Component
- Hardware
- Software
- Services
Based on Application
- Commercial Buildings
- Industrial Facilities
- Government Buildings
- Others
Based on Region
- North America
- Europe
- UK
- France
- Germany
- Italy
- Spain
- Russia
- Belgium
- Netherlands
- Austria
- Sweden
- Poland
- Denmark
- Switzerland
- Rest of Europe
- Asia Pacific
- China
- Japan
- South Korea
- India
- Australia
- Thailand
- Indonesia
- Vietnam
- Malaysia
- Philippines
- Taiwan
- Rest of Asia Pacific
- Latin America
- Brazil
- Argentina
- Peru
- Chile
- Colombia
- Rest of Latin America
- Middle East
- UAE
- KSA
- Israel
- Turkey
- Iran
- Rest of Middle East
- Africa
- Egypt
- Nigeria
- Algeria
- Morocco
- Rest of Africa
Regional Analysis
North America Building Energy Management Systems (BEMS) Market
North America held a market size of USD 2,389.43 million in 2024 and is projected to reach USD 4,042.57 million by 2032, growing at a CAGR of 6.8%. It accounted for approximately 23.9% of the global market share in 2024. The region’s growth is supported by early adoption of smart building technologies and strong regulatory frameworks around energy efficiency. The United States drives the majority of demand, with a large number of commercial buildings deploying BEMS for cost reduction and sustainability compliance. Energy-as-a-service models are also becoming more prevalent, encouraging small and medium enterprises to adopt these systems. It continues to attract investment in advanced analytics and cloud-based platforms for real-time energy control.
Europe Building Energy Management Systems (BEMS) Market
Europe recorded a market value of USD 2,253.70 million in 2024 and is expected to reach USD 4,137.49 million by 2032, with the highest CAGR among all regions at 7.9%. Europe contributed 22.5% to the global market share in 2024. The European Union’s focus on carbon neutrality and green building certifications such as BREEAM and LEED drives BEMS adoption across commercial and government buildings. Germany, the UK, and France lead the market with well-established infrastructure and supportive policy frameworks. Investments in smart grid and IoT-based systems are creating new opportunities for integration. It remains a leader in sustainable building management practices.
Asia Pacific Building Energy Management Systems (BEMS) Market
Asia Pacific dominated the market in 2024 with a valuation of USD 3,468.98 million and is forecast to reach USD 6,327.51 million by 2032, expanding at a strong CAGR of 7.8%. It captured the largest regional share of 34.7% in 2024. Rapid urbanization, smart city development, and infrastructure modernization in countries like China, India, and Japan are fueling demand for BEMS. Governments are promoting energy efficiency to reduce grid pressure and emissions. The commercial real estate boom and industrial sector expansion are key contributors to market growth. It benefits from a growing pool of domestic technology providers and favorable policy shifts.
Latin America Building Energy Management Systems (BEMS) Market
Latin America’s BEMS market was valued at USD 986.97 million in 2024 and is projected to reach USD 1,581.88 million by 2032, reflecting a CAGR of 6.1%. The region held a 9.9% share of the global market in 2024. Brazil and Mexico are leading adoption, especially in government and commercial buildings, where energy-saving goals are increasingly important. Rising electricity costs and regulatory reforms are encouraging the use of energy-efficient solutions. It is witnessing gradual digital transformation, supported by international funding and public-private partnerships. Market expansion is closely linked to economic stability and smart infrastructure investments.
Middle East Building Energy Management Systems (BEMS) Market
The Middle East market reached USD 652.93 million in 2024 and is anticipated to grow to USD 1,107.31 million by 2032 at a CAGR of 6.9%. Its regional share stood at 6.5% in 2024. Countries such as the UAE and Saudi Arabia are actively deploying BEMS in large-scale commercial and hospitality projects. Vision 2030 initiatives and green building mandates are pushing energy management systems into mainstream construction. Cooling systems and lighting control dominate BEMS installations in high-temperature zones. It shows potential for growth as smart city projects evolve across the Gulf region.
Africa Building Energy Management Systems (BEMS) Market
Africa accounted for USD 249.17 million in 2024 and is projected to reach USD 379.65 million by 2032, with the lowest regional CAGR of 5.4%. The region held a market share of 2.5% in 2024. The market remains at a nascent stage, with growth concentrated in South Africa and parts of North Africa. Infrastructure limitations and funding constraints slow large-scale adoption. However, rising awareness of energy conservation and international development support are expected to boost demand. It is gradually integrating BEMS solutions in urban development and public sector buildings. Long-term growth depends on policy alignment and technology access.
Shape Your Report to Specific Countries or Regions & Enjoy 30% Off!
Key players
- Honeywell International, Inc.
- General Electric Company
- BASF SE
- Schneider Electric SE
- Johnson Controls, Inc.
- Siemens AG
- Rockwell Automation, Inc.
- Emerson Electric Company
- Eaton Corporation Plc
- C3 Energy
Competitive Analysis
The Global Building Energy Management Systems (BEMS) Market is highly competitive, with established players focusing on innovation, strategic partnerships, and regional expansion. Companies such as Honeywell, Schneider Electric, and Johnson Controls lead the market with comprehensive product portfolios and strong global presence. Siemens and Emerson are investing in AI and cloud-based platforms to enhance system performance. New entrants and tech-driven firms like C3 Energy are gaining attention through data analytics and SaaS-based solutions. It favors players that offer scalable, integrated platforms with proven energy efficiency outcomes. Market competition is shaped by continuous technological upgrades, regulatory compliance, and the ability to deliver cost-effective energy management across diverse building types.
Recent Developments
- In May 2025, Siemens AG partnered with AWS at Hannover Messe 2025 to improve IT-OT convergence, expanding IIoT capabilities for energy and building management.
- In April 2025, Johnson Controls published a Forrester study highlighting the impressive results of their OpenBlue platform. The study, focused on the platform’s impact on a composite organization, revealed a 155% return on investment (ROI) over three years, along with a 10% reduction in energy consumption. This means that for every dollar invested, organizations could see a return of $1.55 within three years, while also achieving notable energy savings. The study also indicated an eight-month payback period for the initial investment.
Market Concentration and Characteristics
The Global Building Energy Management Systems (BEMS) Market is moderately concentrated, with a mix of multinational corporations and regional players competing across segments. It is characterized by high technological intensity, frequent innovation, and a strong focus on energy optimization and sustainability. Leading companies maintain competitive advantage through integrated solutions, diverse portfolios, and long-term service contracts. The market favors players with strong R\&D capabilities and the ability to deliver scalable, interoperable systems. Product differentiation, regulatory compliance, and strategic collaborations play a vital role in shaping market dynamics. It continues to evolve with digital transformation, data analytics, and smart infrastructure driving product development and adoption.
Report Coverage
The research report offers an in-depth analysis based on Component, Application and Region. It details leading market players, providing an overview of their business, product offerings, investments, revenue streams, and key applications. Additionally, the report includes insights into the competitive environment, SWOT analysis, current market trends, as well as the primary drivers and constraints. Furthermore, it discusses various factors that have driven market expansion in recent years. The report also explores market dynamics, regulatory scenarios, and technological advancements that are shaping the industry. It assesses the impact of external factors and global economic changes on market growth. Lastly, it provides strategic recommendations for new entrants and established companies to navigate the complexities of the market.
Future Outlook
- The BEMS market will expand with the rising demand for intelligent infrastructure across commercial, industrial, and residential sectors. Integrated systems will support real-time monitoring, automation, and predictive energy analytics.
- Artificial intelligence and machine learning will play a key role in optimizing building performance. These technologies will enable more accurate forecasting and adaptive energy management.
- Cloud-based BEMS solutions will gain traction due to their scalability and centralized control capabilities. Enterprises will rely on remote energy monitoring to streamline operations across multiple locations.
- Stricter energy efficiency regulations and incentives will drive broader market adoption. Governments will support the deployment of BEMS through building codes and sustainability mandates.
- BEMS will become essential for managing distributed energy resources such as solar and wind. These systems will help buildings align energy demand with variable renewable supply.
- Developing countries in Asia Pacific, Latin America, and Africa will offer high growth potential. Urbanization, infrastructure development, and energy efficiency programs will accelerate adoption.
- As BEMS platforms become more connected, cybersecurity will emerge as a top priority. Vendors will invest in secure protocols and data protection frameworks.
- Energy-as-a-service offerings will become more common, reducing upfront investment barriers. These models will attract small and medium enterprises seeking cost-effective energy solutions.
- Vendors will develop tailored BEMS solutions for sectors like healthcare, retail, education, and manufacturing. Customization will drive market penetration by addressing unique operational requirements.
- Ongoing innovation in IoT, digital twins, and edge computing will reshape the market landscape. Competitive pressure will push providers to offer more integrated and intelligent BEMS platforms.


