CHAPTER NO. 1: GENESIS OF THE MARKET
1.1 Market Prelude – Introduction & Scope
1.2 The Big Picture – Objectives & Vision
1.3 Strategic Edge – Unique Value Proposition
1.4 Stakeholder Compass – Key Beneficiaries
CHAPTER NO. 2: EXECUTIVE LENS
2.1 Pulse of the Industry – Market Snapshot
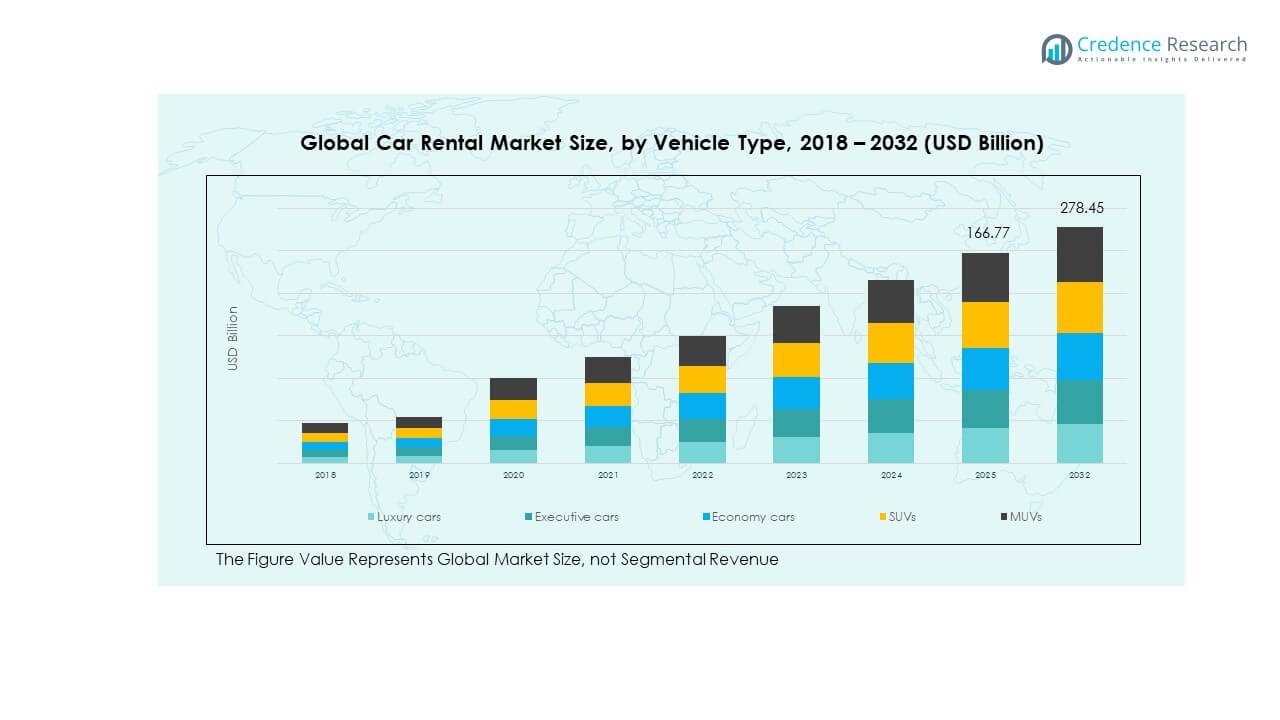
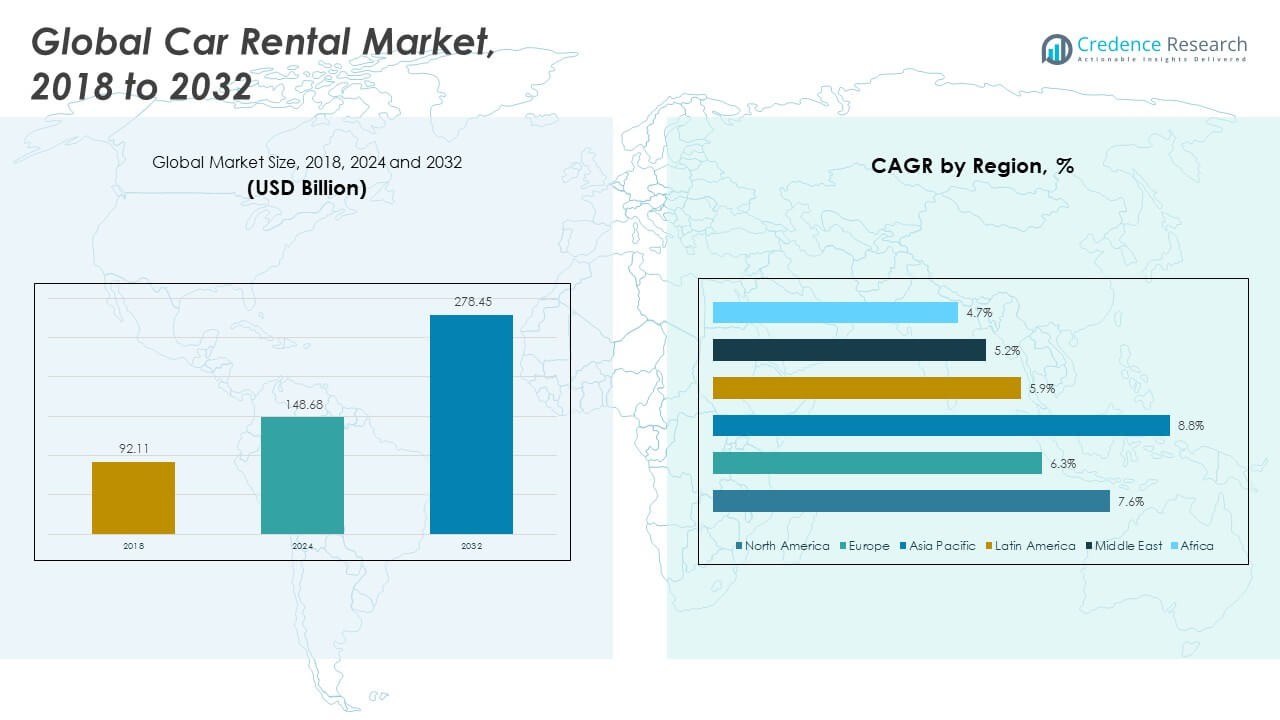
2.2 Growth Arc – Revenue Projections (USD Billion)
2.3. Premium Insights – Based on Primary Interviews
CHAPTER NO. 3: CAR RENTAL MARKET FORCES & INDUSTRY PULSE
3.1 Foundations of Change – Market Overview
3.2 Catalysts of Expansion – Key Market Drivers
3.2.1 Momentum Boosters – Growth Triggers
3.2.2 Innovation Fuel – Disruptive Technologies
3.3 Headwinds & Crosswinds – Market Restraints
3.3.1 Regulatory Tides – Compliance Challenges
3.3.2 Economic Frictions – Inflationary Pressures
3.4 Untapped Horizons – Growth Potential & Opportunities
3.5 Strategic Navigation – Industry Frameworks
3.5.1 Market Equilibrium – Porter’s Five Forces
3.5.2 Ecosystem Dynamics – Value Chain Analysis
3.5.3 Macro Forces – PESTEL Breakdown
3.6 Price Trend Analysis
3.6.1 Regional Price Trend
3.6.2 Price Trend by Product
CHAPTER NO. 4: KEY INVESTMENT EPICENTER
4.1 Regional Goldmines – High-Growth Geographies
4.2 Product Frontiers – Lucrative Product Categories
4.3 Application Sweet Spots – Emerging Demand Segments
CHAPTER NO. 5: REVENUE TRAJECTORY & WEALTH MAPPING
5.1 Momentum Metrics – Forecast & Growth Curves
5.2 Regional Revenue Footprint – Market Share Insights
5.3 Segmental Wealth Flow – Vehicle Type & Rental Model Revenue
CHAPTER NO. 6: TRADE & COMMERCE ANALYSIS
6.1. Import Analysis by Region
6.1.1. Global Car Rental Market Import Volume By Region
6.2. Export Analysis by Region
6.2.1. Global Car Rental Market Export Volume By Region
CHAPTER NO. 7: COMPETITION ANALYSIS
7.1. Company Market Share Analysis
7.1.1. Global Car Rental Market: Company Market Share
7.1. Global Car Rental Market Company Volume Market Share
7.2. Global Car Rental Market Company Revenue Market Share
7.3. Strategic Developments
7.3.1. Acquisitions & Mergers
7.3.2. New Product Launch
7.3.3. Regional Expansion
7.4. Competitive Dashboard
7.5. Company Assessment Metrics, 2024
CHAPTER NO. 8: CAR RENTAL MARKET – BY VEHICLE TYPE SEGMENT ANALYSIS
8.1. Car Rental Market Overview by Vehicle Type Segment
8.1.1. Car Rental Market Volume Share By Vehicle Type
8.1.2. Car Rental Market Revenue Share By Vehicle Type
8.2. Luxury cars
8.3. Executive cars
8.4. Economy cars
8.5. SUVs
8.6. MUVs
CHAPTER NO. 9: CAR RENTAL MARKET – BY RENTAL DURATION SEGMENT ANALYSIS
9.1. Car Rental Market Overview by Rental Duration Segment
9.1.1. Car Rental Market Volume Share By Rental Duration
9.1.2. Car Rental Market Revenue Share By Rental Duration
9.2. Hourly Rentals
9.3. Daily Rentals
9.4. Weekly Rentals
9.5. Monthly Rentals
9.6. Others
CHAPTER NO. 10: CAR RENTAL MARKET – BY RENTAL MODEL SEGMENT ANALYSIS
10.1. Car Rental Market Overview by Rental Model Segment
10.1.1. Car Rental Market Volume Share By Rental Model
10.1.2. Car Rental Market Revenue Share By Rental Model
10.2. Airport Rentals
10.3. Local Rentals
10.4. One-way Rentals
10.5. Round-trip Rentals
CHAPTER NO. 11: CAR RENTAL MARKET – BY CUSTOMER SEGMENT ANALYSIS
11.1. Car Rental Market Overview by Customer Segment
11.1.1. Car Rental Market Volume Share By Customer Segment
11.1.2. Car Rental Market Revenue Share By Customer Segment
11.2. Leisure Rentals
11.3. Business Rentals
11.4. Government and Institutional Rentals
11.5. Insurance Replacement Rentals
11.6. Special Events and Occasions Rentals
11.7. Others
CHAPTER NO. 12: CAR RENTAL MARKET – REGIONAL ANALYSIS
12.1. Car Rental Market Overview by Region Segment
12.1.1. Global Car Rental Market Volume Share By Region
12.1.2. Global Car Rental Market Revenue Share By Region
12.1.3. Regions
12.1.4. Global Car Rental Market Volume By Region
12.1.5. Global Car Rental Market Revenue By Region
12.1.6. Vehicle Type
12.1.7. Global Car Rental Market Volume By Vehicle Type
12.1.8. Global Car Rental Market Revenue By Vehicle Type
12.1.9. Rental Duration
12.1.10. Global Car Rental Market Volume By Rental Duration
12.1.11. Global Car Rental Market Revenue By Rental Duration
12.1.12. Rental Model
12.1.13. Global Car Rental Market Volume By Rental Model
12.1.14. Global Car Rental Market Revenue By Rental Model
12.1.12. Customer Segment
12.1.13. Global Car Rental Market Volume By Customer Segment
12.1.14. Global Car Rental Market Revenue By Customer Segment
CHAPTER NO. 13: NORTH AMERICA CAR RENTAL MARKET – COUNTRY ANALYSIS
13.1. North America Car Rental Market Overview by Country Segment
13.1.1. North America Car Rental Market Volume Share By Region
13.1.2. North America Car Rental Market Revenue Share By Region
13.2. North America
13.2.1. North America Car Rental Market Volume By Country
13.2.2. North America Car Rental Market Revenue By Country
13.2.3. Vehicle Type
13.2.4. North America Car Rental Market Volume By Vehicle Type
13.2.5. North America Car Rental Market Revenue By Vehicle Type
13.2.6. Rental Duration
13.2.7. North America Car Rental Market Volume By Rental Duration
13.2.8. North America Car Rental Market Revenue By Rental Duration
13.2.9. Rental Model
13.2.10. North America Car Rental Market Volume By Rental Model
13.2.11. North America Car Rental Market Revenue By Rental Model
13.2.12. Customer Segment
13.2.13. North America Car Rental Market Volume By Customer Segment
13.2.14. North America Car Rental Market Revenue By Customer Segment
13.3. U.S.
13.4. Canada
13.5. Mexico
CHAPTER NO. 14: EUROPE CAR RENTAL MARKET – COUNTRY ANALYSIS
14.1. Europe Car Rental Market Overview by Country Segment
14.1.1. Europe Car Rental Market Volume Share By Region
14.1.2. Europe Car Rental Market Revenue Share By Region
14.2. Europe
14.2.1. Europe Car Rental Market Volume By Country
14.2.2. Europe Car Rental Market Revenue By Country
14.2.3. Vehicle Type
14.2.4. Europe Car Rental Market Volume By Vehicle Type
14.2.5. Europe Car Rental Market Revenue By Vehicle Type
14.2.6. Rental Duration
14.2.7. Europe Car Rental Market Volume By Rental Duration
14.2.8. Europe Car Rental Market Revenue By Rental Duration
14.2.9. Rental Model
14.2.10. Europe Car Rental Market Volume By Rental Model
14.2.11. Europe Car Rental Market Revenue By Rental Model
14.2.12. Customer Segment
14.2.13. Europe Car Rental Market Volume By Customer Segment
14.2.14. Europe Car Rental Market Revenue By Customer Segment
14.3. UK
14.4. France
14.5. Germany
14.6. Italy
14.7. Spain
14.8. Russia
14.9. Rest of Europe
CHAPTER NO. 15: ASIA PACIFIC CAR RENTAL MARKET – COUNTRY ANALYSIS
15.1. Asia Pacific Car Rental Market Overview by Country Segment
15.1.1. Asia Pacific Car Rental Market Volume Share By Region
15.1.2. Asia Pacific Car Rental Market Revenue Share By Region
15.2. Asia Pacific
15.2.1. Asia Pacific Car Rental Market Volume By Country
15.2.2. Asia Pacific Car Rental Market Revenue By Country
15.2.3. Vehicle Type
15.2.4. Asia Pacific Car Rental Market Volume By Vehicle Type
15.2.5. Asia Pacific Car Rental Market Revenue By Vehicle Type
15.2.6. Rental Duration
15.2.7. Asia Pacific Car Rental Market Volume By Rental Duration
15.2.8. Asia Pacific Car Rental Market Revenue By Rental Duration
15.2.9. Rental Model
15.2.10. Asia Pacific Car Rental Market Volume By Rental Model
15.2.11. Asia Pacific Car Rental Market Revenue By Rental Model
15.2.12. Customer Segment
15.2.13. Asia Pacific Car Rental Market Volume By Customer Segment
15.2.14. Asia Pacific Car Rental Market Revenue By Customer Segment
15.3. China
15.4. Japan
15.5. South Korea
15.6. India
15.7. Australia
15.8. Southeast Asia
15.9. Rest of Asia Pacific
CHAPTER NO. 16: LATIN AMERICA CAR RENTAL MARKET – COUNTRY ANALYSIS
16.1. Latin America Car Rental Market Overview by Country Segment
16.1.1. Latin America Car Rental Market Volume Share By Region
16.1.2. Latin America Car Rental Market Revenue Share By Region
16.2. Latin America
16.2.1. Latin America Car Rental Market Volume By Country
16.2.2. Latin America Car Rental Market Revenue By Country
16.2.3. Vehicle Type
16.2.4. Latin America Car Rental Market Volume By Vehicle Type
16.2.5. Latin America Car Rental Market Revenue By Vehicle Type
16.2.6. Rental Duration
16.2.7. Latin America Car Rental Market Volume By Rental Duration
16.2.8. Latin America Car Rental Market Revenue By Rental Duration
16.2.9. Rental Model
16.2.10. Latin America Car Rental Market Volume By Rental Model
16.2.11. Latin America Car Rental Market Revenue By Rental Model
16.2.12. Customer Segment
16.2.13. Latin America Car Rental Market Volume By Customer Segment
16.2.14. Latin America Car Rental Market Revenue By Customer Segment
16.3. Brazil
16.4. Argentina
16.5. Rest of Latin America
CHAPTER NO. 17: MIDDLE EAST CAR RENTAL MARKET – COUNTRY ANALYSIS
17.1. Middle East Car Rental Market Overview by Country Segment
17.1.1. Middle East Car Rental Market Volume Share By Region
17.1.2. Middle East Car Rental Market Revenue Share By Region
17.2. Middle East
17.2.1. Middle East Car Rental Market Volume By Country
17.2.2. Middle East Car Rental Market Revenue By Country
17.2.3. Vehicle Type
17.2.4. Middle East Car Rental Market Volume By Vehicle Type
17.2.5. Middle East Car Rental Market Revenue By Vehicle Type
17.2.6. Rental Duration
17.2.7. Middle East Car Rental Market Volume By Rental Duration
17.2.8. Middle East Car Rental Market Revenue By Rental Duration
17.2.9. Rental Model
17.2.10. Middle East Car Rental Market Volume By Rental Model
17.2.11. Middle East Car Rental Market Revenue By Rental Model
17.2.12. Customer Segment
17.2.13. Middle East Car Rental Market Volume By Customer Segment
17.2.14. Middle East Car Rental Market Revenue By Customer Segment
17.3. GCC Countries
17.4. Israel
17.5. Turkey
17.6. Rest of Middle East
CHAPTER NO. 18: AFRICA CAR RENTAL MARKET – COUNTRY ANALYSIS
18.1. Africa Car Rental Market Overview by Country Segment
18.1.1. Africa Car Rental Market Volume Share By Region
18.1.2. Africa Car Rental Market Revenue Share By Region
18.2. Africa
18.2.1. Africa Car Rental Market Volume By Country
18.2.2. Africa Car Rental Market Revenue By Country
18.2.3. Vehicle Type
18.2.4. Africa Car Rental Market Volume By Vehicle Type
18.2.5. Africa Car Rental Market Revenue By Vehicle Type
18.2.6. Rental Duration
18.2.7. Africa Car Rental Market Volume By Rental Duration
18.2.8. Africa Car Rental Market Revenue By Rental Duration
18.2.9. Rental Model
18.2.10. Africa Car Rental Market Volume By Rental Model
18.2.11. Africa Car Rental Market Revenue By Rental Model
18.2.12. Customer Segment
18.2.13. Africa Car Rental Market Volume By Customer Segment
18.2.14. Africa Car Rental Market Revenue By Customer Segment
18.3. South Africa
18.4. Egypt
18.5. Rest of Africa
CHAPTER NO. 19: COMPANY PROFILES
19.1. Hertz Global Holdings
19.1.1. Company Overview
19.1.2. Product Portfolio
19.1.3. Financial Overview
19.1.4. Recent Developments
19.1.5. Growth Strategy
19.1.6. SWOT Analysis
19.2. Enterprise Holdings
19.3. Avis Budget Group
19.4. Sixt SE
19.5. Europcar Mobility Group
19.6. China Auto Rental
19.7. Toyota Rent a Car
19.8. Ola Cabs
19.9. Zoomcar
19.10. Getaround
 Market Insights:
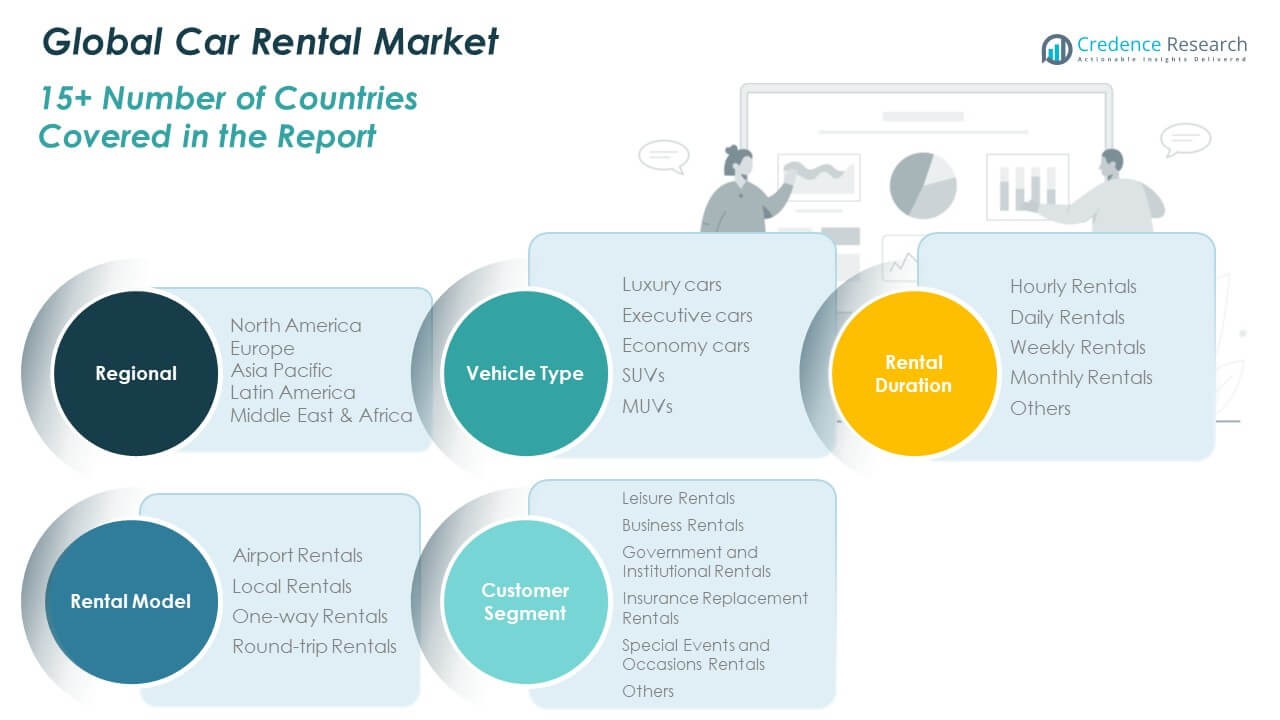 Market Trends: