
Market Overview
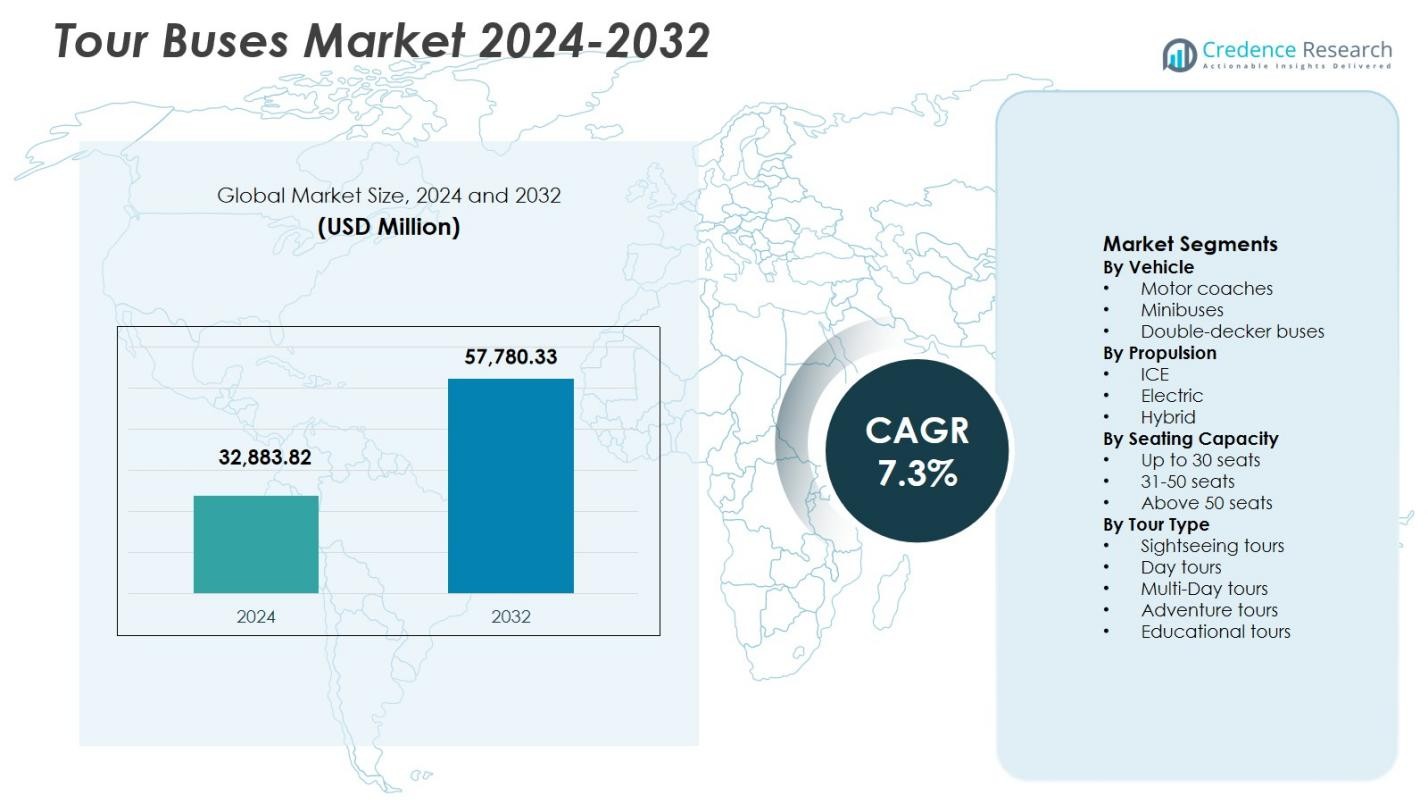
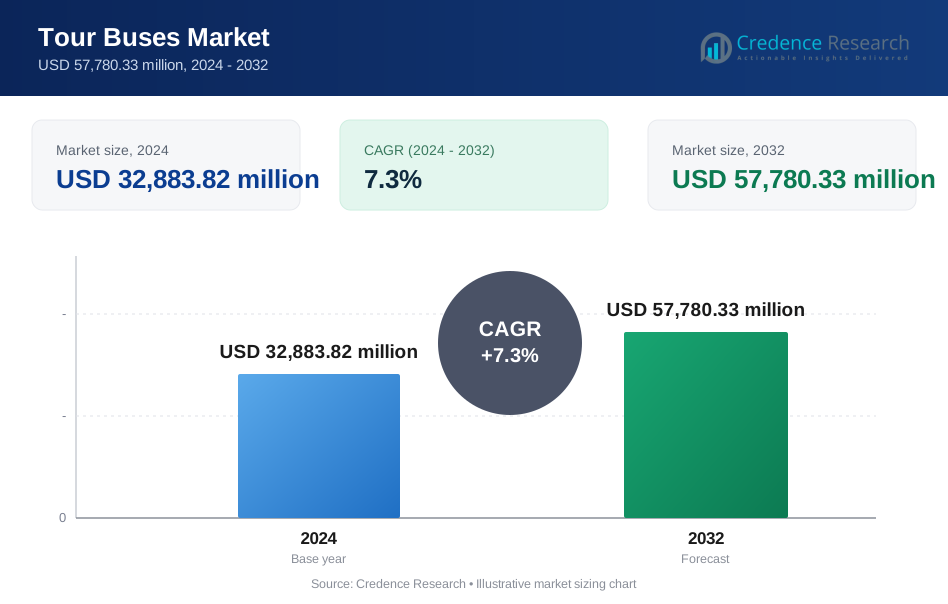
Tour Buses Market size was valued at USD 32,883.82 million in 2024 and is anticipated to reach USD 57,780.33 million by 2032, growing at a CAGR of 7.3% during the forecast period.
| REPORT ATTRIBUTE | DETAILS |
|---|---|
| Historical Period | 2020-2023 |
| Base Year | 2024 |
| Forecast Period | 2025-2032 |
| Tour Buses Market Size 2024 | USD 32,883.82 Million |
| Tour Buses Market, CAGR | 7.3% |
| Tour Buses Market Size 2032 | USD 57,780.33 Million |
Tour Buses Market features established manufacturers such as Alexander Dennis Limited (ADL), BYD Company Limited, Daimler AG (Mercedes-Benz), Gillig Corporation, MAN Truck & Bus, Marcopolo S.A., VDL Groep, Volvo Group, Yutong Group, and Zhongtong Bus Holding Co., Ltd., which focus on product innovation, fleet electrification, and customization to meet diverse tour operator requirements. These players emphasize comfort features, advanced safety systems, and energy-efficient drivetrains to strengthen market presence. Europe led the Tour Buses Market with a 31.4% market share in 2024, supported by dense cross-border tourism, strong coach travel culture, and stringent emission regulations. Asia-Pacific followed with a 28.6% share, driven by expanding domestic tourism and large-scale infrastructure development, while North America accounted for 26.8%, supported by organized intercity travel and luxury motor coach demand.
Market Insights
- Tour Buses Market was valued at USD 32,883.82 million in 2024 and is projected to grow at a CAGR of 7.3% through the forecast period.
- Demand growth is driven by rising global tourism, organized group travel, and intercity sightseeing, with motor coaches holding 54.6% segment share due to comfort, capacity, and long-haul suitability.
- Market trends show continued reliance on conventional fleets, as ICE-powered buses account for 63.8% share, while electric and hybrid models gain traction under emission regulations and sustainability goals.
- Market structure is shaped by global manufacturers expanding electrified portfolios, localized production, and aftersales networks, while high capital costs and seasonal demand patterns remain key operational restraints.
- Regional performance highlights Europe leading with 31.4% share, followed by Asia-Pacific at 28.6% driven by domestic tourism growth, and North America at 26.8% supported by luxury and charter tour demand.
Market Segmentation Analysis:
By Vehicle:
The Tour Buses Market by vehicle type is led by motor coaches, which accounted for 54.6% market share in 2024, driven by their superior comfort, long-haul suitability, and high luggage capacity for intercity and cross-border tourism. Tour operators prefer motor coaches due to reclining seats, onboard amenities, and higher passenger revenue per trip. Minibuses held 28.1% share, supported by rising demand for small group tours and city sightseeing, while double-decker buses captured 17.3%, primarily used in urban hop-on hop-off tourism due to enhanced sightseeing visibility and advertising potential.
- For instance, MCI's J4500 model offers up to 60 passengers reclining seats with 110V outlets at each position, onboard Wi-Fi, and large underfloor storage bays for luggage on long-haul trips.
By Propulsion:
By propulsion type, ICE-powered tour buses dominated with a 63.8% market share in 2024, supported by established refueling infrastructure, lower upfront costs, and long operating range for extended tours. Fleet operators continue to rely on diesel and CNG variants for reliability across remote and cross-country routes. Electric tour buses accounted for 21.4%, driven by emission regulations, urban low-emission zones, and government incentives in Europe and Asia-Pacific. Hybrid buses held 14.8%, benefiting from fuel efficiency improvements and reduced emissions without range limitations.
By Seating Capacity:
In terms of seating capacity, above 50 seats emerged as the dominant sub-segment with a 46.9% market share in 2024, driven by high passenger throughput, lower per-seat operating costs, and suitability for mass tourism and long-distance routes. Tour operators favor large-capacity buses to maximize profitability during peak travel seasons. 31–50 seat buses accounted for 34.7%, supported by balanced capacity and route flexibility, while up to 30 seats held 18.4%, driven by luxury tours, premium travel experiences, and customized group itineraries.
- For instance, Ashok Leyland Viking Tourist Bus comes in a 41-seater variant with a 5639 mm wheelbase, featuring pushback seats and a 239 L fuel tank for extended journeys.
Key Growth Drivers
Expansion of Global Tourism and Intercity Travel
The steady expansion of global tourism and intercity travel significantly drives growth in the Tour Buses Market. Rising disposable income, increasing international tourist arrivals, and growing preference for organized group travel continue to support demand for tour buses across developed and emerging economies. Governments and tourism boards are actively promoting cultural, heritage, and eco-tourism circuits, encouraging operators to expand fleets. Long-distance sightseeing, pilgrimage travel, and cross-border tourism further boost utilization rates, positioning tour buses as a cost-effective and scalable transport solution for mass tourism activities.
- For instance, IRCTC's Buddhist Circuit Tourist Train integrates coach travel for pilgrimage sites like Bodhgaya, Rajgir, Nalanda, Sarnath, Lumbini, Kushinagar, and Sravasti, covering distances such as Delhi to Gaya (990 km) with onboard meals and hotel stays.
Rising Demand for Comfortable and Premium Travel Experiences
Growing passenger expectations for comfort, safety, and premium travel experiences are accelerating investments in modern tour bus fleets. Operators increasingly adopt vehicles with advanced seating, climate control, infotainment systems, panoramic windows, and enhanced suspension for long-haul journeys. Luxury tourism, corporate outings, and premium group travel fuel demand for high-end motor coaches. This shift toward value-added services enables operators to differentiate offerings, increase ticket pricing, and improve margins, thereby strengthening the overall revenue potential of the Tour Buses Market.
- For instance, Daimler Buses’ Setra TopClass S 516 HDH offers integrated digital infotainment via the Coach MediaRouter and upgraded suspension systems,
Infrastructure Development and Road Connectivity Improvements
Ongoing investments in highway expansion, smart road infrastructure, and cross-regional connectivity directly support the growth of the Tour Buses Market. Improved road quality reduces travel time, operating costs, and vehicle wear, encouraging operators to introduce new routes and longer itineraries. Emerging economies are prioritizing tourism-linked infrastructure projects to stimulate regional development. Enhanced connectivity between airports, urban centers, and tourist destinations increases tour bus deployment, making road-based group transportation a reliable backbone for organized travel networks.
Key Trends & Opportunities
Electrification and Low-Emission Fleet Transition
The shift toward electric and low-emission tour buses presents a strong growth opportunity for market participants. Stricter emission regulations, urban low-emission zones, and sustainability commitments from tour operators are accelerating adoption of electric and hybrid buses. Advances in battery technology, improved driving range, and expanding charging infrastructure support this transition. Manufacturers offering electric models tailored for sightseeing and intercity routes gain competitive advantage, while operators benefit from lower operating costs and improved brand positioning aligned with sustainable tourism initiatives.
- For instance, BYD introduced a pure electric sightseeing coach capable of carrying 51 seated passengers with 4 cubic meters of luggage space and achieving a range of 140-200 km in city conditions, charged in 3 hours via AC.
Growth of Customized and Themed Tour Services
Rising demand for customized, themed, and experiential travel creates new opportunities in the Tour Buses Market. Tour operators increasingly design niche offerings such as culinary tours, heritage routes, adventure tourism, and luxury sightseeing packages. Smaller group formats, flexible seating configurations, and onboard digital engagement tools support personalized travel experiences. This trend allows operators to target premium customer segments, diversify revenue streams, and improve fleet utilization beyond traditional mass tourism, especially during off-peak travel seasons.
- For instance, Heritage Express in Dubai operates interactive bus tours featuring Emirati hospitality experiences, where passengers sample traditional meals during a 4-hour journey visiting cultural landmarks like Al Fahidi Fort and Dubai Creek.
Key Challenges
High Capital Investment and Fleet Modernization Costs
High upfront capital requirements pose a major challenge in the Tour Buses Market, particularly for small and mid-sized operators. The cost of purchasing modern buses equipped with advanced safety, comfort, and emission-control technologies continues to rise. Electrification further increases investment due to battery costs and charging infrastructure needs. These financial pressures limit fleet expansion and slow technology adoption, especially in price-sensitive markets, constraining growth potential for operators with limited access to financing.
Exposure to Seasonal Demand and Economic Volatility
Seasonal fluctuations in tourism demand and sensitivity to economic conditions challenge revenue stability in the Tour Buses Market. Travel demand declines during off-peak seasons, geopolitical disruptions, or economic downturns, leading to underutilized fleets and margin pressure. Fuel price volatility further impacts operating costs and profitability. Operators must manage capacity planning carefully and diversify service offerings to mitigate these risks, as prolonged demand uncertainty can delay investment decisions and affect long-term market expansion.
Regional Analysis
North America
North America accounted for 26.8% market share in 2024 in the Tour Buses Market, driven by strong domestic tourism, national park travel, and organized intercity sightseeing across the U.S. and Canada. High demand for luxury motor coaches, chartered group travel, and senior tourism supports fleet expansion. Operators emphasize comfort, safety, and digital booking integration to enhance customer experience. Favorable road infrastructure and growing adoption of low-emission buses in urban tourist zones further strengthen regional growth. Corporate tours, sports events, and long-distance leisure travel continue to sustain stable demand throughout the year.
Europe
Europe held the 31.4% market share in 2024, supported by dense cross-border tourism, heritage travel, and well-established coach tourism networks. Strong demand for sightseeing, city tours, and intercountry travel drives consistent utilization of tour buses. Strict emission regulations accelerate adoption of electric and hybrid tour buses, particularly in Western and Northern Europe. Government support for sustainable mobility and tourism infrastructure upgrades reinforces market expansion. Countries such as Germany, France, Italy, and Spain remain core demand centers, benefiting from year-round tourist inflows and extensive road connectivity.
Asia-Pacific
Asia-Pacific captured 28.6% market share in 2024, driven by rapidly expanding domestic tourism, rising middle-class income, and government-backed tourism initiatives. High demand from countries including China, India, Japan, and Southeast Asia supports large-scale deployment of tour buses for cultural, religious, and leisure travel. Growing investments in highway infrastructure and smart cities enhance route accessibility. The region also shows accelerating adoption of electric tour buses, supported by local manufacturing capabilities and policy incentives. Increasing outbound and inbound tourism continues to strengthen long-term growth potential.
Latin America
Latin America accounted for 7.1% market share in 2024, supported by rising tourism across Brazil, Mexico, Argentina, and Chile. Growth in eco-tourism, heritage routes, and coastal travel drives demand for organized bus tours. Tour operators focus on cost-efficient ICE buses to manage operating expenses while expanding regional connectivity. Infrastructure development and public-private tourism initiatives improve access to remote destinations. Seasonal tourism patterns influence fleet utilization, but growing international arrivals and domestic travel demand steadily enhance market penetration across major tourist corridors.
Middle East & Africa
The Middle East & Africa region represented 6.1% market share in 2024, driven by religious tourism, cultural heritage travel, and large-scale tourism development projects. Demand remains strong in countries such as Saudi Arabia, UAE, Egypt, and South Africa, supported by pilgrimage travel and government-led tourism diversification programs. Investments in road infrastructure and luxury tourism buses support premium sightseeing services. Operators increasingly deploy high-capacity buses to serve large tour groups, while sustainability initiatives begin to influence fleet upgrades in major urban and tourist hubs.
Market Segmentations:
By Vehicle
- Motor coaches
- Minibuses
- Double-decker buses
By Propulsion
- ICE
- Electric
- Hybrid
By Seating Capacity
- Up to 30 seats
- 31-50 seats
- Above 50 seats
By Tour Type
- Sightseeing tours
- Day tours
- Multi-Day tours
- Adventure tours
- Educational tours
By Geography
- North America
- U.S.
- Canada
- Mexico
- Europe
- Germany
- France
- U.K.
- Italy
- Spain
- Rest of Europe
- Asia Pacific
- China
- Japan
- India
- South Korea
- South-east Asia
- Rest of Asia Pacific
- Latin America
- Brazil
- Argentina
- Rest of Latin America
- Middle East & Africa
- GCC Countries
- South Africa
- Rest of the Middle East and Africa
Competitive Landscape
Competitive landscape of the Tour Buses Market is shaped by the presence of key manufacturers such as Alexander Dennis Limited (ADL), BYD Company Limited, Daimler AG (Mercedes-Benz), Gillig Corporation, MAN Truck & Bus, Marcopolo S.A., VDL Groep, Volvo Group, Yutong Group, and Zhongtong Bus Holding Co., Ltd. These companies focus on product innovation, fleet electrification, and customization to meet diverse tour operator requirements. Leading players emphasize comfort features, safety technologies, and energy-efficient drivetrains to strengthen their market position. Strategic partnerships with tour operators, public transport authorities, and tourism boards support long-term contracts and repeat demand. Expansion of electric and hybrid portfolios, particularly in Europe and Asia-Pacific, enhances regulatory compliance and sustainability alignment. Additionally, manufacturers invest in localized production, aftersales service networks, and digital fleet management solutions to improve customer retention and operational efficiency across global markets.
Key Player Analysis
- Yutong Group
- Daimler AG (Mercedes-Benz)
- Marcopolo S.A.
- Zhongtong Bus Holding Co., Ltd.
- Volvo Group
- Gillig Corporation
- VDL Groep
- Alexander Dennis Limited (ADL)
- MAN Truck & Bus
- BYD Company Limited
Recent Developments
- In August 2025, Big Bus Tours agreed to acquire Touristation, a Rome-based tour operator offering guided tours, packages, and activities including food tours and transfers.
- In October 2025, Volvo Buses and Marcopolo entered a strategic partnership to expand their presence in the European coach market, launching a premium coach built on Volvo’s B13R chassis paired with Marcopolo’s Paradiso G8 1200 body to enhance product offerings and service networks.
- In July 2025, MAN and BYD expanded electric bus registrations in Europe, with both manufacturers increasing their share of the battery-electric bus market, reflecting growing electrification momentum among tour and commercial bus fleets.
Report Coverage
The research report offers an in-depth analysis based on Vehicle, Proplusion, Seating Capacity, Tour Type and Geography. It details leading market players, providing an overview of their business, product offerings, investments, revenue streams, and key applications. Additionally, the report includes insights into the competitive environment, SWOT analysis, current market trends, as well as the primary drivers and constraints. Furthermore, it discusses various factors that have driven market expansion in recent years. The report also explores market dynamics, regulatory scenarios, and technological advancements that are shaping the industry. It assesses the impact of external factors and global economic changes on market growth. Lastly, it provides strategic recommendations for new entrants and established companies to navigate the complexities of the market.
Future Outlook
- Tour Buses Market demand will rise steadily with sustained growth in global and domestic tourism activities.
- Fleet modernization will accelerate as operators invest in comfort, safety, and digital passenger experience features.
- Adoption of electric and hybrid tour buses will expand due to emission regulations and sustainability targets.
- Large-capacity buses will remain preferred for mass tourism and long-distance group travel routes.
- Customized and premium tour services will gain traction, supporting diversified fleet configurations.
- Infrastructure development will enable expansion of new intercity and cross-border tour routes.
- Digital booking platforms and fleet management systems will improve operational efficiency.
- Emerging economies will contribute higher growth driven by rising middle-class travel demand.
- Strategic partnerships between manufacturers and tour operators will strengthen long-term market stability.
- Aftermarket services and lifecycle support will become critical differentiators for manufacturers and operators.
Request a Free Sample
Fill in your details and we'll send you a free sample report.
- Sample data tables & charts
- Research methodology
Need a Custom Version of This Report?
Tailor the scope, geography, or segments to your exact requirements.
- Custom geography or segment scope
- Direct access to our analyst team
Frequently Asked Questions
What is the current market size for the Tour Buses Market, and what is its projected size in 2032?
At what Compound Annual Growth Rate is the Tour Buses Market projected to grow between 2024 and 2032?
Which Tour Buses Market segment held the largest share in 2024?
What are the primary factors fueling the growth of the Tour Buses Market?
Who are the leading companies in the Tour Buses Market?
Which region commanded the largest share of the Tour Buses Market in 2024?
Table of Content
Chapter 1. Report Introduction
- 1.1 Report Description & Purpose
- 1.1.1 Report Title & Market Definition
- 1.1.2 Unique Selling Propositions (USP) & Key Differentiators
- 1.1.3 Value Proposition for Stakeholders
- 1.2 Research Objectives
- 1.2.1 Market Sizing Objectives (Volume & Revenue) (Volume Where Applicable)
- 1.2.2 Segmentation Objectives
- 1.2.3 Competitive Intelligence Objectives
- 1.2.4 Forecast & Scenario Objectives
- 1.3 Report Scope
- 1.3.1 Tour Buses Scope – Segments & Subsegments Covered
- 1.3.2 Geographic Scope – Regions & Countries Covered
- 1.3.3 Historical Period, Base Year & Forecast Period (2024; forecast to 2032)
- 1.3.4 Inclusions & Exclusions
- 1.4 Industry Classification & Applicable Codes
- 1.5 Currency, Measurement Units & Valuation Basis
- 1.6 Target Stakeholders
- 1.7 Limitations & Assumptions
Chapter 2. Executive Summary
- 2.1 Global Tour Buses Market Snapshot
- 2.1.1 Market Size – Historical (2024) & Forecast (2024-2032) (2024: USD 32,883.82 million → 2032: USD 57,780.33 million)
- 2.1.2 Volume & Revenue – Global Totals (Volume Where Applicable)
- 2.1.3 Key Market Highlights – Top Five Facts
- 2.2 Tour Buses Market Segmentation Snapshot
- 2.2.1 Market Split by Region – 2024 vs. 2032
- 2.3 Competitive Snapshot
- 2.3.1 Top 10 Players by Revenue Share – 2024
- 2.3.2 Top 10 Players by Volume Share – 2024 (Volume Where Applicable)
- 2.3.3 Recent Strategic Developments (18-Month Summary)
- 2.4 Key Investment Highlights & Strategic Conclusions
Chapter 3. Tour Buses Market Dynamics & Industry Analysis
- 3.1 Market Overview & Context
- 3.1.1 Tour Buses Market Position in the Broader Industry Value Chain
- 3.1.2 Demand Structure & Purchasing Dynamics
- 3.1.3 Market Maturity & Development Stage by Region
- 3.2 Tour Buses Market Drivers
- 3.3 Tour Buses Market Restraints & Challenges
- 3.4 Tour Buses Market Opportunities
- 3.5 Porter's Five Forces Analysis
- 3.5.1 Threat of New Entrants
- 3.5.2 Bargaining Power of Suppliers
- 3.5.3 Bargaining Power of Buyers
- 3.5.4 Threat of Substitutes
- 3.5.5 Competitive Rivalry – Intensity Assessment
- 3.6 Tour Buses Value Chain Analysis
- 3.6.1 Upstream – Key Inputs, Resources & Suppliers
- 3.6.1.1 Key Input/Resource 1
- 3.6.1.2 Key Input/Resource 2
- 3.6.1.3 Key Input/Resource 3
- 3.6.2 Midstream – Core Operations & Value Creation
- 3.6.2.1 Operating Model & Process Overview
- 3.6.2.2 Key Operating Locations & Capabilities by Company
- 3.6.3 Downstream – Market Channels & End Users
- 3.6.3.1 Direct Sales & Customer Engagement Channels
- 3.6.3.2 Indirect Sales, Intermediaries & Partner Channels
- 3.6.4 Value Chain Profitability Analysis
- 3.6.1 Upstream – Key Inputs, Resources & Suppliers
- 3.7 PESTEL Analysis
- 3.7.1 Political Factors
- 3.7.2 Economic Factors
- 3.7.3 Social Factors
- 3.7.4 Technological Factors
- 3.7.5 Environmental Factors
- 3.7.6 Legal Factors
- 3.8 Tour Buses Supply Chain Analysis
- 3.8.1 Critical Input & Resource Availability Risk Assessment
- 3.8.2 Supplier & Operational Concentration Risk (Geographic Exposure)
- 3.8.3 Supply & Service Disruption Impact Analysis
- 3.9 Regulatory & Policy Landscape
Note: The regulatory and policy landscape section covers regulations based on their applicability to the market, Tour Buses category, geography, and scope of the study. Only regulatory frameworks with a material impact on operations, compliance, trade, sustainability, or market access are analyzed in detail.
Chapter 4. Key Investment Pockets & Opportunity Analysis
- 4.1 Tour Buses Market Attractiveness Analysis
- 4.1.1 By Region – Investment Attractiveness Matrix (Market Size × CAGR)
- 4.2 Absolute Revenue Growth Opportunity
- 4.2.1 By Region – Absolute Revenue Growth Through 2032
- 4.3 Incremental Demand Opportunity
- 4.3.1 By Region – Incremental Demand Through 2032
- 4.3.2 Segment – Incremental Demand
- 4.4 Emerging Submarket Opportunity Deep Dive (Subject to Applicability)
- 4.5 Priority Market Opportunity Scorecards
- 4.5.1 United States
- 4.5.2 Europe
- 4.5.3 Asia
- 4.5.4 Middle East & Africa
Note: Priority market opportunity scorecards reflect the geographic scope and strategic relevance of the study. Listed markets are indicative and may be adapted to the industry.
Chapter 5. Tour Buses Cross-Border Trade & Market Access Analysis
- 5.1 International Trade & Cross-Border Activity Overview
- 5.1.1 Global Export Value by Country (2024)
- 5.1.2 Global Export Volume by Country (2024) (Volume Where Applicable)
- 5.1.3 Global Import Value by Country (2024)
- 5.1.4 Global Import Volume by Country (2024) (Volume Where Applicable)
- 5.1.5 Net Trade Balance by Country (2024)
- 5.2 Export Analysis – Segment
- 5.2.1 Category 1 (Applicable Classification Code)
- 5.2.2 Category 2 (Applicable Classification Code)
- 5.2.3 Category 3 (Applicable Classification Code)
- 5.2.4 Category 4 (Applicable Classification Code)
- 5.2.5 Category 5 (Applicable Classification Code)
- 5.3 Import Analysis – Segment
- 5.3.1 Category 1 (Applicable Classification Code)
- 5.3.2 Category 2 (Applicable Classification Code)
- 5.3.3 Category 3 (Applicable Classification Code)
- 5.3.4 Category 4 (Applicable Classification Code)
- 5.3.5 Category 5 (Applicable Classification Code)
- 5.4 Cross-Border Pricing & Transaction Benchmarks
- 5.4.1 Export Pricing – Segment & Country
- 5.4.2 Import Pricing – Segment & Source Country
- 5.4.3 Price Trends (2024)
- 5.5 Key Cross-Border Trade & Delivery Routes
- 5.5.1 Cross-Border Trade/Delivery Route 1
- 5.5.2 Cross-Border Trade/Delivery Route 2
- 5.5.3 Cross-Border Trade/Delivery Route 3
- 5.5.4 Cross-Border Trade/Delivery Route 4
- 5.5.5 Cross-Border Trade/Delivery Route 5
- 5.6 Trade Policy & Market Access Impact Assessment
- 5.6.1 Tariff & Non-Tariff Barriers
- 5.6.2 Regional Trade & Economic Integration Frameworks
- 5.6.3 Bilateral & Multilateral Trade Agreements
- 5.6.4 Cross-Border Operating, Licensing & Localization Requirements
Note: This chapter applies where cross-border trade or delivery is relevant to Tour Buses. Goods, services, and digital offerings are assessed using applicable classifications and transaction measures. Import-export volumes, trade balances, and route analyses are included only where meaningful to the market.
Chapter 6. Competitive Landscape & Company Benchmarking
- 6.1 Tour Buses Market Concentration & Structure
- 6.1.1 Herfindahl-Hirschman Index (HHI) – vs. 2024
- 6.1.2 Leading, Mid-Sized & Emerging Player Structure
- 6.1.3 Global, Regional & Local Player Dynamics
- 6.2 Tour Buses Market Share Analysis – 2024
- 6.2.1 Global Revenue Share by Company
- 6.2.2 Global Volume Share by Company (Volume Where Applicable)
- 6.2.3 Regional Revenue Share
- 6.2.4 Market Share Evolution ( vs. 2024)
- 6.2.5 Company Market Share by Key Segment
- 6.2.6 Company Market Share by Customer Group
- 6.3 Operating Scale, Capacity & Infrastructure Analysis
- 6.3.1 Global Operating Scale & Supply Capacity
- 6.3.2 Resource Utilization & Operating Efficiency
- 6.3.3 Output, Service Delivery & Activity Metrics
- 6.3.4 Operating Footprint & Infrastructure Map
- 6.3.5 Planned Operational & Capacity Expansion
- 6.4 Tour Buses Competitive Benchmarking Matrix
- 6.4.1 Revenue, Growth, Profitability & Operating Metric Comparison
- 6.4.2 Channel Revenue Mix
- 6.4.3 Geographic Revenue Exposure
- 6.4.4 R&D Intensity
- 6.4.5 Sustainability Maturity
- 6.5 Strategic Developments in Tour Buses (Last 24 Months)
- 6.5.1 Mergers, Acquisitions & Divestments
- 6.5.2 New Products, Services & Solutions in Tour Buses
- 6.5.3 Operational & Infrastructure Expansions
- 6.5.4 Strategic Alliances, Joint Ventures & Partnerships
- 6.5.5 Distribution Expansion & Market Entry
- 6.5.6 Sustainability & ESG Initiatives
- 6.6 Competitive Strategy Mapping
- 6.6.1 Leader, Challenger, Follower & Niche Classification
- 6.6.2 Pricing Strategy Comparison
- 6.6.3 Channel Strategy Matrix
Note: Strategic developments are included based on their materiality and the availability of reliable information.
Chapter 7. Global Tour Buses Market – By Sales & Delivery Channel
- 7.1 Segment Overview
- 7.1.1 Volume & Revenue Split by Channel (2024 & 2032) (Volume Where Applicable)
- 7.1.2 Channel Mix Evolution (2024-2032)
Chapter 8. Regional Market Analysis – Global Overview
- 8.1 Global Regional Overview
- 8.1.1 Regional Volume Share (Volume Where Applicable)
- 8.1.2 Regional Revenue Share
- 8.1.3 Regional Volume by Region (Volume Where Applicable)
- 8.1.4 Regional Revenue by Region
- 8.1.5 Regional Forecast Through 2032
- 8.2 Cross-Regional Segment Analysis
- 8.2.1 By Sales & Delivery Channel
- 8.2.2 By Competitive Positioning & Price Tier
Chapter 9. North America Tour Buses Market
- 9.1 United States
- 9.2 Canada
- 9.3 Mexico
Chapter 10. Europe Tour Buses Market
- 10.1 Germany
- 10.2 France
- 10.3 Italy
- 10.4 United Kingdom
- 10.5 Spain
- 10.6 Poland
- 10.7 Russia
- 10.8 Netherlands
- 10.9 Belgium
- 10.10 Sweden
- 10.11 Denmark
- 10.12 Norway
- 10.13 Rest of Europe
Chapter 11. Asia Pacific Tour Buses Market
- 11.1 China
- 11.2 India
- 11.3 Japan
- 11.4 South Korea
- 11.5 Thailand
- 11.6 Indonesia
- 11.7 Vietnam
- 11.8 Malaysia
- 11.9 Australia
- 11.10 Rest of Asia Pacific
Chapter 12. Latin America Tour Buses Market
- 12.1 Brazil
- 12.2 Argentina
- 12.3 Colombia
- 12.4 Chile
- 12.5 Rest of Latin America
Chapter 13. Middle East Tour Buses Market
- 13.1 Saudi Arabia
- 13.2 United Arab Emirates
- 13.3 Turkey
- 13.4 Israel
- 13.5 Iran
- 13.6 Rest of the Middle East
Chapter 14. Africa Tour Buses Market
- 14.1 South Africa
- 14.2 Egypt
- 14.3 Nigeria
- 14.4 Morocco
- 14.5 Rest of Africa
Chapter 15. Tour Buses Company Profiles
- 15.1 [Company 01]
- 15.1.1 Company Overview
- 15.1.2 Key Management Personnel
- 15.1.3 Products & Services Portfolio
- 15.1.4 Financial Performance
- 15.1.5 Key Market Focus & Geographic Presence
- 15.1.6 Recent Developments & Strategic Initiatives
Note: The company profile list is preliminary and may change based on research findings, market developments, data availability, and client requirements.
Chapter 16. Appendices
- Appendix A – List of Abbreviations & Acronyms
- Appendix B – Industry Classification Code Reference – Full Series
- Appendix C – Supply, Output & Operating Capacity Data Tables
- Appendix D – End-Use & Demand Base Tables
- Appendix E – Demand, Adoption & Usage Assumptions
- Appendix F – Pricing & Revenue Metric Reference Tables
- Appendix G – Company Operations & Infrastructure Database
- Appendix H – Cross-Border Trade & Activity Data Tables (Where Applicable)
- Appendix I – Regulatory Summary Tables
- Appendix J – Primary Research Participant List (Anonymized)
- Appendix K – Primary Research Questionnaire Framework
- Appendix L – Data Sources & Bibliography
- Appendix M – Market Size Divergence & Source Comparison
Chapter 17. Research Methodology
- 17.1 Research Framework & Philosophy
- 17.2 Secondary Research – Sources, Hierarchy & Data Extraction
- 17.3 Data Modeling – Bottom-Up & Top-Down Market Sizing
- 17.4 Primary Research – Stakeholder Framework, LOI & Sample Sizes
- 17.5 Forecast Methodology – Regression, Scenario & Sensitivity Analysis
- 17.6 Quality Control – Four-Layer Validation Framework
- 17.7 Limitations & Standard Assumptions
- 17.8 Disclaimer
