
Market Overview
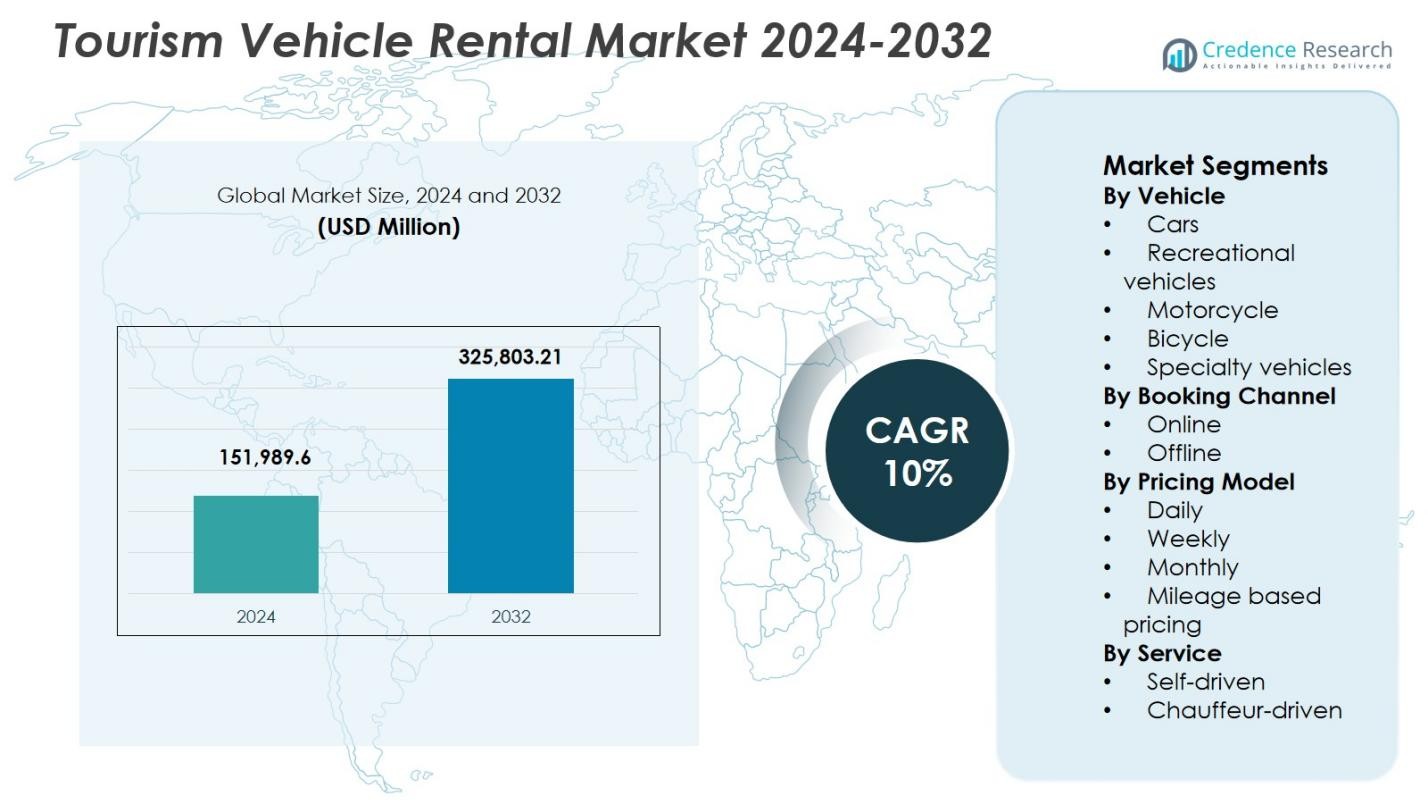
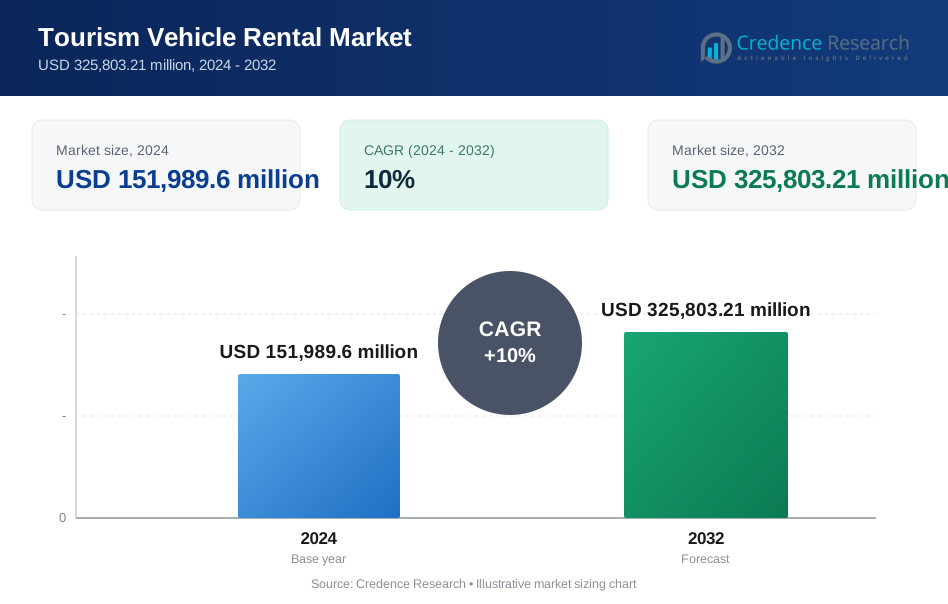
Tourism Vehicle Rental Market size was valued at USD 151,989.6 million in 2024 and is anticipated to reach USD 325,803.21 million by 2032, growing at a CAGR of 10% during the forecast period.
| REPORT ATTRIBUTE | DETAILS |
|---|---|
| Historical Period | 2020-2023 |
| Base Year | 2024 |
| Forecast Period | 2025-2032 |
| Tourism Vehicle Rental Market Size 2024 | USD 151,989.6 Million |
| Tourism Vehicle Rental Market, CAGR | 10% |
| Tourism Vehicle Rental Market Size 2032 | USD 325,803.21 Million |
Tourism Vehicle Rental Market is driven by the strong presence of established global rental operators and digital travel platforms that focus on fleet scale, geographic reach, and technology-enabled services. Key players such as Enterprise Rent-A-Car, Avis Budget Group, Hertz Global Holdings, Europcar Mobility Group, Sixt SE, Booking.com, Expedia, and CarTrawler strengthen market expansion through extensive airport networks, online booking integration, and diversified vehicle offerings. These companies emphasize self-drive rentals, flexible pricing models, and digital customer engagement to capture rising tourism demand. Regionally, North America leads the Tourism Vehicle Rental Market with 34.8% market share, supported by high travel volumes, mature road infrastructure, and strong adoption of online rentals, followed by Europe and Asia-Pacific, which benefit from cross-border tourism and rapid growth in domestic travel demand.
Market Insights
- Tourism Vehicle Rental Market was valued at USD 151,989.6 million in 2024 and is projected to grow at a CAGR of 10% through the forecast period, driven by rising global tourism and increasing preference for flexible mobility solutions.
- Growing domestic and international travel, higher disposable incomes, and expanding airport infrastructure continue to drive demand for rental vehicles, with self-driven services gaining strong traction among leisure and group travelers.
- Digital booking platforms dominate market trends, supported by mobile apps, real-time availability, dynamic pricing, and integration with travel and hospitality ecosystems, while electric and hybrid vehicle adoption is steadily increasing.
- The cars segment leads the market with 6% share, supported by affordability and wide availability, while online booking channels hold 68.3% share due to convenience and transparency; high fleet costs and regulatory compliance remain key restraints.
- North America leads with 8% market share, followed by Europe at 27.6% and Asia-Pacific at 24.1%, with emerging regions benefiting from tourism promotion, infrastructure development, and rising digital penetration.
Market Segmentation Analysis:
By Vehicle:
The Tourism Vehicle Rental Market by vehicle is led by Cars, which accounted for 52.6% market share in 2024. Cars dominate due to their affordability, ease of driving, and suitability for both short-distance city travel and long-distance tourism. Strong demand from leisure travelers, families, and business tourists supports segment leadership. High availability across rental fleets, fuel-efficient models, and increasing adoption of electric and hybrid cars further strengthen growth. Recreational vehicles follow, driven by road-trip tourism, while motorcycles, bicycles, and specialty vehicles cater to niche adventure, eco-tourism, and experiential travel segments.
- For instance, Enterprise Rent-A-Car introduced hybrid variants of the Toyota Corolla and RAV4 in its European fleet to support eco-friendly mobility for tourists.
By Booking Channel:
The Tourism Vehicle Rental Market by booking channel is dominated by Online booking, holding 68.3% market share in 2024. Online platforms lead due to convenience, real-time vehicle availability, transparent pricing, and integrated travel services such as flights and hotels. Mobile apps, digital payments, and loyalty programs further accelerate adoption. Strong presence of global aggregators and rental platforms enhances price comparison and customer reach. Offline booking continues to serve walk-in customers and local operators, particularly in emerging destinations, but limited scalability and manual processes constrain faster growth.
- For instance, Booking.com provides real-time car availability from over 200 suppliers at 45,000 locations in 144 countries, enabling instant bookings with filters for insurance and vehicle types.
By Pricing Model:
The Tourism Vehicle Rental Market by pricing model is led by Daily pricing, which captured 46.9% market share in 2024. Daily pricing remains dominant due to high demand for short-term rentals driven by weekend trips, city tours, and airport-based rentals. Flexibility, predictable costs, and widespread consumer familiarity support its leadership. Weekly and monthly pricing models gain traction among long-stay tourists and digital nomads, while mileage-based pricing appeals to cost-sensitive travelers seeking usage-based value, particularly in urban sightseeing and short-distance travel scenarios.
Key Growth Drivers
Expansion of Global Tourism and Travel Activity
The Tourism Vehicle Rental Market is strongly supported by the continuous expansion of global tourism. Rising disposable incomes, increasing international arrivals, and growth in domestic travel significantly increase demand for rental vehicles. Tourists seek convenient and flexible transportation to explore destinations beyond major transit hubs. Government initiatives promoting tourism, improved airport infrastructure, and development of road networks further stimulate market growth. Growth in leisure, cultural, and adventure tourism also boosts demand for diverse rental vehicle types, supporting sustained market expansion across multiple regions.
- For instance, Sixt opened a new car rental branch at Kona International Airport in Hawaii in April 2024, offering compact cars, SUVs, and luxury vehicles via a dedicated shuttle to serve the airport's nearly 5 million annual passengers exploring the Big Island's resorts and landmarks.
Shift Toward Flexible and Self-Driven Mobility
The growing preference for self-driven travel is a major driver for the Tourism Vehicle Rental Market. Travelers increasingly favor private vehicles to gain flexibility, control over travel schedules, and enhanced comfort. Self-drive rentals reduce dependency on public transportation and organized tours, particularly for families and group travelers. Increasing awareness of safety and hygiene standards further strengthens adoption. The availability of short-term and long-term rental options, along with diverse vehicle fleets, continues to support strong market demand.
Digitalization of Rental Platforms and Booking Systems
Rapid digital transformation across the travel ecosystem significantly drives the Tourism Vehicle Rental Market. Online booking platforms enable seamless vehicle selection, real-time availability, and transparent pricing, enhancing customer experience. Integration with travel apps, digital payments, and loyalty programs increases booking efficiency and repeat usage. Advanced data analytics and dynamic pricing tools allow operators to optimize fleet utilization and revenue. The widespread adoption of smartphones and mobile apps further accelerates digital bookings, strengthening market growth.
- For instance, Turo rolled out its Book Instantly feature platform-wide starting in early 2024, automatically approving trips without manual host intervention.
Key Trends & Opportunities
Growth of Electric and Sustainable Rental Vehicles
Sustainability trends create strong opportunities within the Tourism Vehicle Rental Market. Rental companies increasingly incorporate electric and hybrid vehicles to meet environmental regulations and changing traveler preferences. Tourists show growing interest in low-emission transportation options, particularly in environmentally conscious destinations. Government incentives for electric vehicles and expanding charging infrastructure further support adoption. Sustainable fleets enhance brand positioning while reducing operating costs, creating long-term growth opportunities for rental operators.
- For instance, Green Circle Experience provides fully electric SUVs with at least 400 km range for tourists exploring Costa Rica, charged free at member hotels using 100% renewable energy. Each personalized vehicle supports local social or environmental projects through rental profits.
Rising Demand for Long-Term and Subscription-Based Rentals
Long-term rentals and subscription-based pricing models represent a key opportunity in the Tourism Vehicle Rental Market. Digital nomads, extended-stay tourists, and remote workers increasingly seek flexible monthly rental options. These models provide predictable revenue streams for operators and cost advantages for customers. Customizable packages, bundled services, and mileage-inclusive plans improve customer retention. The shift toward longer travel durations supports expansion beyond traditional short-term rental demand.
- For instance, Mahindra offers SUV subscription and leasing plans with flexible tenures from one to four years, including insurance, maintenance, and the option to upgrade models or buy back at a pre-determined price after the minimum period.
Key Challenges
High Fleet Management and Maintenance Costs
Fleet acquisition, maintenance, and depreciation present significant challenges for the Tourism Vehicle Rental Market. Rising vehicle prices, fuel costs, and maintenance expenses increase operational burdens for rental providers. Managing diverse fleets across multiple locations adds logistical complexity. Fluctuating demand patterns can lead to underutilization during off-peak seasons, impacting profitability. Effective fleet optimization and cost control remain critical to maintaining sustainable margins.
Regulatory Compliance and Intense Competitive Pressure
Regulatory requirements and competitive intensity pose challenges for the Tourism Vehicle Rental Market. Compliance with local licensing, insurance mandates, and environmental regulations increases operational complexity. Regulations vary across regions, creating barriers for expansion. Additionally, strong competition from global rental brands, local operators, and peer-to-peer platforms pressures pricing and margins. Differentiation through service quality, technology adoption, and fleet innovation is essential to sustain competitive positioning.
Regional Analysis
North America
North America holds a leading position in the Tourism Vehicle Rental Market, accounting for 34.8% market share in 2024. Strong tourism inflows, high vehicle ownership familiarity, and well-developed road infrastructure drive sustained demand. The region benefits from a high penetration of online booking platforms, extensive airport-based rental networks, and strong preference for self-driven travel. Demand for cars and recreational vehicles remains high, supported by road trips, national park tourism, and cross-state travel. Favorable insurance frameworks and a strong presence of organized rental operators further reinforce regional market leadership.
Europe
Europe represents a significant share of the Tourism Vehicle Rental Market with 27.6% market share in 2024. High international tourist arrivals, cross-border travel, and dense urban connectivity support consistent rental demand. Strong adoption of compact cars, electric vehicles, and short-term rentals reflects regional sustainability priorities and regulatory frameworks. Well-established rail and air networks complement vehicle rentals for last-mile and regional mobility. Growth in leisure travel, cultural tourism, and scenic road trips across Western and Southern Europe continues to support steady market expansion.
Asia-Pacific
Asia-Pacific accounts for 24.1% market share in 2024, driven by rapid tourism growth and expanding middle-class populations. Rising domestic travel in countries such as China, India, Japan, and Southeast Asia fuels strong demand for affordable rental vehicles. Improving road infrastructure, digital payment adoption, and increasing smartphone penetration accelerate online bookings. Tourists increasingly prefer self-drive options for flexibility in emerging destinations. The region also benefits from growing low-cost airline connectivity and government initiatives promoting tourism, supporting long-term market growth.
Latin America
Latin America holds 8.2% market share in 2024 within the Tourism Vehicle Rental Market. Growth is supported by increasing international tourism, especially in destinations such as Mexico, Brazil, and the Caribbean. Demand is driven by airport-based rentals, leisure travel, and expanding urban tourism. Improving digital booking platforms and partnerships with travel aggregators enhance accessibility. However, market growth remains influenced by infrastructure development and economic stability. Rising interest in regional road travel and adventure tourism continues to create opportunities for rental providers.
Middle East & Africa
The Middle East & Africa region accounts for 5.3% market share in 2024. Growth is driven by rising tourism investments, large-scale events, and luxury travel demand, particularly in the Gulf countries. Strong airport infrastructure and high demand for premium and specialty vehicles support market expansion. In Africa, growing eco-tourism and safari travel increase demand for specialty and off-road rentals. Government-led tourism diversification strategies and infrastructure upgrades continue to strengthen the region’s role in the global market.
Market Segmentations:
By Vehicle
- Cars
- Recreational vehicles
- Motorcycle
- Bicycle
- Specialty vehicles
By Booking Channel
- Online
- Offline
By Pricing Model
- Daily
- Weekly
- Monthly
- Mileage based pricing
By Service
- Self-driven
- Chauffeur-driven
By Geography
- North America
- U.S.
- Canada
- Mexico
- Europe
- Germany
- France
- U.K.
- Italy
- Spain
- Rest of Europe
- Asia Pacific
- China
- Japan
- India
- South Korea
- South-east Asia
- Rest of Asia Pacific
- Latin America
- Brazil
- Argentina
- Rest of Latin America
- Middle East & Africa
- GCC Countries
- South Africa
- Rest of the Middle East and Africa
Competitive Landscape
The Tourism Vehicle Rental Market features a diverse mix of global brands, regional operators, and digital travel platforms, including Enterprise Rent-A-Car, Avis Budget Group, Hertz Global Holdings, Europcar Mobility Group, Sixt SE, Booking Holdings, Expedia Group, and CarTrawler. The market emphasizes scale, fleet diversity, geographic reach, and digital capabilities as core differentiators. Leading players focus on expanding airport and urban presence, strengthening online booking ecosystems, and optimizing fleet utilization through data-driven pricing and demand forecasting. Strategic partnerships with airlines, hotels, and travel aggregators enhance customer acquisition and cross-selling opportunities. Operators increasingly invest in electric and hybrid vehicles to meet regulatory and sustainability requirements while improving brand positioning. Technology-driven enhancements such as mobile apps, contactless rentals, and subscription-based models further intensify competition. Smaller regional players compete through localized services, flexible pricing, and niche vehicle offerings, sustaining a dynamic and highly fragmented market structure.
Key Player Analysis
- Booking.com
- Budget Rent A Car
- CarTrawler
- Cruise America
- Dollar Rent A Car
- Enterprise Rent-A-Car
- Alamo
- Avis
- Europcar
- Expedia
Recent Developments
- In December 2025, Ryde announced a strategic expansion into the electric vehicle rental market through partnerships with Guan Chao Holdings and Singapore Electric Vehicles, targeting a fleet of up to 400 EVs over the next six months.
- In October 2025, AMP launched India's first premium electric vehicle subscription platform, offering access to luxury EVs from BMW, Mercedes, BYD, Audi, and Volvo for salaried professionals without ownership commitments.
- In December 2025, Enterprise Mobility completed the acquisition of Hogan, a well-established U.S. commercial transportation services provider, expanding its mobility portfolio and service reach in the Tourism Vehicle Rental Market.
Report Coverage
The research report offers an in-depth analysis based on Vehicle, Booking Channel, Pricing Model, Service and Geography. It details leading market players, providing an overview of their business, product offerings, investments, revenue streams, and key applications. Additionally, the report includes insights into the competitive environment, SWOT analysis, current market trends, as well as the primary drivers and constraints. Furthermore, it discusses various factors that have driven market expansion in recent years. The report also explores market dynamics, regulatory scenarios, and technological advancements that are shaping the industry. It assesses the impact of external factors and global economic changes on market growth. Lastly, it provides strategic recommendations for new entrants and established companies to navigate the complexities of the market.
Future Outlook
- The Tourism Vehicle Rental Market will expand steadily with rising domestic and international tourism activity across key regions.
- Digital booking platforms will continue to dominate as travelers prioritize convenience, transparency, and real-time availability.
- Demand for self-drive rentals will strengthen as travelers seek flexibility, privacy, and personalized travel experiences.
- Electric and hybrid vehicles will gain wider adoption driven by sustainability goals and regulatory support.
- Long-term and subscription-based rental models will grow with increasing extended stays and remote work travel.
- Fleet diversification will increase to address demand for recreational, specialty, and adventure-oriented vehicles.
- Integration with airlines, hotels, and travel platforms will enhance customer reach and booking efficiency.
- Advanced analytics and dynamic pricing will improve fleet utilization and revenue management.
- Emerging markets will contribute higher growth supported by infrastructure development and tourism promotion.
- Service differentiation through contactless rentals and enhanced customer experience will shape competitive positioning.
Request a Free Sample
Fill in your details and we'll send you a free sample report.
- Sample data tables & charts
- Research methodology
Need a Custom Version of This Report?
Tailor the scope, geography, or segments to your exact requirements.
- Custom geography or segment scope
- Direct access to our analyst team
Frequently Asked Questions
What is the current market size for the Tourism Vehicle Rental Market, and what is its projected size in 2032?
At what Compound Annual Growth Rate is the Tourism Vehicle Rental Market projected to grow between 2024 and 2032?
Which Tourism Vehicle Rental Market segment held the largest share in 2024?
What are the primary factors fueling the growth of the Tourism Vehicle Rental Market?
Who are the leading companies in the Tourism Vehicle Rental Market?
Which region commanded the largest share of the Tourism Vehicle Rental Market in 2024?
Table of Content
Chapter 1. Report Introduction
- 1.1 Report Description & Purpose
- 1.1.1 Report Title & Market Definition
- 1.1.2 Unique Selling Propositions (USP) & Key Differentiators
- 1.1.3 Value Proposition for Stakeholders
- 1.2 Research Objectives
- 1.2.1 Market Sizing Objectives (Volume & Revenue)
- 1.2.2 Segmentation Objectives
- 1.2.3 Competitive Intelligence Objectives
- 1.2.4 Forecast & Scenario Objectives
- 1.3 Report Scope
- 1.3.1 Tourism Vehicle Rental Scope – Types & Subtypes Covered
- 1.3.2 Geographic Scope – Regions & Countries Covered
- 1.3.3 Historical Period, Base Year & Forecast Period (2024; forecast to 2032)
- 1.3.4 Inclusions & Exclusions
- 1.4 HS Code & Classification Framework
- 1.5 Currency, Units & Pricing Basis
- 1.6 Target Stakeholders
- 1.7 Limitations & Assumptions
Chapter 2. Executive Summary
- 2.1 Global Tourism Vehicle Rental Market Snapshot
- 2.1.1 Market Size – Historical (2024) & Forecast (2024-2032) (2024: USD 151,989.6 million → 2032: USD 325,803.21 million)
- 2.1.2 Volume & Revenue – Global Totals
- 2.1.3 Key Market Highlights – Top Five Facts
- 2.2 Tourism Vehicle Rental Market Segmentation Snapshot
- 2.2.1 Market Split by Region – 2024 vs. 2032
- 2.3 Competitive Snapshot
- 2.3.1 Top 10 Players by Revenue Share – 2024
- 2.3.2 Top 10 Players by Volume Share – 2024
- 2.3.3 Recent Strategic Developments (18-Month Summary)
- 2.4 Key Investment Highlights & Strategic Conclusions
Chapter 3. Tourism Vehicle Rental Market Dynamics & Industry Analysis
- 3.1 Market Overview & Context
- 3.1.1 Tourism Vehicle Rental Market Position in the Broader Automotive Value Chain
- 3.1.2 OEM vs. Replacement Market Dynamics
- 3.1.3 Market Maturity & Development Stage by Region
- 3.2 Tourism Vehicle Rental Market Drivers
- 3.3 Tourism Vehicle Rental Market Restraints & Challenges
- 3.4 Tourism Vehicle Rental Market Opportunities
- 3.5 Porter's Five Forces Analysis
- 3.5.1 Threat of New Entrants
- 3.5.2 Bargaining Power of Suppliers
- 3.5.3 Bargaining Power of Buyers
- 3.5.4 Threat of Substitutes
- 3.5.5 Competitive Rivalry – Intensity Assessment
- 3.6 Tourism Vehicle Rental Value Chain Analysis
- 3.6.1 Upstream – Raw Material/Input Suppliers
- 3.6.1.1 Raw Material/Input 1
- 3.6.1.2 Raw Material/Input 2
- 3.6.1.3 Raw Material/Input 3
- 3.6.2 Midstream – Production/Manufacturing/Service Delivery
- 3.6.2.1 Production/Process Overview
- 3.6.2.2 Key Facility Locations & Capacity by Manufacturer
- 3.6.3 Downstream – Distribution & End Consumer
- 3.6.3.1 Primary Channel – B2B/OEM
- 3.6.3.2 Secondary Channels – Dealer, Retail, Online, Direct
- 3.6.4 Value Chain Profitability Analysis
- 3.6.1 Upstream – Raw Material/Input Suppliers
- 3.7 PESTEL Analysis
- 3.7.1 Political Factors
- 3.7.2 Economic Factors
- 3.7.3 Social Factors
- 3.7.4 Technological Factors
- 3.7.5 Environmental Factors
- 3.7.6 Legal Factors
- 3.8 Tourism Vehicle Rental Supply Chain Analysis
- 3.8.1 Raw Material/Input Supply Risk Assessment
- 3.8.2 Manufacturing Concentration Risk (Geographic Exposure)
- 3.8.3 Trade Disruption Impact Analysis
- 3.9 Regulatory & Policy Landscape
Note: The regulatory and policy landscape section covers regulations based on their applicability to the market, Tourism Vehicle Rental category, geography, and scope of the study. Only regulatory frameworks with a material impact on operations, compliance, trade, sustainability, or market access are analyzed in detail.
Chapter 4. Key Investment Pockets & Opportunity Analysis
- 4.1 Tourism Vehicle Rental Market Attractiveness Analysis
- 4.1.1 By Region – Investment Attractiveness Matrix (Volume × CAGR)
- 4.2 Absolute Revenue Growth Opportunity
- 4.2.1 By Region – Absolute USD Growth Through 2032
- 4.3 Incremental Volume Opportunity
- 4.3.1 By Region – Incremental Volume Through 2032
- 4.3.2 Segment – Incremental Volume
- 4.4 Emerging Submarket Opportunity Deep Dive (Subject to Applicability)
- 4.5 Emerging Market Opportunity Scorecards
- 4.5.1 United States
- 4.5.2 Europe
- 4.5.3 Asia
- 4.5.4 Middle East & Africa
Note: Emerging Market Opportunity Scorecards will be included based on relevance and strategic importance. Regions listed are indicative and may vary depending on data availability and market dynamics.
Chapter 5. Tourism Vehicle Rental Import-Export Analysis & Trade Flows
- 5.1 Global Trade Overview
- 5.1.1 Global Export Value by Country (2024)
- 5.1.2 Global Export Volume by Country (2024)
- 5.1.3 Global Import Value by Country (2024)
- 5.1.4 Global Import Volume by Country (2024)
- 5.1.5 Net Trade Balance by Country (2024)
- 5.2 Export Analysis – Segment
- 5.2.1 Type 1 (HS Code)
- 5.2.2 Type 2 (HS Code)
- 5.2.3 Type 3 (HS Code)
- 5.2.4 Type 4 (HS Code)
- 5.2.5 Type 5 (HS Code)
- 5.3 Import Analysis – Segment
- 5.3.1 Type 1 (HS Code)
- 5.3.2 Type 2 (HS Code)
- 5.3.3 Type 3 (HS Code)
- 5.3.4 Type 4 (HS Code)
- 5.3.5 Type 5 (HS Code)
- 5.4 Average Unit Trade Prices
- 5.4.1 Average Export Price – Segment & Country
- 5.4.2 Average Import Price – Segment & Source Country
- 5.4.3 Price Trends (2024)
- 5.5 Key Trade Route Analysis
- 5.5.1 Trade Route 1
- 5.5.2 Trade Route 2
- 5.5.3 Trade Route 3
- 5.5.4 Trade Route 4
- 5.5.5 Trade Route 5
- 5.6 Trade Policy Impact Assessment
- 5.6.1 US Anti-Dumping & Section 301 Tariffs
- 5.6.2 EU Customs Union Impact
- 5.6.3 Major Free Trade Agreements
- 5.6.4 USMCA Rules of Origin
Note: Trade policy analysis will be included only where relevant to the Tourism Vehicle Rental market.
Chapter 6. Competitive Landscape & Company Benchmarking
- 6.1 Tourism Vehicle Rental Market Concentration & Structure
- 6.1.1 Herfindahl-Hirschman Index (HHI) – vs. 2024
- 6.1.2 Tier 1, Tier 2 & Tier 3 Market Structure
- 6.1.3 Global, Regional & Local Player Dynamics
- 6.2 Tourism Vehicle Rental Market Share Analysis – 2024
- 6.2.1 Global Revenue Share by Company
- 6.2.2 Global Volume Share by Company
- 6.2.3 Regional Revenue Share
- 6.2.4 Market Share Evolution ( vs. 2024)
- 6.2.5 OEM Segment Share by Company
- 6.2.6 Replacement Segment Share by Company
- 6.3 Production/Delivery Capacity & Facility Analysis
- 6.3.1 Global Installed Capacity
- 6.3.2 Capacity Utilization Rates
- 6.3.3 Production/Output Volume
- 6.3.4 Facility Locations & Capacity Map
- 6.3.5 Planned Capacity Additions
- 6.4 Tourism Vehicle Rental Competitive Benchmarking Matrix
- 6.4.1 Revenue, Volume, CAGR & Profitability Comparison
- 6.4.2 Channel Revenue Mix
- 6.4.3 Geographic Revenue Exposure
- 6.4.4 R&D Intensity
- 6.4.5 Sustainability Maturity
- 6.5 Strategic Developments in Tourism Vehicle Rental (Last 24 Months)
- 6.5.1 Mergers, Acquisitions & Divestments
- 6.5.2 New Tourism Vehicle Rental Launches
- 6.5.3 Facility Expansions
- 6.5.4 Strategic Alliances, Joint Ventures & Partnerships
- 6.5.5 Distribution Expansion & Market Entry
- 6.5.6 Sustainability & ESG Initiatives
- 6.6 Competitive Strategy Mapping
- 6.6.1 Leader, Challenger, Follower & Niche Classification
- 6.6.2 Pricing Strategy Comparison
- 6.6.3 Channel Strategy Matrix
Note: Strategic developments are included based on their materiality and the availability of reliable information.
Chapter 7. Global Tourism Vehicle Rental Market – By Distribution Channel
- 7.1 Segment Overview
- 7.1.1 Volume & Revenue Split by Channel (2024 & 2032)
- 7.1.2 Channel Mix Evolution (2024-2032)
Chapter 8. Regional Market Analysis – Global Overview
- 8.1 Global Regional Overview
- 8.1.1 Regional Volume Share
- 8.1.2 Regional Revenue Share
- 8.1.3 Regional Volume by Region
- 8.1.4 Regional Revenue by Region
- 8.1.5 Regional Forecast Through 2032
- 8.2 Cross-Regional Segment Analysis
- 8.2.1 By Distribution Channel
- 8.2.2 By Brand/Price Tier
Chapter 9. North America Tourism Vehicle Rental Market
- 9.1 United States
- 9.2 Canada
- 9.3 Mexico
Chapter 10. Europe Tourism Vehicle Rental Market
- 10.1 Germany
- 10.2 France
- 10.3 Italy
- 10.4 United Kingdom
- 10.5 Spain
- 10.6 Poland
- 10.7 Russia
- 10.8 Netherlands
- 10.9 Belgium
- 10.10 Sweden
- 10.11 Denmark
- 10.12 Norway
- 10.13 Rest of Europe
Chapter 11. Asia Pacific Tourism Vehicle Rental Market
- 11.1 China
- 11.2 India
- 11.3 Japan
- 11.4 South Korea
- 11.5 Thailand
- 11.6 Indonesia
- 11.7 Vietnam
- 11.8 Malaysia
- 11.9 Australia
- 11.10 Rest of Asia Pacific
Chapter 12. Latin America Tourism Vehicle Rental Market
- 12.1 Brazil
- 12.2 Argentina
- 12.3 Colombia
- 12.4 Chile
- 12.5 Rest of Latin America
Chapter 13. Middle East Tourism Vehicle Rental Market
- 13.1 Saudi Arabia
- 13.2 United Arab Emirates
- 13.3 Turkey
- 13.4 Israel
- 13.5 Iran
- 13.6 Rest of the Middle East
Chapter 14. Africa Tourism Vehicle Rental Market
- 14.1 South Africa
- 14.2 Egypt
- 14.3 Nigeria
- 14.4 Morocco
- 14.5 Rest of Africa
Chapter 15. Tourism Vehicle Rental Company Profiles
- 15.1 [Company 01]
- 15.1.1 Company Overview
- 15.1.2 Key Management Personnel
- 15.1.3 Products & Services Portfolio
- 15.1.4 Financial Performance
- 15.1.5 Key Market Focus & Geographic Presence
- 15.1.6 Recent Developments & Strategic Initiatives
Note: The company profile list is preliminary and may change based on research findings, market developments, data availability, and client requirements.
Chapter 16. Appendices
- Appendix A – List of Abbreviations & Acronyms
- Appendix B – Industry Classification Code Reference – Full Series
- Appendix C – Production & Capacity Data Tables
- Appendix D – End-Use & Demand Base Tables
- Appendix E – Consumption & Replacement Rate Assumptions
- Appendix F – ASP Reference Tables
- Appendix G – Manufacturing & Facility Database
- Appendix H – Import-Export Data Tables
- Appendix I – Regulatory Summary Tables
- Appendix J – Primary Research Participant List (Anonymized)
- Appendix K – Primary Research Questionnaire Framework
- Appendix L – Data Sources & Bibliography
- Appendix M – Market Size Divergence & Source Comparison
Chapter 17. Research Methodology
- 17.1 Research Framework & Philosophy
- 17.2 Secondary Research – Sources, Hierarchy & Data Extraction
- 17.3 Data Modeling – Bottom-Up & Top-Down Market Sizing
- 17.4 Primary Research – Stakeholder Framework, LOI & Sample Sizes
- 17.5 Forecast Methodology – Regression, Scenario & Sensitivity Analysis
- 17.6 Quality Control – Four-Layer Validation Framework
- 17.7 Limitations & Standard Assumptions
- 17.8 Disclaimer
