
| REPORT ATTRIBUTE | DETAILS |
|---|---|
| Historical Period | 2020-2023 |
| Base Year | 2024 |
| Forecast Period | 2025-2032 |
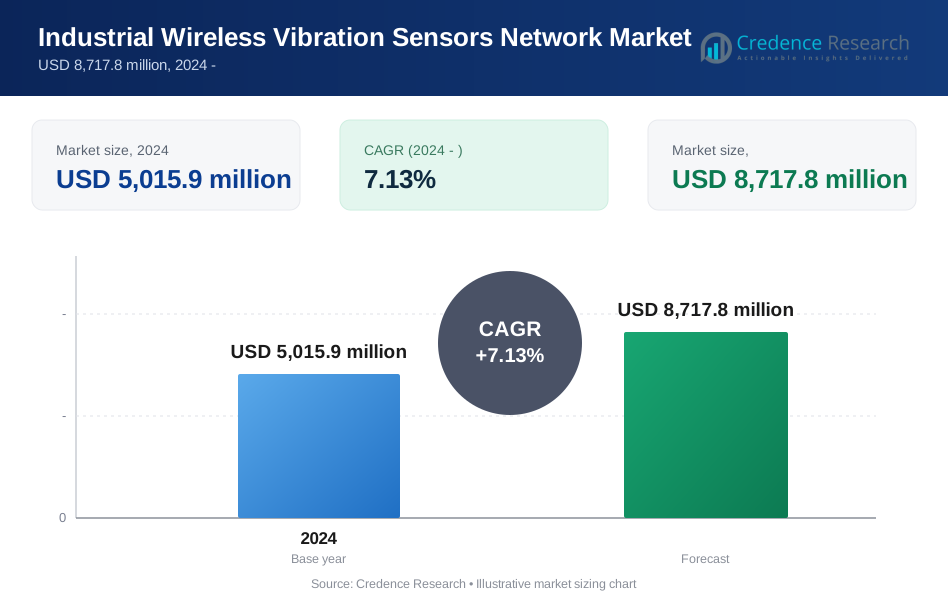
| Industrial Wireless Vibration Sensors Network Market Size 2024 | USD 5,015.9 million |
| Industrial Wireless Vibration Sensors Network Market, CAGR | 7.13% |
| Industrial Wireless Vibration Sensors Network Market Size 2032 | USD 8,717.8 million |
Market Overview:
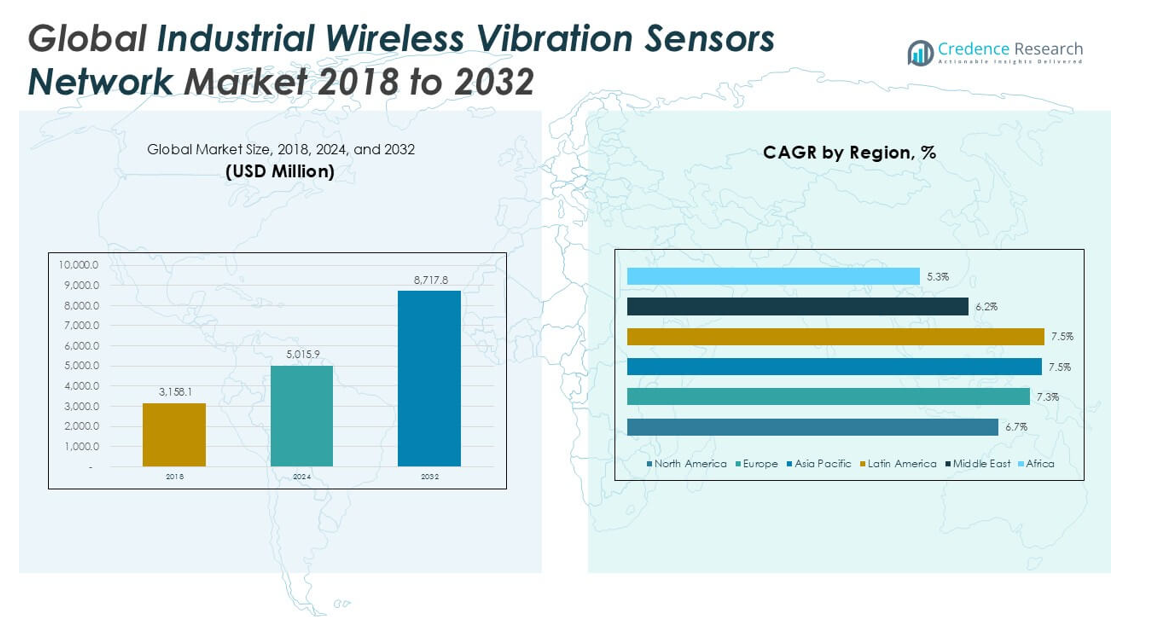
The Industrial Wireless Vibration Sensors Network market size was valued at USD 3,158.1 million in 2018, reached USD 5,015.9 million in 2024, and is anticipated to reach USD 8,717.8 million by 2032, at a CAGR of 7.13% during the forecast period.
The Industrial Wireless Vibration Sensors Network market is led by prominent players such as SKF Group, Honeywell, ABB, GE, Emerson Electric, Yokogawa Electric Corporation, and Swift Sensors, each recognized for their innovation in sensor technology and extensive industry reach. These companies leverage advanced analytics, IoT integration, and comprehensive service portfolios to meet the evolving needs of industrial automation and predictive maintenance. Regionally, Asia Pacific holds the largest market share at 37.0% in 2024, supported by rapid industrialization and significant investments in smart manufacturing. Europe and North America follow, with market shares of 23.3% and 19.6% respectively, driven by early technology adoption and strict regulatory standards across major industrial sectors.
Market Insights
- The Industrial Wireless Vibration Sensors Network market reached USD 5,015.9 million in 2024 and is projected to grow to USD 8,717.8 million by 2032, registering a CAGR of 7.13% during the forecast period.
- Accelerometers lead the sensor type segment due to their high sensitivity and broad application range, supporting increased adoption in condition monitoring and predictive maintenance.
- Market growth is driven by rising demand for automated asset health management, Industry 4.0 initiatives, and a shift toward real-time equipment monitoring in manufacturing, oil and gas, and power generation sectors.
- Competitive intensity remains high with key players such as SKF Group, Honeywell, ABB, GE, Emerson Electric, and Swift Sensors, while integration challenges with legacy systems and concerns over data security restrain widespread adoption.
- Asia Pacific dominates with a 37.0% share in 2024, followed by Europe at 23.3% and North America at 19.6%, reflecting robust investments in industrial automation and modernization.
Market Segmentation Analysis:
By Sensor Type:
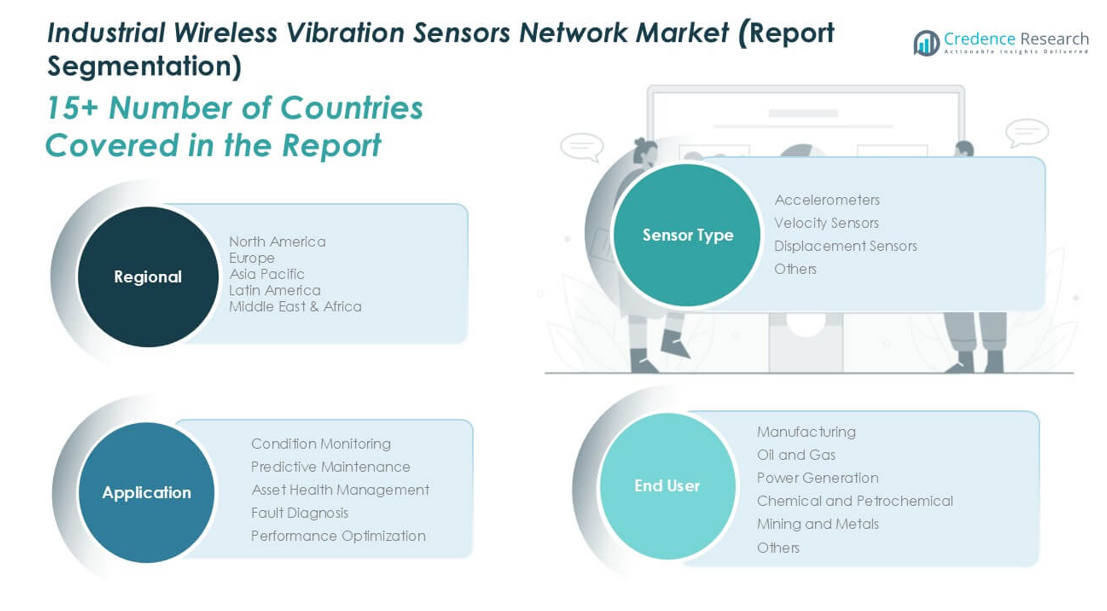
Accelerometers represent the dominant sub-segment in the Industrial Wireless Vibration Sensors Network market, accounting for the largest market share in 2024. Their widespread adoption stems from high sensitivity, reliability, and broad applicability in detecting both low and high-frequency vibrations across industrial equipment. Accelerometers are favored in diverse monitoring scenarios, driven by rising investments in automated condition monitoring and predictive maintenance programs. Velocity sensors and displacement sensors follow, appealing to niche applications requiring specific vibration measurements. The “Others” category includes emerging sensor technologies designed to address unique industrial requirements.
- For instance, Analog Devices Inc. launched the ADXL1002 MEMS accelerometer, capable of measuring vibration up to 11,000 Hz and featuring an ultra-low noise density of 25 micro-g per root hertz, used in real-world deployments for detecting bearing defects in rotating machinery.
By Application:
Condition Monitoring holds the leading share among application segments, reflecting the ongoing shift towards proactive asset management and minimization of unplanned downtime. The demand for real-time condition monitoring is fueled by the need to optimize equipment performance, extend asset lifespan, and comply with stringent safety standards. Predictive maintenance closely follows, leveraging sensor data analytics to forecast potential failures. Asset health management, fault diagnosis, and performance optimization are also gaining traction as organizations prioritize operational efficiency, reliability, and cost reduction through data-driven maintenance strategies.
- For instance, Emerson’s AMS Wireless Vibration Monitor system was deployed at BASF’s Ludwigshafen plant, where the company installed more than 400 wireless vibration sensors on centrifugal pumps and rotating assets, resulting in a measurable reduction in machine failures and emergency maintenance events.
By End-User:
Manufacturing remains the dominant end-user, contributing the highest market share in 2024 due to extensive adoption of wireless vibration sensors for equipment monitoring, process optimization, and downtime prevention. The manufacturing sector’s focus on automation and Industry 4.0 initiatives accelerates sensor deployment across production lines. Oil and gas, power generation, and chemical and petrochemical industries also exhibit significant uptake, driven by the critical need for safety, asset integrity, and regulatory compliance. Mining and metals, along with other sectors, continue to adopt these solutions to ensure operational continuity and improve productivity in challenging industrial environments.
Market Overview
Rising Adoption of Predictive Maintenance
Manufacturers increasingly prioritize predictive maintenance strategies, fueling demand for industrial wireless vibration sensors networks. By enabling early detection of equipment faults and performance issues, these systems help organizations reduce unexpected downtime, lower maintenance costs, and optimize asset life cycles. The shift from reactive to predictive maintenance is particularly strong in industries such as manufacturing, oil and gas, and power generation, where unplanned failures can lead to significant financial and operational losses.
- For instance, SKF’s Enlight ProCollect wireless system was deployed at Tata Steel’s Jamshedpur site, detecting 137 actionable faults in motors and gearboxes in its first year of operation, directly preventing several hours of unscheduled production stoppage.
Expansion of Industrial Automation and Industry 4.0
The ongoing wave of industrial automation and the adoption of Industry 4.0 practices serve as major growth drivers for wireless vibration sensor networks. Factories and processing plants are integrating smart sensor solutions to achieve real-time asset monitoring and seamless data connectivity. These advancements not only boost production efficiency but also support remote monitoring, which is critical for modern, decentralized operations. Investment in smart factories continues to expand, accelerating market growth for advanced sensing technologies.
- For instance, Siemens’ Amberg Electronics Plant in Germany deployed over 1,000 wireless vibration and condition monitoring sensors throughout its manufacturing lines, resulting in a system that can process and analyze over 50 million data records per day for asset health and predictive alerts.
Stringent Regulatory and Safety Standards
Compliance with increasingly stringent regulatory and safety requirements propels the deployment of wireless vibration monitoring systems across high-risk industries. Regulations related to equipment reliability, workplace safety, and environmental impact drive organizations to implement continuous monitoring solutions. These systems help mitigate operational risks, ensure timely maintenance, and align with international safety standards, further incentivizing market adoption, especially in sectors such as oil and gas, chemicals, and mining.
Key Trends & Opportunities
Integration of IoT and Advanced Analytics
The integration of IoT platforms and advanced analytics with wireless vibration sensors marks a significant trend, enabling more actionable insights from sensor data. Companies leverage cloud computing, machine learning, and big data analytics to transform raw vibration data into predictive diagnostics. This trend opens opportunities for value-added services and enhances decision-making, helping end-users move toward truly intelligent asset management.
- For instance, Honeywell’s Connected Plant solution aggregates vibration data from more than 12,000 wireless sensors installed at customer sites worldwide, supporting remote monitoring and predictive diagnostics that have enabled operators to identify up to 2,000 potential equipment issues annually before they escalate.
Growing Demand for Wireless and Battery-Powered Solutions
A marked shift towards wireless and battery-powered vibration sensors is shaping the market landscape. These solutions offer flexible installation, lower maintenance requirements, and improved scalability compared to wired systems. Industries benefit from reduced cabling costs and easier retrofitting in existing plants, creating opportunities for vendors to develop robust, energy-efficient, and long-lasting sensor devices tailored to diverse industrial environments.
- For instance, Banner Engineering’s QM42VT wireless vibration sensors have a battery life of 5 years under standard operation and have been deployed in more than 3,200 manufacturing facilities to monitor critical equipment without the need for wired infrastructure.
Key Challenges
Concerns Over Data Security and Reliability
Despite rapid adoption, data security and reliability concerns present persistent challenges for wireless vibration sensor networks. Industrial users are wary of vulnerabilities in wireless communication protocols, fearing potential data breaches, unauthorized access, or signal interference. Ensuring secure data transmission and system integrity is essential for widespread acceptance, requiring continuous investment in robust cybersecurity frameworks.
Integration with Legacy Systems
Many industrial facilities operate with legacy machinery and outdated control systems, complicating the integration of modern wireless sensor networks. Compatibility issues, high retrofitting costs, and technical skill gaps can delay or limit deployment. Market growth depends on the ability of solution providers to offer user-friendly, interoperable platforms that seamlessly integrate with diverse legacy infrastructures without extensive overhaul.
Battery Life and Maintenance of Wireless Sensors
Battery-powered wireless vibration sensors require periodic maintenance, posing challenges for deployment in remote or hard-to-access locations. Short battery lifespans or frequent replacements can lead to increased operational costs and downtime. Innovations in energy harvesting and ultra-low-power electronics are necessary to address these challenges and ensure the reliability and cost-effectiveness of wireless sensor networks.
Regional Analysis
North America
North America captured a market share of approximately 19.6% in 2024, with the market growing from USD 635.10 million in 2018 to USD 984.84 million in 2024. The region is forecast to reach USD 1,656.37 million by 2032, reflecting a CAGR of 6.7%. North America’s growth is fueled by early adoption of industrial automation, robust investments in predictive maintenance, and stringent regulatory standards in manufacturing and process industries. The presence of leading technology providers and the expansion of smart factory initiatives underpin continued regional demand for wireless vibration sensor networks.
Europe
Europe accounted for around 23.3% of the market share in 2024, with its size rising from USD 731.74 million in 2018 to USD 1,170.57 million in 2024. Projections indicate the market will reach USD 2,053.90 million by 2032, achieving a CAGR of 7.3%. Industrial modernization, strict EU safety regulations, and high penetration of Industry 4.0 solutions drive adoption across automotive, energy, and chemical sectors. European manufacturers emphasize equipment reliability and sustainability, supporting increased deployment of wireless vibration sensor networks in both new and retrofit applications.
Asia Pacific
Asia Pacific held the largest share of approximately 37.0% in 2024, expanding from USD 1,146.71 million in 2018 to USD 1,857.61 million in 2024. The market is anticipated to reach USD 3,312.75 million by 2032, registering the highest CAGR of 7.5%. Rapid industrialization, a thriving manufacturing sector, and ongoing infrastructure upgrades in countries like China, Japan, and India support regional dominance. Strong demand for cost-effective and scalable monitoring solutions, coupled with government initiatives for digitalization and industrial safety, accelerates market expansion across diverse verticals.
Latin America
Latin America represented roughly 10.7% of the market share in 2024, with the market increasing from USD 330.02 million in 2018 to USD 535.99 million in 2024. It is expected to reach USD 958.95 million by 2032, reflecting a CAGR of 7.5%. Growing investment in process industries and an expanding focus on operational efficiency are driving the adoption of wireless vibration sensors. The region’s manufacturers are increasingly prioritizing asset health management and downtime reduction, further strengthening demand for advanced industrial monitoring solutions.
Middle East
The Middle East accounted for about 5.7% of the market share in 2024, with market value rising from USD 189.49 million in 2018 to USD 285.91 million in 2024. The market is forecast to reach USD 462.04 million by 2032, at a CAGR of 6.2%. Growth is largely driven by the oil and gas and petrochemical industries, which require robust monitoring to ensure safety and operational integrity. Regional investments in digital transformation and infrastructure projects further support market growth for wireless vibration sensor networks.
Africa
Africa held a market share of approximately 3.6% in 2024, with the market growing from USD 125.06 million in 2018 to USD 181.00 million in 2024. Projections indicate a rise to USD 273.74 million by 2032, reflecting a CAGR of 5.3%. Adoption of industrial wireless vibration sensors in Africa is driven by the need to modernize legacy equipment, improve plant safety, and reduce unplanned downtime, particularly in mining and power generation. Although currently limited by budget constraints and slow digital transformation, the region shows steady progress toward automation.
Market Segmentations:
By Sensor Type:
- Accelerometers
- Velocity Sensors
- Displacement Sensors
- Others
By Application:
- Condition Monitoring
- Predictive Maintenance
- Asset Health Management
- Fault Diagnosis
- Performance Optimization
By End-User:
- Manufacturing
- Oil and Gas
- Power Generation
- Chemical and Petrochemical
- Mining and Metals
- Others
By Geography:
- North America
- U.S.
- Canada
- Mexico
- Europe
- Germany
- France
- U.K.
- Italy
- Spain
- Rest of Europe
- Asia Pacific
- China
- Japan
- India
- South Korea
- South-east Asia
- Rest of Asia Pacific
- Latin America
- Brazil
- Argentina
- Rest of Latin America
- Middle East & Africa
- GCC Countries
- South Africa
- Rest of the Middle East and Africa
Competitive Landscape
The competitive landscape of the Industrial Wireless Vibration Sensors Network market is characterized by a mix of established industry leaders and innovative technology firms, each striving to enhance their market presence through advanced solutions and strategic partnerships. Leading players such as SKF Group, Honeywell, ABB, GE, Emerson Electric, and Yokogawa Electric Corporation leverage robust product portfolios, global distribution networks, and strong R&D capabilities to address evolving industrial monitoring needs. These companies focus on integrating IoT connectivity, data analytics, and cloud-based platforms into their sensor solutions, aiming to deliver superior performance and value to end-users. The market remains highly competitive, with ongoing innovation, mergers, and collaborations shaping industry dynamics and expanding the adoption of wireless vibration monitoring technologies worldwide.
Key Player Analysis
- Swift Sensors
- SKF Group
- GE
- Schaeffler Group
- Banner
- Yokogawa Electric Corporation
- Parker Hannifin
- Honeywell
- National Instruments
- Waites
- Fluke
- ABB
- PCB Piezotronics Inc.
- Emerson Electric
- BeanAir GmbH
Recent Developments
- In May 2025, Honeywell is a significant player in the broader industrial IoT and automation space. Recent reports indicate the wireless industrial IoT sensors market is projected to reach USD 12.4 billion by 2034, driven by advancements in automation, AI integration, and Industry 4.0. Honeywell's contributions are part of this larger trend, focusing on predictive maintenance and real-time asset tracking through wireless sensors that monitor temperature, vibration, and pressure.
- In April 2025, Fluke introduced the Fluke 3563 Analysis Vibration Sensor. This system combines a high-frequency piezoelectric sensor with insightful eMaint condition monitoring software. It enables continuous monitoring, analyzes vibration readings, and offers customizable frequency band measurements, auto-generated thresholds, and advanced analytics for fault detection and analysis. It features smart battery management for extended life and dual network capabilities (Wi-Fi and Ethernet).
- In April 2025, Schaefflerhighlighted their advanced sensor solutions at Hannover Messe. Their focus was on torque sensors and hydrogen sensors, but they also presented a wide range of intelligent electronic control devices, demonstrating their commitment to enhancing industrial performance and efficiency. This showcase reinforces their dedication to advanced sensor technology for industrial applications.
- In September 2024, Schaeffler presented new condition monitoring solutions at InnoTrans 2024, including advancements in both wired and wireless onboard condition monitoring for rail vehicles. Notably, they offer a wireless axlebox-bearing condition monitoring solution as part of a cooperative project with ZF, utilizing ZF's battery-powered vibration and temperature sensor (Heavy Duty TAG) which transmits data via radio/Bluetooth to a gateway and then to a cloud. Schaeffler provides a software module for analyzing axlebox bearing condition based on this data.
- In January 2023, ABB discontinued its WiMon100 wireless vibration and temperature sensors, replacing them with the new ABB Ability™ Smart Sensor Generation 2, which offers the same core functionality but with added features like enhanced sensing, local signal conditioning, and automated alerts, while maintaining backward compatibility with existing systems and integrating with ABB Ability™ AssetInsight™ software for advanced vibration data analysis.
Market Concentration & Characteristics
The Industrial Wireless Vibration Sensors Network Market features a moderate to high level of market concentration, with a core group of global players commanding significant shares across key regions. It is defined by a focus on technological advancement, integration of IoT capabilities, and robust product development cycles aimed at meeting stringent industrial standards. Leading companies such as SKF Group, Honeywell, ABB, GE, and Emerson Electric consistently introduce new sensor solutions designed for greater accuracy, reliability, and connectivity. The market’s competitive dynamics are influenced by the pace of industrial automation, adoption of predictive maintenance strategies, and increasing regulatory requirements across manufacturing, oil and gas, and power generation. Product differentiation centers on features like wireless connectivity, battery life, and seamless integration with existing plant systems. Regional leaders in Asia Pacific, Europe, and North America benefit from high investments in smart manufacturing and digital transformation, further strengthening the overall market structure and competitive landscape.
Report Coverage
The research report offers an in-depth analysis based on Sensor Type, Application, End-User and Geography. It details leading market players, providing an overview of their business, product offerings, investments, revenue streams, and key applications. Additionally, the report includes insights into the competitive environment, SWOT analysis, current market trends, as well as the primary drivers and constraints. Furthermore, it discusses various factors that have driven market expansion in recent years. The report also explores market dynamics, regulatory scenarios, and technological advancements that are shaping the industry. It assesses the impact of external factors and global economic changes on market growth. Lastly, it provides strategic recommendations for new entrants and established companies to navigate the complexities of the market.
Future Outlook
- The market will experience steady growth driven by the continued adoption of Industry 4.0 and digital transformation initiatives.
- Demand for predictive maintenance solutions will rise as industries focus on minimizing unplanned downtime.
- Wireless vibration sensors will become more energy-efficient, with longer battery life and improved data transmission capabilities.
- IoT integration and advanced analytics will play a pivotal role in enabling real-time monitoring and actionable insights.
- Accelerometers will retain their dominance within the sensor type segment due to their reliability and versatility.
- Competitive intensity will increase as new entrants introduce innovative and cost-effective wireless solutions.
- Regulatory standards on safety and asset health management will continue to shape technology adoption.
- Industrial sectors such as manufacturing, oil and gas, and power generation will remain the primary end-users.
- The Asia Pacific region will continue to lead global market share, supported by rapid industrialization and smart factory investments.
- Integration with legacy systems and cybersecurity will remain key challenges, pushing vendors to deliver more secure and interoperable solutions.
Request a Free Sample
Fill in your details and we'll send you a free sample report.
- Sample data tables & charts
- Research methodology
Need a Custom Version of This Report?
Tailor the scope, geography, or segments to your exact requirements.
- Custom geography or segment scope
- Direct access to our analyst team
Frequently Asked Questions
What is the current size of the Industrial Wireless Vibration Sensors Network Market?
What factors are driving the growth of the Industrial Wireless Vibration Sensors Network Market?
What are some challenges faced by the Industrial Wireless Vibration Sensors NetworkMarket?
Who are the major players in the Industrial Wireless Vibration Sensors NetworkMarket?
Table of Content
Chapter 1. Report Introduction
- 1.1 Report Description & Purpose
- 1.1.1 Report Title & Market Definition
- 1.1.2 Unique Selling Propositions (USP) & Key Differentiators
- 1.1.3 Value Proposition for Stakeholders
- 1.2 Research Objectives
- 1.2.1 Market Sizing Objectives (Volume & Revenue)
- 1.2.2 Segmentation Objectives
- 1.2.3 Competitive Intelligence Objectives
- 1.2.4 Forecast & Scenario Objectives
- 1.3 Report Scope
- 1.3.1 Industrial Wireless Vibration Sensors Network Scope – Types & Subtypes Covered
- 1.3.2 Geographic Scope – Regions & Countries Covered
- 1.3.3 Historical Period, Base Year & Forecast Period (2024; forecast to the forecast period)
- 1.3.4 Inclusions & Exclusions
- 1.4 HS Code & Classification Framework
- 1.5 Currency, Units & Pricing Basis
- 1.6 Target Stakeholders
- 1.7 Limitations & Assumptions
Chapter 2. Executive Summary
- 2.1 Global Industrial Wireless Vibration Sensors Network Market Snapshot
- 2.1.1 Market Size – Historical (2024) & Forecast (the forecast period) (2024: USD 5,015.9 million → forecast year: USD 8,717.8 million)
- 2.1.2 Volume & Revenue – Global Totals
- 2.1.3 Key Market Highlights – Top Five Facts
- 2.2 Industrial Wireless Vibration Sensors Network Market Segmentation Snapshot
- 2.2.1 Market Split by Region – 2024 vs.
- 2.3 Competitive Snapshot
- 2.3.1 Top 10 Players by Revenue Share – 2024
- 2.3.2 Top 10 Players by Volume Share – 2024
- 2.3.3 Recent Strategic Developments (18-Month Summary)
- 2.4 Key Investment Highlights & Strategic Conclusions
Chapter 3. Industrial Wireless Vibration Sensors Network Market Dynamics & Industry Analysis
- 3.1 Market Overview & Context
- 3.1.1 Industrial Wireless Vibration Sensors Network Market Position in the Broader Automotive Value Chain
- 3.1.2 OEM vs. Replacement Market Dynamics
- 3.1.3 Market Maturity & Development Stage by Region
- 3.2 Industrial Wireless Vibration Sensors Network Market Drivers
- 3.3 Industrial Wireless Vibration Sensors Network Market Restraints & Challenges
- 3.4 Industrial Wireless Vibration Sensors Network Market Opportunities
- 3.5 Porter's Five Forces Analysis
- 3.5.1 Threat of New Entrants
- 3.5.2 Bargaining Power of Suppliers
- 3.5.3 Bargaining Power of Buyers
- 3.5.4 Threat of Substitutes
- 3.5.5 Competitive Rivalry – Intensity Assessment
- 3.6 Industrial Wireless Vibration Sensors Network Value Chain Analysis
- 3.6.1 Upstream – Raw Material/Input Suppliers
- 3.6.1.1 Raw Material/Input 1
- 3.6.1.2 Raw Material/Input 2
- 3.6.1.3 Raw Material/Input 3
- 3.6.2 Midstream – Production/Manufacturing/Service Delivery
- 3.6.2.1 Production/Process Overview
- 3.6.2.2 Key Facility Locations & Capacity by Manufacturer
- 3.6.3 Downstream – Distribution & End Consumer
- 3.6.3.1 Primary Channel – B2B/OEM
- 3.6.3.2 Secondary Channels – Dealer, Retail, Online, Direct
- 3.6.4 Value Chain Profitability Analysis
- 3.6.1 Upstream – Raw Material/Input Suppliers
- 3.7 PESTEL Analysis
- 3.7.1 Political Factors
- 3.7.2 Economic Factors
- 3.7.3 Social Factors
- 3.7.4 Technological Factors
- 3.7.5 Environmental Factors
- 3.7.6 Legal Factors
- 3.8 Industrial Wireless Vibration Sensors Network Supply Chain Analysis
- 3.8.1 Raw Material/Input Supply Risk Assessment
- 3.8.2 Manufacturing Concentration Risk (Geographic Exposure)
- 3.8.3 Trade Disruption Impact Analysis
- 3.9 Regulatory & Policy Landscape
Note: The regulatory and policy landscape section covers regulations based on their applicability to the market, Industrial Wireless Vibration Sensors Network category, geography, and scope of the study. Only regulatory frameworks with a material impact on operations, compliance, trade, sustainability, or market access are analyzed in detail.
Chapter 4. Key Investment Pockets & Opportunity Analysis
- 4.1 Industrial Wireless Vibration Sensors Network Market Attractiveness Analysis
- 4.1.1 By Region – Investment Attractiveness Matrix (Volume × CAGR)
- 4.2 Absolute Revenue Growth Opportunity
- 4.2.1 By Region – Absolute USD Growth Through the forecast period
- 4.3 Incremental Volume Opportunity
- 4.3.1 By Region – Incremental Volume Through the forecast period
- 4.3.2 Segment – Incremental Volume
- 4.4 Emerging Submarket Opportunity Deep Dive (Subject to Applicability)
- 4.5 Emerging Market Opportunity Scorecards
- 4.5.1 United States
- 4.5.2 Europe
- 4.5.3 Asia
- 4.5.4 Middle East & Africa
Note: Emerging Market Opportunity Scorecards will be included based on relevance and strategic importance. Regions listed are indicative and may vary depending on data availability and market dynamics.
Chapter 5. Industrial Wireless Vibration Sensors Network Import-Export Analysis & Trade Flows
- 5.1 Global Trade Overview
- 5.1.1 Global Export Value by Country (2024)
- 5.1.2 Global Export Volume by Country (2024)
- 5.1.3 Global Import Value by Country (2024)
- 5.1.4 Global Import Volume by Country (2024)
- 5.1.5 Net Trade Balance by Country (2024)
- 5.2 Export Analysis – Segment
- 5.2.1 Type 1 (HS Code)
- 5.2.2 Type 2 (HS Code)
- 5.2.3 Type 3 (HS Code)
- 5.2.4 Type 4 (HS Code)
- 5.2.5 Type 5 (HS Code)
- 5.3 Import Analysis – Segment
- 5.3.1 Type 1 (HS Code)
- 5.3.2 Type 2 (HS Code)
- 5.3.3 Type 3 (HS Code)
- 5.3.4 Type 4 (HS Code)
- 5.3.5 Type 5 (HS Code)
- 5.4 Average Unit Trade Prices
- 5.4.1 Average Export Price – Segment & Country
- 5.4.2 Average Import Price – Segment & Source Country
- 5.4.3 Price Trends (2024)
- 5.5 Key Trade Route Analysis
- 5.5.1 Trade Route 1
- 5.5.2 Trade Route 2
- 5.5.3 Trade Route 3
- 5.5.4 Trade Route 4
- 5.5.5 Trade Route 5
- 5.6 Trade Policy Impact Assessment
- 5.6.1 US Anti-Dumping & Section 301 Tariffs
- 5.6.2 EU Customs Union Impact
- 5.6.3 Major Free Trade Agreements
- 5.6.4 USMCA Rules of Origin
Note: Trade policy analysis will be included only where relevant to the Industrial Wireless Vibration Sensors Network market.
Chapter 6. Competitive Landscape & Company Benchmarking
- 6.1 Industrial Wireless Vibration Sensors Network Market Concentration & Structure
- 6.1.1 Herfindahl-Hirschman Index (HHI) – vs. 2024
- 6.1.2 Tier 1, Tier 2 & Tier 3 Market Structure
- 6.1.3 Global, Regional & Local Player Dynamics
- 6.2 Industrial Wireless Vibration Sensors Network Market Share Analysis – 2024
- 6.2.1 Global Revenue Share by Company
- 6.2.2 Global Volume Share by Company
- 6.2.3 Regional Revenue Share
- 6.2.4 Market Share Evolution ( vs. 2024)
- 6.2.5 OEM Segment Share by Company
- 6.2.6 Replacement Segment Share by Company
- 6.3 Production/Delivery Capacity & Facility Analysis
- 6.3.1 Global Installed Capacity
- 6.3.2 Capacity Utilization Rates
- 6.3.3 Production/Output Volume
- 6.3.4 Facility Locations & Capacity Map
- 6.3.5 Planned Capacity Additions
- 6.4 Industrial Wireless Vibration Sensors Network Competitive Benchmarking Matrix
- 6.4.1 Revenue, Volume, CAGR & Profitability Comparison
- 6.4.2 Channel Revenue Mix
- 6.4.3 Geographic Revenue Exposure
- 6.4.4 R&D Intensity
- 6.4.5 Sustainability Maturity
- 6.5 Strategic Developments in Industrial Wireless Vibration Sensors Network (Last 24 Months)
- 6.5.1 Mergers, Acquisitions & Divestments
- 6.5.2 New Industrial Wireless Vibration Sensors Network Launches
- 6.5.3 Facility Expansions
- 6.5.4 Strategic Alliances, Joint Ventures & Partnerships
- 6.5.5 Distribution Expansion & Market Entry
- 6.5.6 Sustainability & ESG Initiatives
- 6.6 Competitive Strategy Mapping
- 6.6.1 Leader, Challenger, Follower & Niche Classification
- 6.6.2 Pricing Strategy Comparison
- 6.6.3 Channel Strategy Matrix
Note: Strategic developments are included based on their materiality and the availability of reliable information.
Chapter 7. Global Industrial Wireless Vibration Sensors Network Market – By Distribution Channel
- 7.1 Segment Overview
- 7.1.1 Volume & Revenue Split by Channel (2024 & )
- 7.1.2 Channel Mix Evolution (the forecast period)
Chapter 8. Regional Market Analysis – Global Overview
- 8.1 Global Regional Overview
- 8.1.1 Regional Volume Share
- 8.1.2 Regional Revenue Share
- 8.1.3 Regional Volume by Region
- 8.1.4 Regional Revenue by Region
- 8.1.5 Regional Forecast Through the forecast period
- 8.2 Cross-Regional Segment Analysis
- 8.2.1 By Distribution Channel
- 8.2.2 By Brand/Price Tier
Chapter 9. North America Industrial Wireless Vibration Sensors Network Market
- 9.1 United States
- 9.2 Canada
- 9.3 Mexico
Chapter 10. Europe Industrial Wireless Vibration Sensors Network Market
- 10.1 Germany
- 10.2 France
- 10.3 Italy
- 10.4 United Kingdom
- 10.5 Spain
- 10.6 Poland
- 10.7 Russia
- 10.8 Netherlands
- 10.9 Belgium
- 10.10 Sweden
- 10.11 Denmark
- 10.12 Norway
- 10.13 Rest of Europe
Chapter 11. Asia Pacific Industrial Wireless Vibration Sensors Network Market
- 11.1 China
- 11.2 India
- 11.3 Japan
- 11.4 South Korea
- 11.5 Thailand
- 11.6 Indonesia
- 11.7 Vietnam
- 11.8 Malaysia
- 11.9 Australia
- 11.10 Rest of Asia Pacific
Chapter 12. Latin America Industrial Wireless Vibration Sensors Network Market
- 12.1 Brazil
- 12.2 Argentina
- 12.3 Colombia
- 12.4 Chile
- 12.5 Rest of Latin America
Chapter 13. Middle East Industrial Wireless Vibration Sensors Network Market
- 13.1 Saudi Arabia
- 13.2 United Arab Emirates
- 13.3 Turkey
- 13.4 Israel
- 13.5 Iran
- 13.6 Rest of the Middle East
Chapter 14. Africa Industrial Wireless Vibration Sensors Network Market
- 14.1 South Africa
- 14.2 Egypt
- 14.3 Nigeria
- 14.4 Morocco
- 14.5 Rest of Africa
Chapter 15. Industrial Wireless Vibration Sensors Network Company Profiles
- 15.1 [Company 01]
- 15.1.1 Company Overview
- 15.1.2 Key Management Personnel
- 15.1.3 Products & Services Portfolio
- 15.1.4 Financial Performance
- 15.1.5 Key Market Focus & Geographic Presence
- 15.1.6 Recent Developments & Strategic Initiatives
Note: The company profile list is preliminary and may change based on research findings, market developments, data availability, and client requirements.
Chapter 16. Appendices
- Appendix A – List of Abbreviations & Acronyms
- Appendix B – Industry Classification Code Reference – Full Series
- Appendix C – Production & Capacity Data Tables
- Appendix D – End-Use & Demand Base Tables
- Appendix E – Consumption & Replacement Rate Assumptions
- Appendix F – ASP Reference Tables
- Appendix G – Manufacturing & Facility Database
- Appendix H – Import-Export Data Tables
- Appendix I – Regulatory Summary Tables
- Appendix J – Primary Research Participant List (Anonymized)
- Appendix K – Primary Research Questionnaire Framework
- Appendix L – Data Sources & Bibliography
- Appendix M – Market Size Divergence & Source Comparison
Chapter 17. Research Methodology
- 17.1 Research Framework & Philosophy
- 17.2 Secondary Research – Sources, Hierarchy & Data Extraction
- 17.3 Data Modeling – Bottom-Up & Top-Down Market Sizing
- 17.4 Primary Research – Stakeholder Framework, LOI & Sample Sizes
- 17.5 Forecast Methodology – Regression, Scenario & Sensitivity Analysis
- 17.6 Quality Control – Four-Layer Validation Framework
- 17.7 Limitations & Standard Assumptions
- 17.8 Disclaimer
