
| REPORT ATTRIBUTE | DETAILS |
|---|---|
| Historical Period | 2019-2022 |
| Base Year | 2023 |
| Forecast Period | 2024-2032 |
| Kiosk Market Size 2024 | USD 32,931.56 Million |
| Kiosk Market, CAGR | 7.02% |
| Kiosk Market Size 2032 | USD 60,645.25 Million |
Market Overview
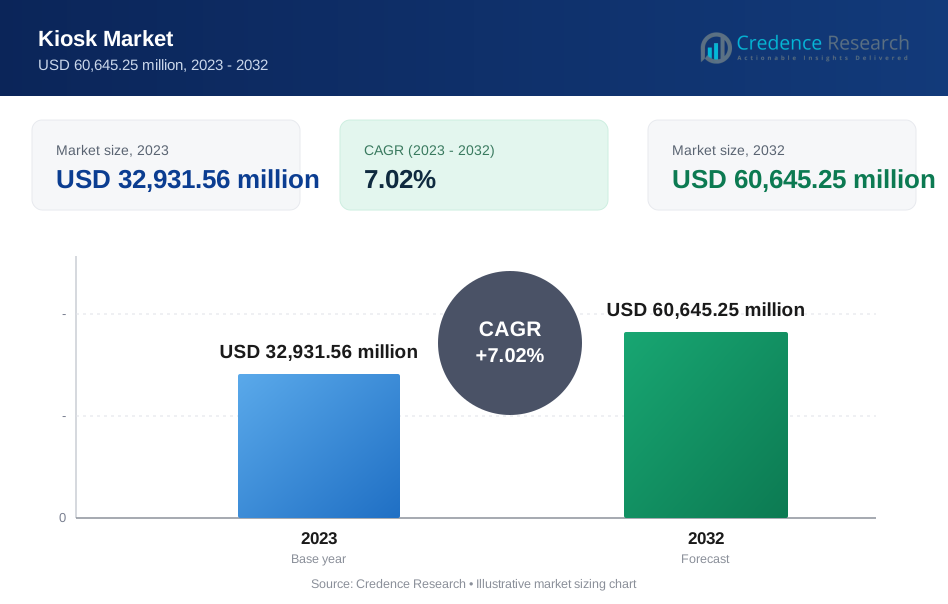
The Kiosk Market is projected to grow from USD 32,931.56 million in 2023 to an estimated USD 60,645.25 million by 2032, with a compound annual growth rate (CAGR) of 7.02% from 2024 to 2032. This growth reflects an increasing demand for self-service technologies across various sectors, including retail, healthcare, and transportation.
Several key drivers and trends fuel the kiosk market’s expansion. Rising customer preference for quick and self-managed transactions, particularly in retail and banking, is a primary growth driver. Technological innovations, including touchless interfaces, AI, and digital payment solutions, further boost the market. Additionally, kiosks are increasingly being adopted for diverse uses such as wayfinding, ticketing, and patient check-ins, highlighting their versatility and enhancing user engagement, which reinforces their growing presence across sectors.
Geographically, North America and Europe dominate the kiosk market due to their high adoption of digital technologies and a mature retail and service landscape. However, the Asia-Pacific region is anticipated to experience the fastest growth, driven by a rising focus on digitalization and growing investments in retail infrastructure in countries like China, India, and Japan. Key players shaping the kiosk market landscape include Kiosk Information Systems, NCR Corporation, Diebold Nixdorf, and Zivelo, all of which are innovating to meet evolving customer needs and enhance kiosk functionalities.
Market Drivers
Rising Demand for Self-Service Solutions Across Sectors
One of the primary drivers of the kiosk market is the increasing demand for self-service solutions in various industries. As customers prioritize convenience, efficiency, and control over their experiences, kiosks are becoming essential in sectors such as retail, banking, healthcare, and transportation. Self-service kiosks streamline processes by allowing users to independently manage transactions, reduce wait times, and access services with minimal staff involvement. This appeal is particularly strong in retail and food service environments, where kiosks help reduce queues, enhance customer satisfaction, and increase transaction speed. For instance, a study by Tillster found that 65% of customers would visit a restaurant more often if self-service kiosks were available, and 30% of customers prefer to order from a kiosk when given the choice. Additionally, McDonald's reported that stores which implemented self-service kiosks saw an average increase in sales of 5-6%. The growth in self-service banking solutions, such as ATMs and self-checkout machines, aligns with the banking sector's shift toward digital services, reinforcing the demand for kiosks. As companies aim to improve customer experience and meet evolving consumer preferences, they are investing in kiosks to offer quick, self-managed service options, significantly driving market growth.
Technological Advancements Enhancing User Experience and Functionality
Technological innovations play a crucial role in driving the adoption of kiosks by enhancing user experience and expanding their functionalities. Modern kiosks are increasingly equipped with advanced features such as touchless technology, facial recognition, artificial intelligence (AI), and digital payment systems, which make interactions more seamless and personalized. Touchless and AI-driven kiosks, for instance, allow users to engage with kiosks via voice commands or gestures, reducing physical contact and improving hygiene, which has gained importance in recent years. Furthermore, the integration of digital payment solutions, including mobile wallets and contactless payments, has made transactions faster and more convenient, encouraging user engagement. These technological advancements not only improve customer satisfaction but also enable businesses to gather valuable data insights, which can be leveraged for personalized marketing and service improvement. The ongoing advancements in kiosk technology are making them more versatile and effective, further propelling their adoption across multiple industries.
Cost-Effectiveness and Operational Efficiency for Businesses
The cost-saving potential of kiosks is another key driver for their widespread adoption. Businesses across various sectors recognize kiosks as a cost-effective solution to optimize operations and reduce labor expenses. By automating tasks that were traditionally managed by staff-such as ticketing, check-ins, and payment processing-kiosks enable companies to reallocate human resources to other strategic roles, thereby improving operational efficiency. For instance, in the retail and hospitality industries, kiosks can efficiently handle customer orders, allowing staff to focus on enhancing the quality of service. This operational efficiency translates to reduced operational costs, particularly in businesses facing labor shortages or high employee turnover. Additionally, kiosks have a long lifespan and require relatively low maintenance compared to employing additional staff, making them a viable, cost-effective solution for businesses aiming to streamline services while minimizing expenses. This financial benefit motivates organizations to invest in kiosks, contributing to the market's growth.
Increasing Adoption in Emerging Economies and Expanding Retail Sector
The growing adoption of kiosks in emerging economies is a significant market driver, especially in the Asia-Pacific region, where rapid urbanization, rising disposable incomes, and an expanding retail sector are creating favorable conditions. As emerging markets like China, India, and Brazil experience increased consumer spending and a shift toward digital services, businesses are incorporating kiosks to cater to the evolving expectations of tech-savvy customers. Moreover, government initiatives to encourage digitalization and smart city development in these regions are providing additional support for kiosk installations across transportation hubs, healthcare facilities, and public spaces. The expansion of the retail sector, in particular, plays a crucial role in driving kiosk adoption as businesses seek to enhance customer engagement and operational efficiency through digital solutions. The increasing investments by both local and international companies in these regions to build modern infrastructure are likely to drive significant growth in the kiosk market.
Market Trends
Integration of Advanced Technologies for Enhanced User Engagement
A prevailing trend in the kiosk market is the integration of cutting-edge technologies, which significantly enhance user engagement and create more personalized experiences. Technologies like artificial intelligence (AI), machine learning, and the Internet of Things (IoT) are being incorporated into kiosks to provide intelligent, interactive interfaces. For example, AI-enabled kiosks can recognize returning users, predict their preferences, and suggest personalized options based on previous interactions, which is particularly beneficial in sectors such as retail and hospitality. IoT integration allows kiosks to connect with other smart devices and systems, making them an integral part of larger digital ecosystems. Additionally, touchless technologies, like voice recognition and gesture control, are gaining traction, especially in the wake of heightened hygiene awareness. These touchless options provide users with a safe, convenient way to interact with kiosks, particularly in high-traffic areas like airports, hospitals, and retail stores. The use of advanced technologies in kiosks not only enhances customer satisfaction but also enables businesses to gather valuable data insights for improved decision-making and personalized marketing efforts.
Expansion of Self-Service Kiosks Beyond Traditional Sectors
The kiosk market is witnessing an expansion of self-service applications beyond traditional sectors like retail and banking. Today, kiosks are increasingly being deployed in healthcare, education, and government sectors, catering to a broader range of user needs. In healthcare, for instance, self-service kiosks are used for patient check-ins, appointment scheduling, and bill payments, allowing healthcare facilities to streamline administrative processes and reduce patient wait times. Educational institutions are leveraging kiosks for applications such as campus wayfinding, library management, and student enrollment services. Similarly, government agencies are adopting kiosks for public services like utility bill payments, information dissemination, and self-service inquiries, making essential services more accessible and efficient. This trend reflects a broader shift toward digital transformation across various industries, as organizations aim to improve service delivery and operational efficiency through automated solutions. The expansion of kiosks into diverse sectors is a testament to their versatility and highlights their potential to meet evolving consumer expectations across multiple domains.
Market Restraints and Challenges
High Initial Investment and Maintenance Costs
A significant restraint in the kiosk market is the high initial investment required for kiosk deployment and the ongoing maintenance expenses. Despite kiosks’ potential to reduce operational costs in the long run, their upfront installation costs-especially for advanced models equipped with technologies like AI, touchless interfaces, and IoT connectivity-can be prohibitive for smaller businesses or organizations with limited budgets. Beyond installation, regular maintenance and software updates are essential to ensure optimal functionality and security, which can further escalate costs. Issues such as hardware malfunctions, software glitches, and the need for periodic upgrades can disrupt operations and require technical support, adding to operational expenses. For businesses operating in regions with limited technical support infrastructure, these challenges become even more pronounced. Consequently, the high costs associated with kiosks’ installation and upkeep act as a barrier to widespread adoption, particularly for small and medium-sized enterprises (SMEs).
Privacy and Security Concerns
Privacy and security remain critical challenges in the kiosk market, as many kiosks handle sensitive data, including payment information and personal identification details. With the growing adoption of digital payment solutions and customer data collection through kiosks, the risk of data breaches and cyber-attacks has increased. Unauthorized access to kiosk networks and the potential for malware attacks expose both businesses and customers to significant privacy risks. Ensuring robust cybersecurity measures, such as encryption, secure authentication, and regular security updates, is essential to prevent data breaches. However, implementing these protections can be complex and costly, especially as kiosks become more interconnected and technologically advanced. Furthermore, consumers are increasingly aware of data privacy issues, and any security breach can damage a brand’s reputation, potentially leading to reduced customer trust and engagement. Privacy and security concerns, therefore, present a considerable challenge for kiosk operators, underscoring the need for stringent cybersecurity measures in the kiosk market.
Market Segmentation Analysis
By Type
The kiosk market is segmented by type, including Automated Teller Machines (ATMs), Retail Self-Checkout Kiosks, Self-Service Kiosks, Vending Kiosks, and Others. ATMs dominate this segment, widely used in the banking and finance sector to provide customers with convenient access to cash and financial services. Retail self-checkout kiosks are gaining momentum as they allow customers to complete purchases independently, reducing wait times and enhancing the shopping experience. Self-service kiosks, which serve a variety of purposes from ticketing to information, are increasingly used in airports, malls, and healthcare facilities. Vending kiosks provide on-demand product access, which is particularly popular in transportation hubs and public areas. The diversity in kiosk types reflects their adaptability across sectors, which supports broad market adoption.
By Component
The market is segmented by component into Hardware, Software, and Services. Hardware includes display screens and other physical parts essential for kiosk functionality. High-quality, durable displays are crucial as they serve as the primary point of interaction for users. Software, categorized into Windows and other operating systems, enables efficient functioning and user-friendly interfaces. Windows-based kiosks are prevalent due to their compatibility and ease of use, although other operating systems are gaining traction for specific applications. Services encompass Integration & Deployment and Managed Services. Integration & Deployment services are critical for setting up customized kiosks to align with organizational requirements, while Managed Services ensure regular maintenance, updates, and technical support, which are vital for seamless kiosk operation.
Segments
Based on type
- Automated Teller Machines
- Retail Self-Checkout Kiosks
- Self-Service Kiosks
- Vending Kiosks
- Others
Based on Component
- Hardware
- Display
- Others
- Software
- Window
- Others
- Services
- Integration & Deployment
- Managed Services
Based on End User
- BFSI
- Retail,
- Food & Beverage
- Healthcare
- Others
Based on region
- North America
- U.S.
- Canada
- Mexico
- Europe
- Germany
- France
- U.K.
- Italy
- Spain
- Rest of Europe
- Asia Pacific
- China
- Japan
- India
- South Korea
- South-east Asia
- Rest of Asia Pacific
- Latin America
- Brazil
- Argentina
- Rest of Latin America
- Middle East & Africa
- GCC Countries
- South Africa
- Rest of the Middle East and Africa
Regional Analysis
North America (35%)
North America holds a dominant position in the global kiosk market, accounting for approximately 35% of the market share. This region's leadership is driven by high adoption rates of digital and self-service technologies, particularly in the United States and Canada. The strong presence of established players in the retail, banking, and food service sectors has fueled the demand for kiosks to enhance customer experience and operational efficiency. Additionally, a mature technological infrastructure supports widespread deployment of advanced kiosk solutions, such as touchless interfaces and AI-driven functionalities. The banking sector in North America extensively utilizes ATMs and self-service kiosks, while the retail and food industries are increasingly adopting self-checkout and ordering kiosks to meet consumer expectations for quick, seamless transactions.
Europe (25%)
Europe represents around 25% of the global kiosk market share, driven by a strong demand for digital services across the region. Western European countries, including the United Kingdom, Germany, and France, are leading in kiosk adoption due to their developed retail, banking, and healthcare sectors. European businesses prioritize customer experience and operational efficiency, leading to the widespread adoption of kiosks in both private and public sectors. The retail sector, in particular, utilizes kiosks to facilitate self-checkouts and enhance customer engagement. Moreover, the healthcare sector in Europe has embraced kiosks for patient check-ins and service information, optimizing service delivery. The region's regulatory emphasis on data privacy and security has also encouraged kiosk providers to integrate robust cybersecurity features into their systems.
Key players
- NCR Corporation
- Diebold Nixdorf AG
- ZEBRA Technologies Corporation
- Advanced Kiosks
- Imbros Group
- GRG Banking
- IER SAS
Competitive Analysis
The kiosk market is highly competitive, with several prominent players continually innovating to meet evolving customer demands across various sectors. NCR Corporation and Diebold Nixdorf AG are market leaders, especially in the banking sector, where they provide robust ATM and self-service solutions. Both companies leverage extensive experience and a broad product portfolio to maintain a strong presence. ZEBRA Technologies Corporation focuses on innovative solutions with a particular emphasis on retail, healthcare, and logistics applications, enhancing its competitiveness through advanced technology integration and IoT solutions. Advanced Kiosks and GRG Banking cater to diverse industries, offering customizable kiosk solutions that appeal to businesses in emerging and established markets alike. Meanwhile, Imbros Group and IER SAS provide specialized kiosks for sectors like transportation and public services, filling niche market needs. These companies' continuous product development, strategic partnerships, and commitment to customer-centric solutions drive competition in the kiosk market.
Recent Developments
- In January 2020, NCR Corporation expanded into the entertainment market with the launch of NCR Xpress Entertainment, a multichannel digital media kiosk solution. This high-capacity kiosk allows for rentals and sales of digital media, including movies and video games, and integrates with mobile and internet platforms for consumer interaction.
- In January 2020, Diebold Nixdorf was recognized as the leading global provider of self-ordering kiosks by RBR in its Global Self-Ordering Kiosks 2020 study. The company had installed nearly 25,000 kiosks in quick-service restaurants (QSRs), offering flexible, user-friendly solutions adaptable to various business needs.
- In September 2024, Zebra Technologies introduced the KC50 Android Kiosk Computer. This versatile kiosk is designed for multiple industries, including retail and healthcare. It features customizable options such as dual screens, scanners, printers, and payment terminals. The KC50 can be mounted on walls or countertops, offering flexibility for different environments.
- In Q4 2024, Advanced Kiosks launched several new products:
- The 32-Inch Pedestal Kiosk.
- The AK CityGuide, a digital wayfinding solution.
- The introduction of "Ask AK AI", a support assistant aimed at improving customer service interactions.
Market Concentration and Characteristics
The kiosk market is moderately concentrated, with a mix of well-established players and emerging companies that cater to various industries, including retail, banking, healthcare, and transportation. Key players such as NCR Corporation, Diebold Nixdorf AG, and ZEBRA Technologies Corporation hold a significant share of the market due to their comprehensive product portfolios, technological expertise, and strong customer bases. These larger companies benefit from economies of scale, enabling them to invest in advanced technologies like AI, IoT, and touchless interfaces, which enhance kiosk functionality and appeal. However, smaller and regional players are also gaining traction by offering specialized or customizable kiosk solutions that address niche needs, especially in emerging markets. The market's competitive landscape is characterized by continuous innovation, strategic partnerships, and a focus on enhancing customer experience through self-service technology, reflecting the industry’s adaptability and responsiveness to evolving consumer expectations.
Report Coverage
The research report offers an in-depth analysis based on type, Component, End User and Region. It details leading market players, providing an overview of their business, product offerings, investments, revenue streams, and key applications. Additionally, the report includes insights into the competitive environment, SWOT analysis, current market trends, as well as the primary drivers and constraints. Furthermore, it discusses various factors that have driven market expansion in recent years. The report also explores market dynamics, regulatory scenarios, and technological advancements that are shaping the industry. It assesses the impact of external factors and global economic changes on market growth. Lastly, it provides strategic recommendations for new entrants and established companies to navigate the complexities of the market.
Future Outlook
- The kiosk market will see significant growth as self-service solutions continue to be widely adopted across sectors like retail, banking, and healthcare to enhance customer convenience and reduce operational costs.
- Kiosks are expected to incorporate more advanced technologies, such as AI, machine learning, and IoT, enabling them to offer personalized and efficient services tailored to individual customer needs.
- In response to increased hygiene awareness, the market will witness a rise in touchless and contactless kiosk solutions, including voice-activated and gesture-based interfaces, especially in public spaces.
- As kiosks handle sensitive data, data privacy and cybersecurity measures will become a priority, with companies investing in robust security features to gain consumer trust and comply with regulations.
- Emerging markets, particularly in Asia-Pacific and Latin America, will experience faster growth as digitalization initiatives and rising consumer incomes drive the demand for self-service technologies.
- The retail and vending kiosk segments will expand, especially with automated vending kiosks providing on-demand access to goods in transportation hubs, workplaces, and high-traffic areas.
- Businesses will increasingly demand customizable kiosk solutions that align with their brand and service requirements, leading to a rise in modular and industry-specific kiosks.
- Kiosk adoption will extend beyond traditional sectors to new areas like education, entertainment, and government services, as these industries recognize the efficiency and customer experience benefits of kiosks.
- There will be a growing focus on energy-efficient and sustainable kiosk models, as businesses and consumers become more environmentally conscious and seek eco-friendly technology solutions.
- Key players will form strategic partnerships and collaborations to expand their offerings, enter new markets, and leverage combined expertise to develop more sophisticated, adaptable kiosk solutions.
Request a Free Sample
Fill in your details and we'll send you a free sample report.
- Sample data tables & charts
- Research methodology
Need a Custom Version of This Report?
Tailor the scope, geography, or segments to your exact requirements.
- Custom geography or segment scope
- Direct access to our analyst team
Frequently Asked Questions
What is the market size of the kiosk market in 2023, and how is it projected to grow by 2032?
What are the key drivers for the growth of the kiosk market?
Which sectors are adopting kiosk solutions the most?
Which region is expected to grow the fastest in the kiosk market?
Who are some key players in the kiosk market?
How do technological advancements impact the kiosk market?
Table of Content
Chapter 1. Report Introduction
- 1.1 Report Description & Purpose
- 1.1.1 Report Title & Market Definition
- 1.1.2 Unique Selling Propositions (USP) & Key Differentiators
- 1.1.3 Value Proposition for Stakeholders
- 1.2 Research Objectives
- 1.2.1 Market Sizing Objectives (Volume & Revenue) (Volume Where Applicable)
- 1.2.2 Segmentation Objectives
- 1.2.3 Competitive Intelligence Objectives
- 1.2.4 Forecast & Scenario Objectives
- 1.3 Report Scope
- 1.3.1 Kiosk Scope – Segments & Subsegments Covered
- 1.3.2 Geographic Scope – Regions & Countries Covered
- 1.3.3 Historical Period, Base Year & Forecast Period (2023; forecast to 2032)
- 1.3.4 Inclusions & Exclusions
- 1.4 Industry Classification & Applicable Codes
- 1.5 Currency, Measurement Units & Valuation Basis
- 1.6 Target Stakeholders
- 1.7 Limitations & Assumptions
Chapter 2. Executive Summary
- 2.1 Global Kiosk Market Snapshot
- 2.1.1 Market Size – Historical (2023) & Forecast (2023-2032) (2023: USD 32,931.56 million → 2032: USD 60,645.25 million)
- 2.1.2 Volume & Revenue – Global Totals (Volume Where Applicable)
- 2.1.3 Key Market Highlights – Top Five Facts
- 2.2 Kiosk Market Segmentation Snapshot
- 2.2.1 Market Split by Region – 2023 vs. 2032
- 2.3 Competitive Snapshot
- 2.3.1 Top 10 Players by Revenue Share – 2023
- 2.3.2 Top 10 Players by Volume Share – 2023 (Volume Where Applicable)
- 2.3.3 Recent Strategic Developments (18-Month Summary)
- 2.4 Key Investment Highlights & Strategic Conclusions
Chapter 3. Kiosk Market Dynamics & Industry Analysis
- 3.1 Market Overview & Context
- 3.1.1 Kiosk Market Position in the Broader Industry Value Chain
- 3.1.2 Demand Structure & Purchasing Dynamics
- 3.1.3 Market Maturity & Development Stage by Region
- 3.2 Kiosk Market Drivers
- 3.3 Kiosk Market Restraints & Challenges
- 3.4 Kiosk Market Opportunities
- 3.5 Porter's Five Forces Analysis
- 3.5.1 Threat of New Entrants
- 3.5.2 Bargaining Power of Suppliers
- 3.5.3 Bargaining Power of Buyers
- 3.5.4 Threat of Substitutes
- 3.5.5 Competitive Rivalry – Intensity Assessment
- 3.6 Kiosk Value Chain Analysis
- 3.6.1 Upstream – Key Inputs, Resources & Suppliers
- 3.6.1.1 Key Input/Resource 1
- 3.6.1.2 Key Input/Resource 2
- 3.6.1.3 Key Input/Resource 3
- 3.6.2 Midstream – Core Operations & Value Creation
- 3.6.2.1 Operating Model & Process Overview
- 3.6.2.2 Key Operating Locations & Capabilities by Company
- 3.6.3 Downstream – Market Channels & End Users
- 3.6.3.1 Direct Sales & Customer Engagement Channels
- 3.6.3.2 Indirect Sales, Intermediaries & Partner Channels
- 3.6.4 Value Chain Profitability Analysis
- 3.6.1 Upstream – Key Inputs, Resources & Suppliers
- 3.7 PESTEL Analysis
- 3.7.1 Political Factors
- 3.7.2 Economic Factors
- 3.7.3 Social Factors
- 3.7.4 Technological Factors
- 3.7.5 Environmental Factors
- 3.7.6 Legal Factors
- 3.8 Kiosk Supply Chain Analysis
- 3.8.1 Critical Input & Resource Availability Risk Assessment
- 3.8.2 Supplier & Operational Concentration Risk (Geographic Exposure)
- 3.8.3 Supply & Service Disruption Impact Analysis
- 3.9 Regulatory & Policy Landscape
Note: The regulatory and policy landscape section covers regulations based on their applicability to the market, Kiosk category, geography, and scope of the study. Only regulatory frameworks with a material impact on operations, compliance, trade, sustainability, or market access are analyzed in detail.
Chapter 4. Key Investment Pockets & Opportunity Analysis
- 4.1 Kiosk Market Attractiveness Analysis
- 4.1.1 By Region – Investment Attractiveness Matrix (Market Size × CAGR)
- 4.2 Absolute Revenue Growth Opportunity
- 4.2.1 By Region – Absolute Revenue Growth Through 2032
- 4.3 Incremental Demand Opportunity
- 4.3.1 By Region – Incremental Demand Through 2032
- 4.3.2 Segment – Incremental Demand
- 4.4 Emerging Submarket Opportunity Deep Dive (Subject to Applicability)
- 4.5 Priority Market Opportunity Scorecards
- 4.5.1 United States
- 4.5.2 Europe
- 4.5.3 Asia
- 4.5.4 Middle East & Africa
Note: Priority market opportunity scorecards reflect the geographic scope and strategic relevance of the study. Listed markets are indicative and may be adapted to the industry.
Chapter 5. Kiosk Cross-Border Trade & Market Access Analysis
- 5.1 International Trade & Cross-Border Activity Overview
- 5.1.1 Global Export Value by Country (2023)
- 5.1.2 Global Export Volume by Country (2023) (Volume Where Applicable)
- 5.1.3 Global Import Value by Country (2023)
- 5.1.4 Global Import Volume by Country (2023) (Volume Where Applicable)
- 5.1.5 Net Trade Balance by Country (2023)
- 5.2 Export Analysis – Segment
- 5.2.1 Category 1 (Applicable Classification Code)
- 5.2.2 Category 2 (Applicable Classification Code)
- 5.2.3 Category 3 (Applicable Classification Code)
- 5.2.4 Category 4 (Applicable Classification Code)
- 5.2.5 Category 5 (Applicable Classification Code)
- 5.3 Import Analysis – Segment
- 5.3.1 Category 1 (Applicable Classification Code)
- 5.3.2 Category 2 (Applicable Classification Code)
- 5.3.3 Category 3 (Applicable Classification Code)
- 5.3.4 Category 4 (Applicable Classification Code)
- 5.3.5 Category 5 (Applicable Classification Code)
- 5.4 Cross-Border Pricing & Transaction Benchmarks
- 5.4.1 Export Pricing – Segment & Country
- 5.4.2 Import Pricing – Segment & Source Country
- 5.4.3 Price Trends (2023)
- 5.5 Key Cross-Border Trade & Delivery Routes
- 5.5.1 Cross-Border Trade/Delivery Route 1
- 5.5.2 Cross-Border Trade/Delivery Route 2
- 5.5.3 Cross-Border Trade/Delivery Route 3
- 5.5.4 Cross-Border Trade/Delivery Route 4
- 5.5.5 Cross-Border Trade/Delivery Route 5
- 5.6 Trade Policy & Market Access Impact Assessment
- 5.6.1 Tariff & Non-Tariff Barriers
- 5.6.2 Regional Trade & Economic Integration Frameworks
- 5.6.3 Bilateral & Multilateral Trade Agreements
- 5.6.4 Cross-Border Operating, Licensing & Localization Requirements
Note: This chapter applies where cross-border trade or delivery is relevant to Kiosk. Goods, services, and digital offerings are assessed using applicable classifications and transaction measures. Import-export volumes, trade balances, and route analyses are included only where meaningful to the market.
Chapter 6. Competitive Landscape & Company Benchmarking
- 6.1 Kiosk Market Concentration & Structure
- 6.1.1 Herfindahl-Hirschman Index (HHI) – vs. 2023
- 6.1.2 Leading, Mid-Sized & Emerging Player Structure
- 6.1.3 Global, Regional & Local Player Dynamics
- 6.2 Kiosk Market Share Analysis – 2023
- 6.2.1 Global Revenue Share by Company
- 6.2.2 Global Volume Share by Company (Volume Where Applicable)
- 6.2.3 Regional Revenue Share
- 6.2.4 Market Share Evolution ( vs. 2023)
- 6.2.5 Company Market Share by Key Segment
- 6.2.6 Company Market Share by Customer Group
- 6.3 Operating Scale, Capacity & Infrastructure Analysis
- 6.3.1 Global Operating Scale & Supply Capacity
- 6.3.2 Resource Utilization & Operating Efficiency
- 6.3.3 Output, Service Delivery & Activity Metrics
- 6.3.4 Operating Footprint & Infrastructure Map
- 6.3.5 Planned Operational & Capacity Expansion
- 6.4 Kiosk Competitive Benchmarking Matrix
- 6.4.1 Revenue, Growth, Profitability & Operating Metric Comparison
- 6.4.2 Channel Revenue Mix
- 6.4.3 Geographic Revenue Exposure
- 6.4.4 R&D Intensity
- 6.4.5 Sustainability Maturity
- 6.5 Strategic Developments in Kiosk (Last 24 Months)
- 6.5.1 Mergers, Acquisitions & Divestments
- 6.5.2 New Products, Services & Solutions in Kiosk
- 6.5.3 Operational & Infrastructure Expansions
- 6.5.4 Strategic Alliances, Joint Ventures & Partnerships
- 6.5.5 Distribution Expansion & Market Entry
- 6.5.6 Sustainability & ESG Initiatives
- 6.6 Competitive Strategy Mapping
- 6.6.1 Leader, Challenger, Follower & Niche Classification
- 6.6.2 Pricing Strategy Comparison
- 6.6.3 Channel Strategy Matrix
Note: Strategic developments are included based on their materiality and the availability of reliable information.
Chapter 7. Global Kiosk Market – By Sales & Delivery Channel
- 7.1 Segment Overview
- 7.1.1 Volume & Revenue Split by Channel (2023 & 2032) (Volume Where Applicable)
- 7.1.2 Channel Mix Evolution (2023-2032)
Chapter 8. Regional Market Analysis – Global Overview
- 8.1 Global Regional Overview
- 8.1.1 Regional Volume Share (Volume Where Applicable)
- 8.1.2 Regional Revenue Share
- 8.1.3 Regional Volume by Region (Volume Where Applicable)
- 8.1.4 Regional Revenue by Region
- 8.1.5 Regional Forecast Through 2032
- 8.2 Cross-Regional Segment Analysis
- 8.2.1 By Sales & Delivery Channel
- 8.2.2 By Competitive Positioning & Price Tier
Chapter 9. North America Kiosk Market
- 9.1 United States
- 9.2 Canada
- 9.3 Mexico
Chapter 10. Europe Kiosk Market
- 10.1 Germany
- 10.2 France
- 10.3 Italy
- 10.4 United Kingdom
- 10.5 Spain
- 10.6 Poland
- 10.7 Russia
- 10.8 Netherlands
- 10.9 Belgium
- 10.10 Sweden
- 10.11 Denmark
- 10.12 Norway
- 10.13 Rest of Europe
Chapter 11. Asia Pacific Kiosk Market
- 11.1 China
- 11.2 India
- 11.3 Japan
- 11.4 South Korea
- 11.5 Thailand
- 11.6 Indonesia
- 11.7 Vietnam
- 11.8 Malaysia
- 11.9 Australia
- 11.10 Rest of Asia Pacific
Chapter 12. Latin America Kiosk Market
- 12.1 Brazil
- 12.2 Argentina
- 12.3 Colombia
- 12.4 Chile
- 12.5 Rest of Latin America
Chapter 13. Middle East Kiosk Market
- 13.1 Saudi Arabia
- 13.2 United Arab Emirates
- 13.3 Turkey
- 13.4 Israel
- 13.5 Iran
- 13.6 Rest of the Middle East
Chapter 14. Africa Kiosk Market
- 14.1 South Africa
- 14.2 Egypt
- 14.3 Nigeria
- 14.4 Morocco
- 14.5 Rest of Africa
Chapter 15. Kiosk Company Profiles
- 15.1 [Company 01]
- 15.1.1 Company Overview
- 15.1.2 Key Management Personnel
- 15.1.3 Products & Services Portfolio
- 15.1.4 Financial Performance
- 15.1.5 Key Market Focus & Geographic Presence
- 15.1.6 Recent Developments & Strategic Initiatives
Note: The company profile list is preliminary and may change based on research findings, market developments, data availability, and client requirements.
Chapter 16. Appendices
- Appendix A – List of Abbreviations & Acronyms
- Appendix B – Industry Classification Code Reference – Full Series
- Appendix C – Supply, Output & Operating Capacity Data Tables
- Appendix D – End-Use & Demand Base Tables
- Appendix E – Demand, Adoption & Usage Assumptions
- Appendix F – Pricing & Revenue Metric Reference Tables
- Appendix G – Company Operations & Infrastructure Database
- Appendix H – Cross-Border Trade & Activity Data Tables (Where Applicable)
- Appendix I – Regulatory Summary Tables
- Appendix J – Primary Research Participant List (Anonymized)
- Appendix K – Primary Research Questionnaire Framework
- Appendix L – Data Sources & Bibliography
- Appendix M – Market Size Divergence & Source Comparison
Chapter 17. Research Methodology
- 17.1 Research Framework & Philosophy
- 17.2 Secondary Research – Sources, Hierarchy & Data Extraction
- 17.3 Data Modeling – Bottom-Up & Top-Down Market Sizing
- 17.4 Primary Research – Stakeholder Framework, LOI & Sample Sizes
- 17.5 Forecast Methodology – Regression, Scenario & Sensitivity Analysis
- 17.6 Quality Control – Four-Layer Validation Framework
- 17.7 Limitations & Standard Assumptions
- 17.8 Disclaimer
