
Market Overview
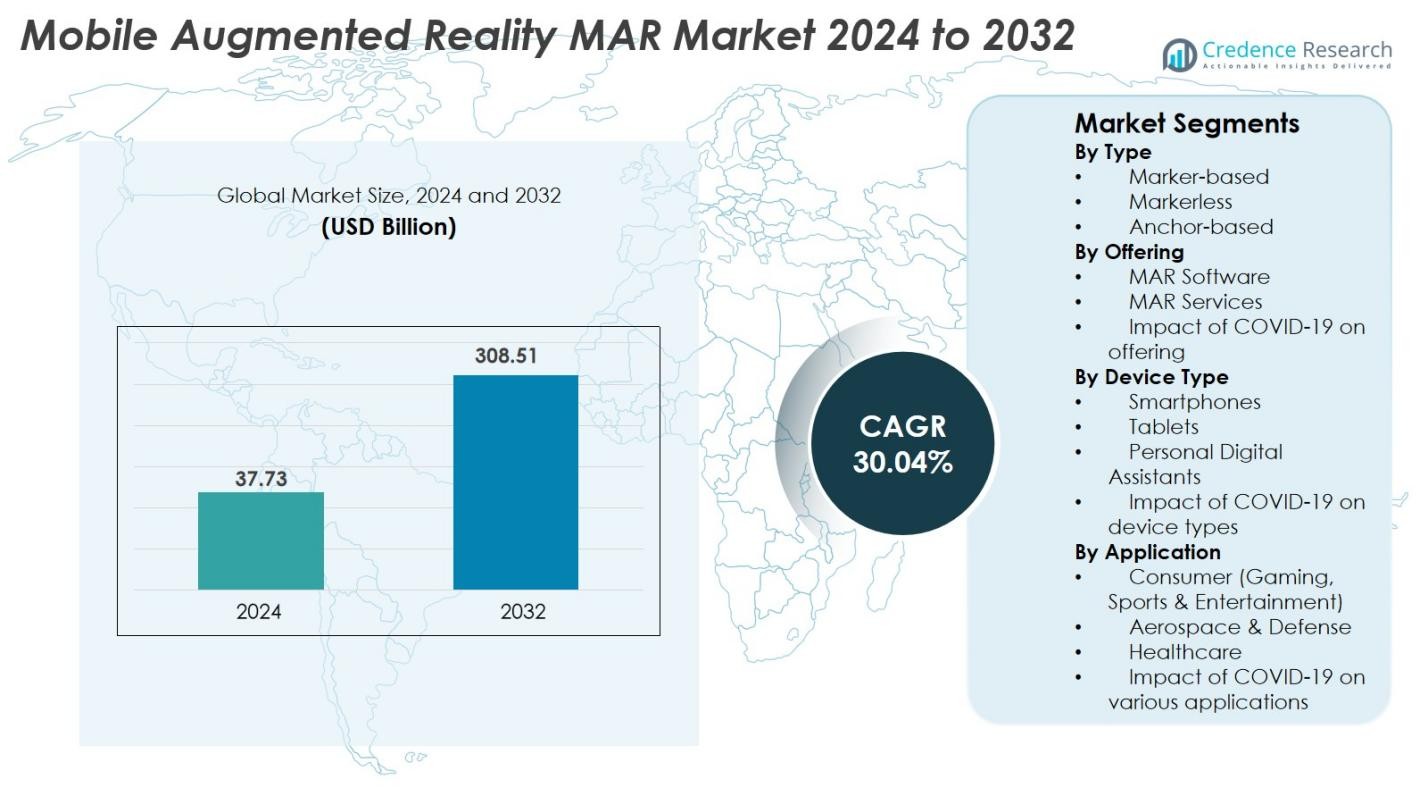
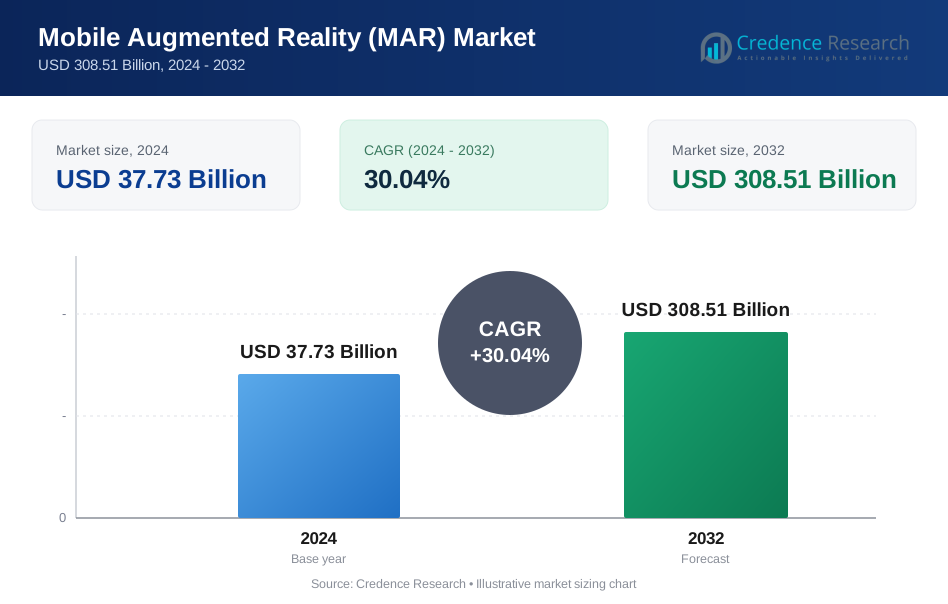
Mobile Augmented Reality (MAR) market size was valued at USD 37.73 Billion in 2024 and is anticipated to reach USD 308.51 Billion by 2032, at a CAGR of 30.04% during the forecast period.
| REPORT ATTRIBUTE | DETAILS |
|---|---|
| Historical Period | 2020-2023 |
| Base Year | 2024 |
| Forecast Period | 2025-2032 |
| Mobile Augmented Reality (MAR) market Size 2024 | USD 37.73 Billion |
| Mobile Augmented Reality (MAR) market , CAGR | 30.04% |
| Mobile Augmented Reality (MAR) market Size 2032 | USD 308.51 Billion |
Mobile Augmented Reality (MAR) Market is driven by leading players such as Google, Apple, Samsung Electronics, PTC, MAXST, Wikitude, Blippar, Magic Leap, Atheer, and Upskill, all of whom advance AR software frameworks, 3D visualization tools, and device innovations to expand adoption across consumer and enterprise applications. These companies focus on enhancing mobile AR experiences through improved computer vision, spatial mapping, and cloud-based rendering. Regionally, North America leads the MAR market with a 38% share, supported by strong technological infrastructure and early adoption. Asia-Pacific follows with a 29% share due to high smartphone penetration and strong AR engagement, while Europe holds a 27% share driven by enterprise and industrial AR deployments.
Market Insights
- The Mobile Augmented Reality (MAR) Market was valued at USD 37.73 Billion in 2024 and is projected to reach USD 308.51 Billion by 2032, expanding at a CAGR of 30.04%.
- Market growth is driven by rising AR-enabled smartphone adoption, expanding enterprise usage in training and maintenance, and increasing demand for immersive retail and e-commerce experiences.
- Key trends include rapid integration of AI and cloud rendering, growth in location-based AR applications, and rising adoption of markerless AR, which holds the largest segment share at 55% in 2024.
- The competitive landscape features strong innovation from Google, Apple, Samsung Electronics, PTC, MAXST, Wikitude, Blippar, Magic Leap, Atheer, and Upskill, focusing on AR platforms, SDKs, and mobile device enhancements.
- Regionally, North America leads with 38% share, followed by Asia-Pacific at 29% driven by gaming and social AR, and Europe at 27% due to strong enterprise adoption.
Market Segmentation Analysis
By Type
The Mobile Augmented Reality (MAR) market is primarily dominated by the markerless segment, holding 55% market share in 2024, driven by its flexibility, real-time scene recognition, and broad adoption across gaming, retail, and navigation applications. Marker-based AR continues to support training and industrial workflows, while anchor-based AR is gaining momentum for persistent overlays used in smart city and enterprise environments. The strong growth of markerless AR is propelled by rapid advancements in computer vision, spatial mapping, and mobile sensor technologies.
- For instance, markerless AR is widely used in gaming applications, where real-time spatial mapping enhances immersive experiences on smartphones.
By Offering
The MAR software segment leads the market with 62% share in 2024, supported by increasing demand for AR development platforms, 3D rendering engines, and immersive content creation tools across consumer and enterprise applications. Services are expanding as organizations adopt customized AR solutions for remote assistance, digital training, and interactive marketing. COVID-19 accelerated reliance on AR technologies for remote work and virtual engagement, further boosting software adoption. Growing investment in cloud-based AR authoring tools and XR SDKs continues to strengthen the segment’s dominance.
- For instance, Unity Technologies remains a key player with its AR Foundation platform, widely used for developing cross-platform AR applications that power games, retail, and education solutions.
By Device Type
Smartphones dominate the MAR market with 70% market share in 2024, driven by their global penetration, high-quality cameras, advanced processors, and native AR development support through ARCore and ARKit. Tablets hold a steady share as preferred devices in education, retail visualization, and enterprise training due to larger displays. Personal Digital Assistants remain limited to industrial and field service applications. COVID-19 significantly boosted smartphone-based AR usage as consumers increasingly adopted AR gaming, virtual try-ons, and remote shopping experiences.
Key Growth Driver
Rising Adoption of AR-Enabled Smartphones
The rapid penetration of AR-compatible smartphones remains a primary growth catalyst for the Mobile Augmented Reality (MAR) market, enabling widespread access to immersive digital experiences. Major phone manufacturers have integrated advanced processors, depth sensors, LiDAR scanners, and high-resolution cameras, enhancing AR rendering and real-time scene understanding. Platforms such as ARCore and ARKit have further democratized AR development, enabling developers to create high-quality mobile AR applications across gaming, retail, education, and navigation. Consumer demand for interactive content, virtual try-ons, indoor mapping, and social media filters continues to surge, making mobile devices the most accessible AR gateway. The shift toward 5G connectivity significantly accelerates AR adoption by lowering latency and enabling cloud-based rendering for complex environments. This combination of hardware evolution, global smartphone affordability, and rising AR-ready user bases continues to anchor sustained market expansion.
- For instance, platforms like Google ARCore and Apple ARKit have democratized AR development, allowing millions of users worldwide to access immersive applications such as virtual try-ons and social media filters via their smartphones.
Increasing Enterprise Adoption for Training and Remote Assistance
Enterprises across manufacturing, logistics, healthcare, and field services increasingly adopt mobile AR solutions to enhance workforce efficiency, accuracy, and operational safety. Mobile AR provides real-time overlays, guided workflows, and remote collaboration tools that reduce operational downtime and improve productivity. Training applications using AR-driven step-by-step instructions help organizations minimize training costs and accelerate employee onboarding. In field operations, technicians benefit from remote expert guidance via mobile AR, reducing service errors and enabling faster problem resolution. The growing focus on automation, digital transformation, and Industry 4.0 encourages enterprises to integrate AR into inspection, maintenance, and quality control processes. The scalability and lower cost of smartphone-based AR, compared to specialized headsets, make it more attractive for large-scale deployments. As industries prioritize operational efficiency and augmented workforce capabilities, enterprise-driven demand continues to elevate the growth trajectory of the MAR market.
- For instance, DHL incorporates AR-powered guided workflows and remote assistance in its logistics operations, helping technicians resolve issues faster and reducing operational downtime.
Expanding Use Cases in Retail, E-commerce, and Advertising
Mobile AR is transforming consumer engagement across retail and e-commerce by enabling virtual product try-ons, immersive catalogs, and in-store navigation. Retailers leverage AR to offer realistic visualization of products such as apparel, furniture, cosmetics, and accessories, improving purchase confidence and reducing return rates. Brands increasingly integrate AR into marketing campaigns through interactive advertisements, gamified experiences, and location-based activations that enhance customer engagement and conversion rates. The rise of social commerce platforms that embed AR filters and try-on features drives further adoption among digitally active consumers. E-commerce players benefit from AR-powered personalization, where mobile devices enable consumers to experience products at home before purchasing. As shoppers increasingly demand interactive and immersive digital experiences, mobile AR becomes a strategic tool for customer retention and brand differentiation, fueling growth across retail and marketing ecosystems.
Key Trend & Opportunity
Growth of Location-Based and Geo-AR Experiences
Location-based AR applications powered by GPS, visual positioning systems (VPS), and spatial anchors are emerging as a significant opportunity within the MAR market. These applications enable users to access AR overlays tied to real-world locations, supporting use cases in tourism, navigation, retail mapping, gaming, and urban planning. Advancements in 5G and cloud-edge architectures allow real-time rendering of large-scale AR environments, supporting multi-user interactions and persistent AR objects across cities. Retailers and advertisers increasingly use geo-AR for targeted promotions and personalized outdoor campaigns. Tourism boards and cultural institutions deploy AR storytelling to enhance visitor engagement with landmarks and historical sites. As urban infrastructures become digitally mapped, location-based AR opens a new frontier for smart cities and immersive consumer experiences. This trend creates broad commercial and public-sector opportunities while expanding the long-term ecosystem of mobile AR.
- For instance, Niantic’s Pokémon GO continues to popularize location-based AR gaming with persistent geospatial overlays enhancing user engagement worldwide.
Integration of AI and Cloud Technologies in AR Processing
The convergence of artificial intelligence and cloud rendering technologies presents a transformative opportunity for mobile AR applications. AI-driven object recognition, semantic segmentation, and spatial understanding significantly enhance AR accuracy and interaction quality. Cloud and edge computing enable mobile devices to offload complex rendering tasks, supporting high-fidelity AR visuals without straining device resources. This capability accelerates the development of enterprise-grade AR applications, including digital twins, remote collaboration, and large-scale 3D visualization. AI-enhanced AR analytics also support personalized content delivery, offering context-aware recommendations and adaptive experiences across retail, education, and entertainment. As cloud-based AR platforms evolve, they facilitate multi-user shared AR sessions, improving collaboration and engagement. The integration of AI and cloud technologies expands AR’s potential far beyond simple overlays, unlocking advanced enterprise and consumer opportunities.
- For instance, cloud and edge computing enhance mobile AR experiences by processing data-intensive tasks like spatial mapping, semantic understanding, and precise localization without taxing local device hardware. Niantic’s Lightship platform leverages these cloud services extensively, particularly through its Visual Positioning System (VPS), to enable precise, multi-user shared AR experiences that anchor virtual objects accurately in real space, although the final graphics rendering typically still occurs on the mobile device.
Key Challenge
Hardware Limitations and Device Fragmentation
Despite rapid progress, hardware limitations remain a significant challenge for the MAR market. AR performance heavily depends on device capabilities such as processing power, camera quality, depth sensing, and motion tracking accuracy. Variability across smartphone models and operating systems leads to inconsistent AR experiences, complicating application development and optimization. Mid- and low-tier devices often struggle to support advanced AR features, limiting the addressable user base in emerging markets. High battery consumption, overheating, and limited field depth also hinder prolonged AR usage. While premium devices integrate advanced sensors and LiDAR, mass-market adoption still relies on smartphones with basic AR capabilities. This fragmentation slows the development of universally compatible AR applications and increases development costs. Addressing these hardware constraints is essential for scalable and seamless mobile AR experiences.
Privacy, Security, and Data Protection Concerns
Mobile AR applications rely heavily on continuous data capture through cameras, sensors, GPS, and user interactions, raising significant privacy and security concerns. AR apps often process sensitive information including facial data, location details, and real-world surroundings, increasing the risk of data breaches and unauthorized access. Regulatory frameworks such as GDPR and CCPA impose strict data protection requirements, complicating global deployment strategies for AR developers. The blending of digital and physical environments presents new cybersecurity challenges, including spoofing, deepfakes, and manipulation of AR overlays. Users also express concerns over surveillance and misuse of camera-based data collection. Ensuring transparent data practices, secure storage, and robust encryption is critical for building user trust. Without strong privacy safeguards, consumer hesitation may slow the widespread adoption of mobile AR technologies.
Regional Analysis
North America North America holds 38% market share in the Mobile Augmented Reality (MAR) market, driven by strong technological infrastructure, high smartphone usage, and early adoption of AR for gaming, retail, and enterprise applications. Leading companies such as Google, Apple, and Magic Leap continue to advance AR capabilities through enhanced developer frameworks and device innovations. Rapid expansion of 5G supports low-latency AR experiences in navigation, entertainment, and remote collaboration. Enterprise investments in AR-based training, maintenance, and remote support further strengthen the region’s leadership, establishing North America as the most mature market for mobile AR adoption.
Europe
Europe accounts for 27% market share in the MAR market, supported by high adoption across automotive, industrial, education, tourism, and retail sectors. Countries like Germany, the UK, and France lead due to strong digital transformation programs and increasing use of AR in manufacturing workflows and workforce training. Retailers expand AR usage for immersive product visualization and virtual try-ons, while museums and tourism agencies deploy AR for enhanced visitor experiences. Growing 5G coverage and Industry 4.0 initiatives continue to elevate regional demand, positioning Europe as a major global contributor.
Asia-Pacific
Asia-Pacific holds 29% market share and remains the fastest-growing region in the MAR market due to high smartphone penetration, extensive 5G infrastructure, and rapid adoption in AR gaming, e-commerce, and social media. China, South Korea, India, and Japan dominate regional development with strong investments from companies like Samsung, MAXST, Xiaomi, and leading gaming studios. Retailers and online platforms accelerate AR-based virtual try-ons and interactive purchasing experiences. Rising digital engagement, smart city expansion, and a tech-driven youth population further strengthen MAR demand, making Asia-Pacific a major growth engine in the global market.
Latin America
Latin America holds 4% market share in the MAR market, supported by rising smartphone adoption and growing e-commerce penetration across Brazil, Mexico, and Argentina. Retailers increasingly use AR for virtual product visualization in fashion, cosmetics, and home décor categories. Younger consumers drive adoption through AR-enhanced social media, gaming, and digital marketing experiences. Schools and universities begin integrating AR learning tools to improve classroom interactivity. Although connectivity gaps persist in certain areas, expanding digital infrastructure and increasing enterprise interest are gradually supporting broader adoption throughout the region.
Middle East & Africa
The Middle East & Africa region holds 2% market share in the global MAR market and is experiencing steady growth through investments in smart city initiatives, tourism enhancement, and enterprise digitalization. Countries such as the UAE, Saudi Arabia, and South Africa lead adoption with AR-driven navigation, cultural experiences, and retail engagement. Expanding 5G networks enhance the performance of mobile AR applications, especially in urban centers. Enterprise sectors including construction, oil & gas, and utilities explore AR for remote support and workforce training. Rising digital transformation continues to unlock long-term MAR market potential.
Market Segmentations
By Type
- Marker-based
- Markerless
- Anchor-based
By Offering
- MAR Software
- MAR Services
- Impact of COVID-19 on offering
By Device Type
- Smartphones
- Tablets
- Personal Digital Assistants
- Impact of COVID-19 on device types
By Application
- Consumer (Gaming, Sports & Entertainment)
- Aerospace & Defense
- Healthcare
- Impact of COVID-19 on various applications
By Geography
- North America
- U.S.
- Canada
- Mexico
- Europe
- Germany
- France
- U.K.
- Italy
- Spain
- Rest of Europe
- Asia Pacific
- China
- Japan
- India
- South Korea
- South-east Asia
- Rest of Asia Pacific
- Latin America
- Brazil
- Argentina
- Rest of Latin America
- Middle East & Africa
- GCC Countries
- South Africa
- Rest of the Middle East and Africa
Competitive Landscape
The competitive landscape of the Mobile Augmented Reality (MAR) market is characterized by strong innovation, strategic partnerships, and continuous platform enhancements led by major global technology companies. Key players such as Google, Apple, Samsung Electronics, PTC, MAXST, Wikitude, Blippar, Magic Leap, Atheer, and Upskill focus on advancing AR software frameworks, cloud-based rendering, computer vision capabilities, and device-level integration to expand AR adoption across consumer and enterprise environments. Apple and Google dominate through ARKit and ARCore, enabling large developer ecosystems, while Samsung drives hardware innovation through AR-ready devices. Enterprise-focused companies like PTC, Atheer, and Upskill enhance AR use cases in training, maintenance, and remote assistance. European and Asian players, including Wikitude and MAXST, strengthen global competition with robust SDKs and scalable AR solutions. Growing investments in AI-enabled AR, spatial mapping, and 5G-driven applications continue to intensify competition, pushing companies to evolve rapidly to meet rising demand across retail, education, gaming, and industrial sectors.
Key Player Analysis
- MAXST (South Korea)
- Atheer (US)
- Blippar (UK)
- Apple (US)
- Wikitude (Austria)
- Google (US)
- Magic Leap (US)
- Samsung Electronics (South Korea)
- Upskill (US)
- PTC (US)
Recent Developments
- In October 2025, Samsung Electronics teased its Project Moohan mixed-reality headset running Android XR, developed in collaboration with Google and Qualcomm.
- In October 2025, Magic Leap announced a prototype reference design for Android XR smart glasses in partnership with Google.
- In May 2025, Meta Platforms and Anduril Industries announced a strategic partnership to develop advanced AR and XR systems for defense applications.
Report Coverage
The research report offers an in-depth analysis based on Type, Offering, Device Type Application, and Geography. It details leading market players, providing an overview of their business, product offerings, investments, revenue streams, and key applications. Additionally, the report includes insights into the competitive environment, SWOT analysis, current market trends, as well as the primary drivers and constraints. Furthermore, it discusses various factors that have driven market expansion in recent years. The report also explores market dynamics, regulatory scenarios, and technological advancements that are shaping the industry. It assesses the impact of external factors and global economic changes on market growth. Lastly, it provides strategic recommendations for new entrants and established companies to navigate the complexities of the market.
Future Outlook
- The MAR market will experience accelerated adoption as smartphones gain more advanced sensors and AR processing capabilities.
- Enterprises will increasingly integrate mobile AR into training, maintenance, and remote assistance workflows.
- Location-based and geo-enabled AR applications will expand across retail, tourism, and smart city initiatives.
- AI-driven enhancements will improve object recognition, spatial understanding, and personalized AR interactions.
- Cloud and edge computing will support more realistic, large-scale AR experiences on mobile devices.
- E-commerce platforms will adopt AR try-on and visualization tools as standard features.
- Social media and entertainment apps will drive mass-market engagement with AR effects and interactive content.
- Mobile AR will play a key role in education through immersive learning environments and interactive modules.
- Improved 5G connectivity will enable smoother, low-latency AR experiences with real-time rendering.
- Collaboration between hardware manufacturers and AR software developers will intensify, driving continual innovation across the ecosystem.
Request a Free Sample
Fill in your details and we'll send you a free sample report.
- Sample data tables & charts
- Research methodology
Need a Custom Version of This Report?
Tailor the scope, geography, or segments to your exact requirements.
- Custom geography or segment scope
- Direct access to our analyst team
Frequently Asked Questions
What is the current market size for Mobile Augmented Reality MAR Market, and what is its projected size in 2032?
At what Compound Annual Growth Rate is the Mobile Augmented Reality MAR Market projected to grow between 2025 and 2032?
Which Mobile Augmented Reality MAR Market segment held the largest share in 2024?
What are the primary factors fueling the growth of the Mobile Augmented Reality MAR Market?
Who are the leading companies in the Mobile Augmented Reality MAR Market?
Which region commanded the largest share of the Mobile Augmented Reality MAR Market in 2024?
Table of Content
Chapter 1. Report Introduction
- 1.1 Report Description & Purpose
- 1.1.1 Report Title & Market Definition
- 1.1.2 Unique Selling Propositions (USP) & Key Differentiators
- 1.1.3 Value Proposition for Stakeholders
- 1.2 Research Objectives
- 1.2.1 Market Sizing Objectives (Volume & Revenue)
- 1.2.2 Segmentation Objectives
- 1.2.3 Competitive Intelligence Objectives
- 1.2.4 Forecast & Scenario Objectives
- 1.3 Report Scope
- 1.3.1 Mobile Augmented Reality (MAR) Scope – Types & Subtypes Covered
- 1.3.2 Geographic Scope – Regions & Countries Covered
- 1.3.3 Historical Period, Base Year & Forecast Period (2024; forecast to 2032)
- 1.3.4 Inclusions & Exclusions
- 1.4 HS Code & Classification Framework
- 1.5 Currency, Units & Pricing Basis
- 1.6 Target Stakeholders
- 1.7 Limitations & Assumptions
Chapter 2. Executive Summary
- 2.1 Global Mobile Augmented Reality (MAR) Market Snapshot
- 2.1.1 Market Size – Historical (2024) & Forecast (2024-2032) (2024: USD 37.73 Billion → 2032: USD 308.51 Billion)
- 2.1.2 Volume & Revenue – Global Totals
- 2.1.3 Key Market Highlights – Top Five Facts
- 2.2 Mobile Augmented Reality (MAR) Market Segmentation Snapshot
- 2.2.1 Market Split by Region – 2024 vs. 2032
- 2.3 Competitive Snapshot
- 2.3.1 Top 10 Players by Revenue Share – 2024
- 2.3.2 Top 10 Players by Volume Share – 2024
- 2.3.3 Recent Strategic Developments (18-Month Summary)
- 2.4 Key Investment Highlights & Strategic Conclusions
Chapter 3. Mobile Augmented Reality (MAR) Market Dynamics & Industry Analysis
- 3.1 Market Overview & Context
- 3.1.1 Mobile Augmented Reality (MAR) Market Position in the Broader Automotive Value Chain
- 3.1.2 OEM vs. Replacement Market Dynamics
- 3.1.3 Market Maturity & Development Stage by Region
- 3.2 Mobile Augmented Reality (MAR) Market Drivers
- 3.3 Mobile Augmented Reality (MAR) Market Restraints & Challenges
- 3.4 Mobile Augmented Reality (MAR) Market Opportunities
- 3.5 Porter's Five Forces Analysis
- 3.5.1 Threat of New Entrants
- 3.5.2 Bargaining Power of Suppliers
- 3.5.3 Bargaining Power of Buyers
- 3.5.4 Threat of Substitutes
- 3.5.5 Competitive Rivalry – Intensity Assessment
- 3.6 Mobile Augmented Reality (MAR) Value Chain Analysis
- 3.6.1 Upstream – Raw Material/Input Suppliers
- 3.6.1.1 Raw Material/Input 1
- 3.6.1.2 Raw Material/Input 2
- 3.6.1.3 Raw Material/Input 3
- 3.6.2 Midstream – Production/Manufacturing/Service Delivery
- 3.6.2.1 Production/Process Overview
- 3.6.2.2 Key Facility Locations & Capacity by Manufacturer
- 3.6.3 Downstream – Distribution & End Consumer
- 3.6.3.1 Primary Channel – B2B/OEM
- 3.6.3.2 Secondary Channels – Dealer, Retail, Online, Direct
- 3.6.4 Value Chain Profitability Analysis
- 3.6.1 Upstream – Raw Material/Input Suppliers
- 3.7 PESTEL Analysis
- 3.7.1 Political Factors
- 3.7.2 Economic Factors
- 3.7.3 Social Factors
- 3.7.4 Technological Factors
- 3.7.5 Environmental Factors
- 3.7.6 Legal Factors
- 3.8 Mobile Augmented Reality (MAR) Supply Chain Analysis
- 3.8.1 Raw Material/Input Supply Risk Assessment
- 3.8.2 Manufacturing Concentration Risk (Geographic Exposure)
- 3.8.3 Trade Disruption Impact Analysis
- 3.9 Regulatory & Policy Landscape
Note: The regulatory and policy landscape section covers regulations based on their applicability to the market, Mobile Augmented Reality (MAR) category, geography, and scope of the study. Only regulatory frameworks with a material impact on operations, compliance, trade, sustainability, or market access are analyzed in detail.
Chapter 4. Key Investment Pockets & Opportunity Analysis
- 4.1 Mobile Augmented Reality (MAR) Market Attractiveness Analysis
- 4.1.1 By Region – Investment Attractiveness Matrix (Volume × CAGR)
- 4.2 Absolute Revenue Growth Opportunity
- 4.2.1 By Region – Absolute USD Growth Through 2032
- 4.3 Incremental Volume Opportunity
- 4.3.1 By Region – Incremental Volume Through 2032
- 4.3.2 Segment – Incremental Volume
- 4.4 Emerging Submarket Opportunity Deep Dive (Subject to Applicability)
- 4.5 Emerging Market Opportunity Scorecards
- 4.5.1 United States
- 4.5.2 Europe
- 4.5.3 Asia
- 4.5.4 Middle East & Africa
Note: Emerging Market Opportunity Scorecards will be included based on relevance and strategic importance. Regions listed are indicative and may vary depending on data availability and market dynamics.
Chapter 5. Mobile Augmented Reality (MAR) Import-Export Analysis & Trade Flows
- 5.1 Global Trade Overview
- 5.1.1 Global Export Value by Country (2024)
- 5.1.2 Global Export Volume by Country (2024)
- 5.1.3 Global Import Value by Country (2024)
- 5.1.4 Global Import Volume by Country (2024)
- 5.1.5 Net Trade Balance by Country (2024)
- 5.2 Export Analysis – Segment
- 5.2.1 Type 1 (HS Code)
- 5.2.2 Type 2 (HS Code)
- 5.2.3 Type 3 (HS Code)
- 5.2.4 Type 4 (HS Code)
- 5.2.5 Type 5 (HS Code)
- 5.3 Import Analysis – Segment
- 5.3.1 Type 1 (HS Code)
- 5.3.2 Type 2 (HS Code)
- 5.3.3 Type 3 (HS Code)
- 5.3.4 Type 4 (HS Code)
- 5.3.5 Type 5 (HS Code)
- 5.4 Average Unit Trade Prices
- 5.4.1 Average Export Price – Segment & Country
- 5.4.2 Average Import Price – Segment & Source Country
- 5.4.3 Price Trends (2024)
- 5.5 Key Trade Route Analysis
- 5.5.1 Trade Route 1
- 5.5.2 Trade Route 2
- 5.5.3 Trade Route 3
- 5.5.4 Trade Route 4
- 5.5.5 Trade Route 5
- 5.6 Trade Policy Impact Assessment
- 5.6.1 US Anti-Dumping & Section 301 Tariffs
- 5.6.2 EU Customs Union Impact
- 5.6.3 Major Free Trade Agreements
- 5.6.4 USMCA Rules of Origin
Note: Trade policy analysis will be included only where relevant to the Mobile Augmented Reality (MAR) market.
Chapter 6. Competitive Landscape & Company Benchmarking
- 6.1 Mobile Augmented Reality (MAR) Market Concentration & Structure
- 6.1.1 Herfindahl-Hirschman Index (HHI) – vs. 2024
- 6.1.2 Tier 1, Tier 2 & Tier 3 Market Structure
- 6.1.3 Global, Regional & Local Player Dynamics
- 6.2 Mobile Augmented Reality (MAR) Market Share Analysis – 2024
- 6.2.1 Global Revenue Share by Company
- 6.2.2 Global Volume Share by Company
- 6.2.3 Regional Revenue Share
- 6.2.4 Market Share Evolution ( vs. 2024)
- 6.2.5 OEM Segment Share by Company
- 6.2.6 Replacement Segment Share by Company
- 6.3 Production/Delivery Capacity & Facility Analysis
- 6.3.1 Global Installed Capacity
- 6.3.2 Capacity Utilization Rates
- 6.3.3 Production/Output Volume
- 6.3.4 Facility Locations & Capacity Map
- 6.3.5 Planned Capacity Additions
- 6.4 Mobile Augmented Reality (MAR) Competitive Benchmarking Matrix
- 6.4.1 Revenue, Volume, CAGR & Profitability Comparison
- 6.4.2 Channel Revenue Mix
- 6.4.3 Geographic Revenue Exposure
- 6.4.4 R&D Intensity
- 6.4.5 Sustainability Maturity
- 6.5 Strategic Developments in Mobile Augmented Reality (MAR) (Last 24 Months)
- 6.5.1 Mergers, Acquisitions & Divestments
- 6.5.2 New Mobile Augmented Reality (MAR) Launches
- 6.5.3 Facility Expansions
- 6.5.4 Strategic Alliances, Joint Ventures & Partnerships
- 6.5.5 Distribution Expansion & Market Entry
- 6.5.6 Sustainability & ESG Initiatives
- 6.6 Competitive Strategy Mapping
- 6.6.1 Leader, Challenger, Follower & Niche Classification
- 6.6.2 Pricing Strategy Comparison
- 6.6.3 Channel Strategy Matrix
Note: Strategic developments are included based on their materiality and the availability of reliable information.
Chapter 7. Global Mobile Augmented Reality (MAR) Market – By Distribution Channel
- 7.1 Segment Overview
- 7.1.1 Volume & Revenue Split by Channel (2024 & 2032)
- 7.1.2 Channel Mix Evolution (2024-2032)
Chapter 8. Regional Market Analysis – Global Overview
- 8.1 Global Regional Overview
- 8.1.1 Regional Volume Share
- 8.1.2 Regional Revenue Share
- 8.1.3 Regional Volume by Region
- 8.1.4 Regional Revenue by Region
- 8.1.5 Regional Forecast Through 2032
- 8.2 Cross-Regional Segment Analysis
- 8.2.1 By Distribution Channel
- 8.2.2 By Brand/Price Tier
Chapter 9. North America Mobile Augmented Reality (MAR) Market
- 9.1 United States
- 9.2 Canada
- 9.3 Mexico
Chapter 10. Europe Mobile Augmented Reality (MAR) Market
- 10.1 Germany
- 10.2 France
- 10.3 Italy
- 10.4 United Kingdom
- 10.5 Spain
- 10.6 Poland
- 10.7 Russia
- 10.8 Netherlands
- 10.9 Belgium
- 10.10 Sweden
- 10.11 Denmark
- 10.12 Norway
- 10.13 Rest of Europe
Chapter 11. Asia Pacific Mobile Augmented Reality (MAR) Market
- 11.1 China
- 11.2 India
- 11.3 Japan
- 11.4 South Korea
- 11.5 Thailand
- 11.6 Indonesia
- 11.7 Vietnam
- 11.8 Malaysia
- 11.9 Australia
- 11.10 Rest of Asia Pacific
Chapter 12. Latin America Mobile Augmented Reality (MAR) Market
- 12.1 Brazil
- 12.2 Argentina
- 12.3 Colombia
- 12.4 Chile
- 12.5 Rest of Latin America
Chapter 13. Middle East Mobile Augmented Reality (MAR) Market
- 13.1 Saudi Arabia
- 13.2 United Arab Emirates
- 13.3 Turkey
- 13.4 Israel
- 13.5 Iran
- 13.6 Rest of the Middle East
Chapter 14. Africa Mobile Augmented Reality (MAR) Market
- 14.1 South Africa
- 14.2 Egypt
- 14.3 Nigeria
- 14.4 Morocco
- 14.5 Rest of Africa
Chapter 15. Mobile Augmented Reality (MAR) Company Profiles
- 15.1 [Company 01]
- 15.1.1 Company Overview
- 15.1.2 Key Management Personnel
- 15.1.3 Products & Services Portfolio
- 15.1.4 Financial Performance
- 15.1.5 Key Market Focus & Geographic Presence
- 15.1.6 Recent Developments & Strategic Initiatives
Note: The company profile list is preliminary and may change based on research findings, market developments, data availability, and client requirements.
Chapter 16. Appendices
- Appendix A – List of Abbreviations & Acronyms
- Appendix B – Industry Classification Code Reference – Full Series
- Appendix C – Production & Capacity Data Tables
- Appendix D – End-Use & Demand Base Tables
- Appendix E – Consumption & Replacement Rate Assumptions
- Appendix F – ASP Reference Tables
- Appendix G – Manufacturing & Facility Database
- Appendix H – Import-Export Data Tables
- Appendix I – Regulatory Summary Tables
- Appendix J – Primary Research Participant List (Anonymized)
- Appendix K – Primary Research Questionnaire Framework
- Appendix L – Data Sources & Bibliography
- Appendix M – Market Size Divergence & Source Comparison
Chapter 17. Research Methodology
- 17.1 Research Framework & Philosophy
- 17.2 Secondary Research – Sources, Hierarchy & Data Extraction
- 17.3 Data Modeling – Bottom-Up & Top-Down Market Sizing
- 17.4 Primary Research – Stakeholder Framework, LOI & Sample Sizes
- 17.5 Forecast Methodology – Regression, Scenario & Sensitivity Analysis
- 17.6 Quality Control – Four-Layer Validation Framework
- 17.7 Limitations & Standard Assumptions
- 17.8 Disclaimer
