
Market Overview:
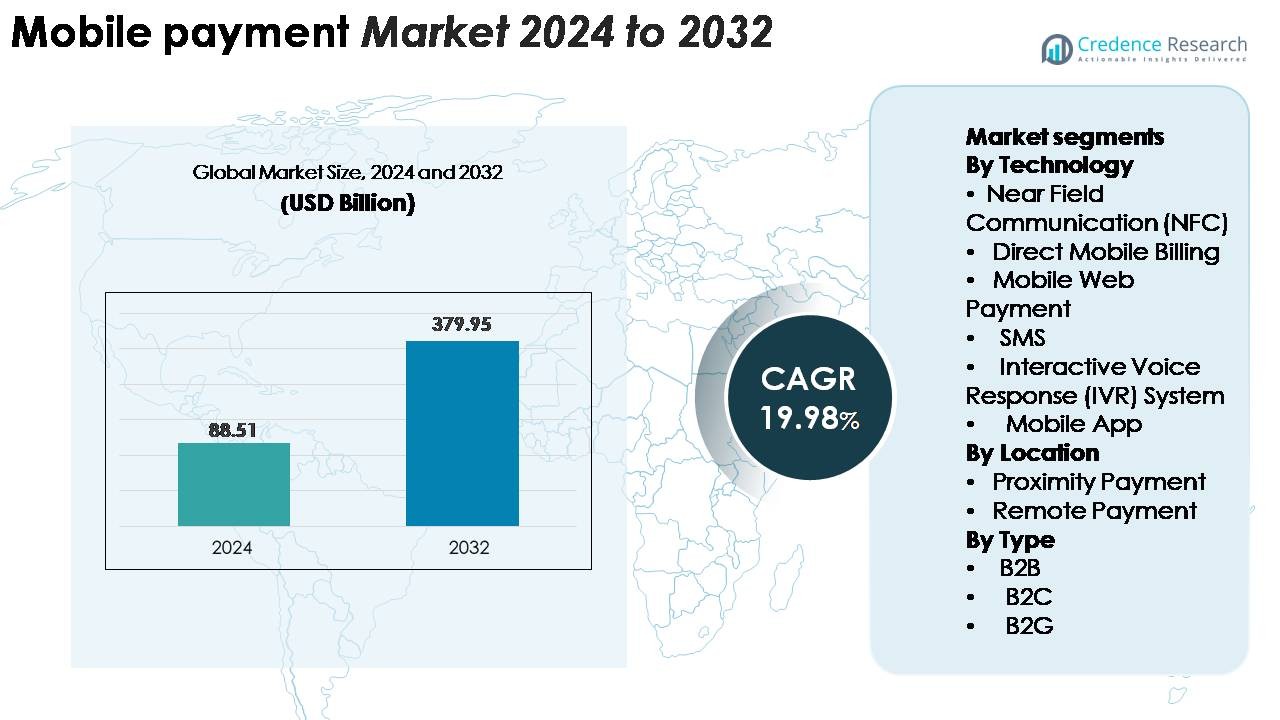
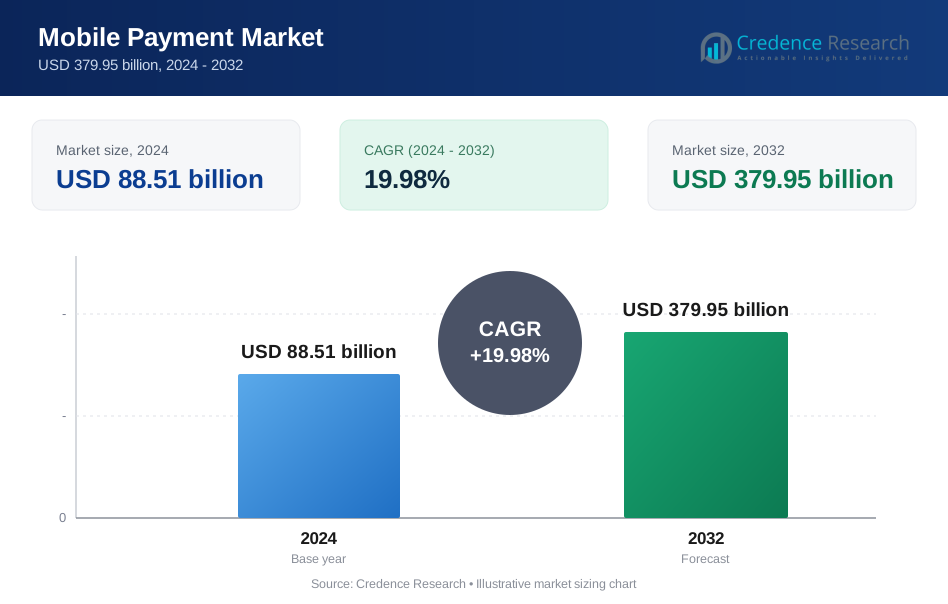
The global mobile payment market was valued at USD 88.51 billion in 2024 and is projected to reach USD 379.95 billion by 2032, advancing at a CAGR of 19.98% during the forecast period.
| REPORT ATTRIBUTE | DETAILS |
|---|---|
| Historical Period | 2020-2023 |
| Base Year | 2024 |
| Forecast Period | 2025-2032 |
| Mobile Payment Market Size 2024 | USD 88.51 Billion |
| Mobile Payment Market, CAGR | 19.98% |
| Mobile Payment Market Size 2032 | USD 379.95 Billion |
The mobile payment market is shaped by major technology leaders and payment networks such as Samsung Group, Visa, Google, Tencent (WeChat Pay), Apple, American Express, Square, Alibaba (Alipay), PayPal, and Mastercard, each expanding their digital ecosystems through, wallet integration, and merchant partnerships. These players compete by enhancing user experience, strengthening fraud prevention, and scaling acceptance across retail, e-commerce, transit secure authentication, and cross-border payments. Asia-Pacific leads the global market with a commanding 38–40% share, driven by super-apps, QR-based ecosystems, and rapid digitalization. North America follows with 32–34%, supported by high smartphone penetration, advanced POS infrastructure, and strong fintech innovation.
Market Insights:
- The global mobile payment market was valued at USD 88.51 billion in 2024 and is projected to reach USD 379.95 billion by 2032, expanding at a CAGR of 19.98% during the forecast period.
- Strong market growth is driven by rising digital wallet adoption, expanding e-commerce activity, and increasing merchant acceptance of contactless and QR-based solutions. NFC leads the technology segment with the highest share due to secure, tap-and-go convenience.
- Key trends include rapid integration of mobile payments into super-apps, growing use of biometric authentication, and widespread QR-code adoption enabling low-cost acceptance for small merchants.
- Competitive activity intensifies as global players such as Apple Pay, Google Pay, Alipay, PayPal, and WeChat Pay expand features, enhance security, and build interoperable ecosystems; however, data privacy concerns and fragmented infrastructure continue to restrain adoption in emerging regions.
- Regionally, Asia-Pacific leads with 38–40% share, followed by North America at 32–34% and Europe at 24–26%, supported by mature POS networks, regulatory modernization, and strong digital transaction penetration.
Market Segmentation Analysis:
By Technology
NFC leads the technology segment, capturing the largest share due to its secure authentication, rapid tap-to-pay convenience, and widespread integration into smartphones, wearables, and modern POS terminals. Retail, transit, and hospitality sectors increasingly rely on NFC to streamline checkout and reduce cash-handling time. Mobile app payments also expand quickly as wallet providers enhance user experience through biometric login, tokenization, and rewards-based ecosystems. Meanwhile, direct mobile billing, SMS, and IVR systems retain importance in regions with limited banking infrastructure, supporting basic transactions for unbanked and rural users.
· For instance, Apple Pay operates on ISO/IEC 14443 NFC standards at 13.56 MHz, enabling data exchange at up to 424 kbps, using a dedicated physical secure element (SE) for storing the device account number and executing cryptographic operations. In contrast, Google Pay utilizes Host Card Emulation (HCE) for token management and relies on the device's TEE or Android Keystore for security, while both platforms employ EMVCo network tokenization with dynamic cryptograms to authenticate each tap-to-pay transaction within milliseconds.
By Location
Remote payments remain the dominant location-based segment, supported by the explosive rise of online shopping, digital wallets, OTT subscriptions, and app-based financial services. Consumers favor remote transactions for their convenience, multi-channel accessibility, and integration with banking and e-commerce platforms. Proximity payments also grow steadily as NFC terminals, QR-code scanners, and contactless POS devices expand across supermarkets, restaurants, and transportation systems. Increasing acceptance among small merchants and widespread rollout of tap-and-pay infrastructure reinforce proximity adoption, though remote transactions continue to lead due to higher transaction volume and broader application across digital channels.
- For instance, PayPal processed 6.8 billion total payment transactions in Q4 2023 alone, while WeChat Pay supported over 1 billion digital transactions per day in China, reflecting the massive scale at which mobile payments operate across global digital ecosystems.
By Type
B2C dominates the type segment, accounting for the largest share as consumers increasingly shift to mobile wallets for retail purchases, bill payments, travel bookings, and peer-to-peer transfers. Seamless app interfaces, instant transaction settlement, and loyalty integrations make mobile payments central to everyday commerce. B2B transactions gain traction as enterprises adopt mobile invoicing, automated billing, and expense management tools to improve operational efficiency. B2G payments grow as governments digitize taxation, permit fees, and utility billing. However, B2C remains the primary driver, supported by rising smartphone penetration and merchant acceptance across urban and semi-urban markets.
Key Growth Drivers:
Expansion of Digital Wallet Adoption and Smartphone Penetration
Digital wallets have become the backbone of mobile payments, and their adoption continues to accelerate as consumers shift from cash and cards to app-based financial ecosystems. High smartphone penetration enables users to access wallet services without requiring additional hardware, while embedded security features such as biometric authentication, tokenization, and device-level encryption enhance user trust. Digital wallets increasingly integrate bill payments, ticketing, micro-lending, and loyalty programs, creating multifunctional platforms that drive daily engagement. Merchants accelerate adoption by offering exclusive discounts, faster checkout, and seamless integration with POS systems. The rise of super-app models in several markets further consolidates payment, commerce, and financial services, encouraging higher transaction frequencies. As ecosystems expand into P2P transfers, transit payments, and subscription services, digital wallets continue to anchor market growth.
· For instance, Apple Pay has over 650 million active users globally, while the broader WeChat ecosystem supports over 1.4 billion monthly active users (with an estimated 1.3 billion using WeChat Pay), demonstrating the massive scale at which digital wallets operate worldwide.
Accelerating E-commerce Expansion and Shift Toward Cashless Transactions
The expansion of e-commerce significantly boosts the mobile payment ecosystem as consumers prefer frictionless, instant checkout experiences on digital platforms. Retailers and marketplaces integrate mobile payment gateways to reduce cart abandonment and enhance customer retention. Mobile-optimized payment flows support one-click transactions, embedded checkout, and automated billing for repeat purchases. Emerging markets experience rapid growth as government initiatives encourage cashless transactions and financial inclusion. Mobile payments also benefit from rising digital consumption across entertainment, food delivery, travel, and hyperlocal services. Strengthened fraud-prevention tools and real-time transaction monitoring increase security confidence, further promoting adoption. As cross-border e-commerce grows, mobile wallets and app-based payments support fast currency conversion and simplified international transactions, becoming a critical enabler of global digital commerce expansion.
- For instance, Shopify processed $9.3 billion in total sales(Gross Merchandise Volume) during its 2023 peak shopping season (Black Friday Cyber Monday weekend). A significant portion of this activity occurs on mobile devices, with official statistics noting that roughly 79% of all traffic to Shopify stores originates from mobile and approximately 66% of all orders are placed from mobile phones.
Increasing Merchant Acceptance and Integration of Contactless Infrastructure
Merchant acceptance of mobile payments expands quickly as businesses adopt modern POS systems, NFC-enabled terminals, and QR-based payment interfaces. Small and medium enterprises increasingly adopt low-cost QR solutions, reducing dependence on traditional card-swiping hardware. Contactless infrastructure supports faster checkout, improved hygiene, and reduced queue times benefits that drive strong post-pandemic adoption. Retailers integrate inventory systems, analytics dashboards, and loyalty programs directly into mobile payment platforms, enabling data-driven marketing and personalized promotions. Transportation networks, parking systems, and quick-service restaurants reinforce NFC and QR payments, creating seamless physical-to-digital transaction experiences. As more merchants adopt omnichannel payment strategies, mobile payment solutions become essential for operational efficiency and consumer convenience, strengthening market momentum.
Key Trends and Opportunities:
Growing Integration of Mobile Payments with Embedded Finance and Super-Apps
Mobile payments increasingly integrate with embedded financial services, creating opportunities for cross-sector expansion. Super-apps consolidate payments, shopping, micro-insurance, travel, lending, and social features within a single interface, giving users an interconnected digital lifestyle experience. Embedded finance platforms allow businesses to incorporate payments, credit scoring, and risk assessment without traditional banking intermediaries. This trend opens avenues for subscription-based models, BNPL (Buy Now Pay Later), micro-lending, and automated savings tools. As fintechs collaborate with telecom operators and large retailers, embedded payment services extend into rural and underserved regions. The consolidation of digital commerce, mobility services, and entertainment platforms further amplifies transaction volumes and enhances monetization potential.
- For instance, Tencent’s WeChat ecosystem supports over 1.4 billion monthly active users, and its integrated financial services platform processed more than $15 trillion in transaction value annually (across hundreds of billions of individual transactions), demonstrating the massive operational scale of super-app–driven embedded finance.
Advancements in Tokenization, Biometrics, and Security-Driven Innovation
Security advancements form a major trend that shapes future opportunities in mobile payments. Tokenization reduces exposure to payment credentials by replacing sensitive card data with dynamic tokens, minimizing fraud risks. Biometric technologies including fingerprint scans, facial recognition, and voice authentication significantly improve user verification accuracy and reduce friction during checkout. AI-based behavioral analytics detect anomalies in real time, supporting risk-based authentication systems. These innovations strengthen consumer trust and accelerate adoption across high-frequency transaction environments such as retail and transportation. As regulators push for stronger data protection frameworks, providers increasingly embed security-by-design principles into payment architecture, opening opportunities for compliance-focused and privacy-centric mobile payment solutions.
- For instance, Apple’s Secure Enclave efficiently processes biometric data using a dedicated, isolated processor and hardware accelerators for cryptographic tasks, while Visa’s network tokenization system has issued over 13.7 billion active tokens globally, enabling dynamic, single-use authentication for every transaction.
Expansion of QR-Based Payments and Low-Cost Digital Acceptance Technologies
QR-based payments create new opportunities, especially in emerging markets where merchants seek low-cost, easy-to-deploy payment solutions. QR platforms require minimal infrastructure, enabling small retailers, street vendors, and service providers to accept digital payments without advanced terminals. Interoperable QR ecosystems strengthen competition and support cross-merchant usability, enhancing consumer convenience. Governments and payment networks increasingly promote national QR standards, fostering unified payment experiences. As QR systems integrate loyalty features, EMI options, and instant settlement capabilities, they expand beyond basic transfers to support broader commerce models, creating a scalable growth opportunity for payment providers.
Key Challenges:
Rising Cybersecurity Threats and Data Privacy Concerns
Mobile payment providers face escalating cybersecurity risks as transaction volumes increase and threat actors adopt more sophisticated attack methods. Phishing, malware, SIM swapping, and account takeovers continue to undermine user confidence in digital channels. Providers must strengthen multi-factor authentication, encrypted data transmission, and advanced fraud detection tools to maintain security. Compliance with stringent data protection laws requires investments in secure cloud infrastructure, audit mechanisms, and user-consent governance. Fragmented regulation across regions also complicates cross-border operations. Without robust security frameworks, mobile payment adoption risks slowing, particularly among first-time digital users and high-value enterprise clients.
Infrastructure Gaps and Limited Financial Inclusion in Emerging Regions
Despite rapid market growth, many regions still face infrastructure gaps that restrict mobile payment adoption. Limited smartphone affordability, inconsistent internet coverage, and low digital literacy hinder uptake in rural populations. Merchant networks in emerging markets often lack modern POS devices or bank account connectivity, reducing acceptance points for digital transactions. Cash dominance persists in sectors such as micro-retail, agriculture, and informal services. Regulatory inconsistencies and fragmented interoperability between payment platforms further restrict seamless transactions. Addressing these challenges requires coordinated efforts between fintechs, telecom operators, banks, and policymakers to expand infrastructure and improve consumer readiness.
Regional Analysis:
North America
North America holds around 34% of the global mobile payment market, driven by strong digital infrastructure, high smartphone penetration, and widespread adoption of contactless solutions. The U.S. leads regional growth as consumers increasingly adopt digital wallets for retail, entertainment, and transportation transactions. Financial institutions and fintechs expand mobile banking, P2P transfers, and biometric authentication, strengthening user trust. Retailers accelerate NFC, QR, and app-based checkout integration, boosting transaction volumes. Canada also contributes significantly through government-backed digital payment modernization, rising e-commerce purchases, and rapid adoption of embedded financial services across small and mid-sized enterprises.
Europe
Europe accounts for 26% of the global market, supported by strong regulatory frameworks, interoperability initiatives, and a mature contactless payment ecosystem. Countries such as the U.K., Germany, France, and the Nordics lead adoption as consumers shift toward app-powered banking, open-banking enabled payments, and secure biometric authentication. The region benefits from advanced POS infrastructure and the rapid expansion of QR-based and wallet-based payments in retail and mobility services. Regulatory programs promoting instant payments, cross-border digital commerce, and data protection further accelerate mobile payment uptake, making Europe one of the most structured digital transaction ecosystems globally.
Asia-Pacific
Asia-Pacific dominates the global landscape with 40% market share, driven by massive smartphone adoption, urban digitalization, and the rise of super-app ecosystems. China and India lead in transaction volume due to widespread QR-based payments, UPI-driven instant transfers, and integrated wallet ecosystems. Southeast Asian markets such as Indonesia, Vietnam, and the Philippines expand rapidly as fintechs collaborate with telecom operators to enhance financial access. Strong e-commerce growth, digital banking expansion, and government incentives to reduce cash transactions amplify adoption. The region’s large unbanked population presents additional opportunities for mobile-first financial services, sustaining long-term market momentum.
Latin America
Latin America captures around 8% of the global market, fueled by rapid fintech expansion, growing smartphone access, and rising demand for convenient, low-cost digital payment solutions. Brazil, Mexico, and Colombia lead adoption as consumers shift from cash to QR-based and app-based transactions for retail, mobility, and daily services. Government initiatives such as Brazil’s PIX instant payment system significantly accelerate mobile payment usage. Increasing merchant integration of digital solutions and expanding e-commerce ecosystems boost transaction growth. Despite economic fluctuations, the region’s strong fintech innovation fosters accelerated mobile payment adoption across both urban and semi-urban populations.
Middle East & Africa
The Middle East & Africa region holds 6% market share, but it represents one of the fastest-growing markets due to rising digital banking penetration, mobile money platforms, and government-led financial inclusion initiatives. Gulf countries including the UAE and Saudi Arabia lead adoption through contactless mandates, high POS modernization, and strong e-commerce activity. In Africa, mobile money platforms such as MFS solutions dominate due to limited traditional banking access, supporting P2P transfers, bill payments, and micro-commerce transactions. Investments in telecom-led digital infrastructure and cross-border payment modernization continue to strengthen the region’s mobile payment ecosystem.
Market Segmentations:
By Technology
- Near Field Communication (NFC)
- Direct Mobile Billing
- Mobile Web Payment
- SMS
- Interactive Voice Response (IVR) System
- Mobile App
By Location
- Proximity Payment
- Remote Payment
By Type
- B2B
- B2C
- B2G
By Geography
- North America
- U.S.
- Canada
- Mexico
- Europe
- Germany
- France
- U.K.
- Italy
- Spain
- Rest of Europe
- Asia Pacific
- China
- Japan
- India
- South Korea
- South-east Asia
- Rest of Asia Pacific
- Latin America
- Brazil
- Argentina
- Rest of Latin America
- Middle East & Africa
- GCC Countries
- South Africa
- Rest of the Middle East and Africa
Competitive Landscape:
The mobile payment market features an increasingly competitive landscape driven by the presence of global technology companies, payment networks, fintech innovators, telecom operators, and digital wallet providers. Leading firms focus on expanding user bases through secure, frictionless payment experiences supported by tokenization, biometric authentication, and AI-driven fraud detection. Established players strengthen their ecosystems by integrating bill payments, micro-lending, loyalty rewards, and subscription services to increase transaction frequency. Fintech disruptors intensify competition by deploying low-cost QR platforms and instant transfer solutions that appeal to small merchants and unbanked populations. Strategic partnerships between banks and digital platforms accelerate the rollout of contactless infrastructure and cross-border payment capabilities. Meanwhile, super-app ecosystems in Asia-Pacific and open-banking frameworks in Europe reshape competitive dynamics by enabling interoperability and multi-service convergence. As security, speed, and convenience become core differentiators, companies continuously invest in platform scalability, regulatory compliance, and value-added financial services to maintain market leadership.
Key Player Analysis:
- Samsung Group
- Visa, Inc.
- Google LLC
- Tencent Holdings (WeChat Pay)
- Apple Inc.
- American Express Company
- Square Inc.
- Alibaba Group (Alipay)
- Paypal Inc.
- Mastercard Inc.
Recent Developments:
- In October 2025, Samsung India introduced major enhancements to its Samsung Wallet platform, including UPI onboarding during device setup, PIN-free biometric authentication, and expanded global “Tap & Pay” capabilities for FOREX cards and online payments.
- In July 2025, Visa opened its first Africa-based data centre in Johannesburg and announced a broader investment plan to support digital payments infrastructure across the continent, improving payment processing and financial inclusion.
- In May 2025, Google unveiled a refreshed Google Pay API at Google I/O 2025 with new checkout flows, richer card visuals, dark-mode support, and enhanced developer capabilities to simplify integration and improve security.
Report Coverage:
The research report offers an in-depth analysis based on Technology, location, Type and Geography. It details leading market players, providing an overview of their business, product offerings, investments, revenue streams, and key applications. Additionally, the report includes insights into the competitive environment, SWOT analysis, current market trends, as well as the primary drivers and constraints. Furthermore, it discusses various factors that have driven market expansion in recent years. The report also explores market dynamics, regulatory scenarios, and technological advancements that are shaping the industry. It assesses the impact of external factors and global economic changes on market growth. Lastly, it provides strategic recommendations for new entrants and established companies to navigate the complexities of the market.
Future Outlook:
- Mobile payments will become the primary mode of daily transactions as consumers increasingly adopt wallet-based and contactless solutions.
- Digital identity, biometrics, and AI-driven fraud detection will significantly strengthen the security framework for mobile transactions.
- Super-app ecosystems will expand, integrating payments with mobility, e-commerce, entertainment, and financial services on a single platform.
- QR-based payments will continue to grow, especially in emerging markets seeking low-cost, interoperable digital acceptance methods.
- Cross-border mobile payments will accelerate as providers enhance currency conversion, global wallet interoperability, and instant settlement capabilities.
- Merchants will increasingly digitize operations, adopting mobile POS systems and embedded payment tools to enhance customer experience.
- Open-banking regulations will expand, enabling seamless connectivity between banks, fintechs, and wallet platforms.
- Mobile payments will increasingly support credit, micro-lending, and BNPL offerings, driving financial inclusion.
- Wearable-based payments will rise as smartwatches and fitness devices integrate secure NFC and tokenization technologies.
- Cloud-based infrastructure and real-time payment networks will enhance transaction speed, scalability, and reliability across markets.
Request a Free Sample
Fill in your details and we'll send you a free sample report.
- Sample data tables & charts
- Research methodology
Need a Custom Version of This Report?
Tailor the scope, geography, or segments to your exact requirements.
- Custom geography or segment scope
- Direct access to our analyst team
Frequently Asked Questions
What is the current market size for the Mobile Payment market, and what is its projected size in 2032?
At what Compound Annual Growth Rate is the Mobile Payment market projected to grow between 2024 and 2032?
Which Mobile Payment segment held the largest share in 2024?
What are the primary factors fueling the growth of the Mobile Payment market?
Who are the leading companies in the Mobile Payment market?
Which region commanded the largest share of the Mobile Payment market in 2024?
Table of Content
Chapter 1. Report Introduction
- 1.1 Report Description & Purpose
- 1.1.1 Report Title & Market Definition
- 1.1.2 Unique Selling Propositions (USP) & Key Differentiators
- 1.1.3 Value Proposition for Stakeholders
- 1.2 Research Objectives
- 1.2.1 Market Sizing Objectives (Volume & Revenue)
- 1.2.2 Segmentation Objectives
- 1.2.3 Competitive Intelligence Objectives
- 1.2.4 Forecast & Scenario Objectives
- 1.3 Report Scope
- 1.3.1 Mobile Payment Scope – Types & Subtypes Covered
- 1.3.2 Geographic Scope – Regions & Countries Covered
- 1.3.3 Historical Period, Base Year & Forecast Period (2024; forecast to 2032)
- 1.3.4 Inclusions & Exclusions
- 1.4 HS Code & Classification Framework
- 1.5 Currency, Units & Pricing Basis
- 1.6 Target Stakeholders
- 1.7 Limitations & Assumptions
Chapter 2. Executive Summary
- 2.1 Global Mobile Payment Market Snapshot
- 2.1.1 Market Size – Historical (2024) & Forecast (2024-2032) (2024: USD 88.51 billion → 2032: USD 379.95 billion)
- 2.1.2 Volume & Revenue – Global Totals
- 2.1.3 Key Market Highlights – Top Five Facts
- 2.2 Mobile Payment Market Segmentation Snapshot
- 2.2.1 Market Split by Region – 2024 vs. 2032
- 2.3 Competitive Snapshot
- 2.3.1 Top 10 Players by Revenue Share – 2024
- 2.3.2 Top 10 Players by Volume Share – 2024
- 2.3.3 Recent Strategic Developments (18-Month Summary)
- 2.4 Key Investment Highlights & Strategic Conclusions
Chapter 3. Mobile Payment Market Dynamics & Industry Analysis
- 3.1 Market Overview & Context
- 3.1.1 Mobile Payment Market Position in the Broader Automotive Value Chain
- 3.1.2 OEM vs. Replacement Market Dynamics
- 3.1.3 Market Maturity & Development Stage by Region
- 3.2 Mobile Payment Market Drivers
- 3.3 Mobile Payment Market Restraints & Challenges
- 3.4 Mobile Payment Market Opportunities
- 3.5 Porter's Five Forces Analysis
- 3.5.1 Threat of New Entrants
- 3.5.2 Bargaining Power of Suppliers
- 3.5.3 Bargaining Power of Buyers
- 3.5.4 Threat of Substitutes
- 3.5.5 Competitive Rivalry – Intensity Assessment
- 3.6 Mobile Payment Value Chain Analysis
- 3.6.1 Upstream – Raw Material/Input Suppliers
- 3.6.1.1 Raw Material/Input 1
- 3.6.1.2 Raw Material/Input 2
- 3.6.1.3 Raw Material/Input 3
- 3.6.2 Midstream – Production/Manufacturing/Service Delivery
- 3.6.2.1 Production/Process Overview
- 3.6.2.2 Key Facility Locations & Capacity by Manufacturer
- 3.6.3 Downstream – Distribution & End Consumer
- 3.6.3.1 Primary Channel – B2B/OEM
- 3.6.3.2 Secondary Channels – Dealer, Retail, Online, Direct
- 3.6.4 Value Chain Profitability Analysis
- 3.6.1 Upstream – Raw Material/Input Suppliers
- 3.7 PESTEL Analysis
- 3.7.1 Political Factors
- 3.7.2 Economic Factors
- 3.7.3 Social Factors
- 3.7.4 Technological Factors
- 3.7.5 Environmental Factors
- 3.7.6 Legal Factors
- 3.8 Mobile Payment Supply Chain Analysis
- 3.8.1 Raw Material/Input Supply Risk Assessment
- 3.8.2 Manufacturing Concentration Risk (Geographic Exposure)
- 3.8.3 Trade Disruption Impact Analysis
- 3.9 Regulatory & Policy Landscape
Note: The regulatory and policy landscape section covers regulations based on their applicability to the market, Mobile Payment category, geography, and scope of the study. Only regulatory frameworks with a material impact on operations, compliance, trade, sustainability, or market access are analyzed in detail.
Chapter 4. Key Investment Pockets & Opportunity Analysis
- 4.1 Mobile Payment Market Attractiveness Analysis
- 4.1.1 By Region – Investment Attractiveness Matrix (Volume × CAGR)
- 4.2 Absolute Revenue Growth Opportunity
- 4.2.1 By Region – Absolute USD Growth Through 2032
- 4.3 Incremental Volume Opportunity
- 4.3.1 By Region – Incremental Volume Through 2032
- 4.3.2 Segment – Incremental Volume
- 4.4 Emerging Submarket Opportunity Deep Dive (Subject to Applicability)
- 4.5 Emerging Market Opportunity Scorecards
- 4.5.1 United States
- 4.5.2 Europe
- 4.5.3 Asia
- 4.5.4 Middle East & Africa
Note: Emerging Market Opportunity Scorecards will be included based on relevance and strategic importance. Regions listed are indicative and may vary depending on data availability and market dynamics.
Chapter 5. Mobile Payment Import-Export Analysis & Trade Flows
- 5.1 Global Trade Overview
- 5.1.1 Global Export Value by Country (2024)
- 5.1.2 Global Export Volume by Country (2024)
- 5.1.3 Global Import Value by Country (2024)
- 5.1.4 Global Import Volume by Country (2024)
- 5.1.5 Net Trade Balance by Country (2024)
- 5.2 Export Analysis – Segment
- 5.2.1 Type 1 (HS Code)
- 5.2.2 Type 2 (HS Code)
- 5.2.3 Type 3 (HS Code)
- 5.2.4 Type 4 (HS Code)
- 5.2.5 Type 5 (HS Code)
- 5.3 Import Analysis – Segment
- 5.3.1 Type 1 (HS Code)
- 5.3.2 Type 2 (HS Code)
- 5.3.3 Type 3 (HS Code)
- 5.3.4 Type 4 (HS Code)
- 5.3.5 Type 5 (HS Code)
- 5.4 Average Unit Trade Prices
- 5.4.1 Average Export Price – Segment & Country
- 5.4.2 Average Import Price – Segment & Source Country
- 5.4.3 Price Trends (2024)
- 5.5 Key Trade Route Analysis
- 5.5.1 Trade Route 1
- 5.5.2 Trade Route 2
- 5.5.3 Trade Route 3
- 5.5.4 Trade Route 4
- 5.5.5 Trade Route 5
- 5.6 Trade Policy Impact Assessment
- 5.6.1 US Anti-Dumping & Section 301 Tariffs
- 5.6.2 EU Customs Union Impact
- 5.6.3 Major Free Trade Agreements
- 5.6.4 USMCA Rules of Origin
Note: Trade policy analysis will be included only where relevant to the Mobile Payment market.
Chapter 6. Competitive Landscape & Company Benchmarking
- 6.1 Mobile Payment Market Concentration & Structure
- 6.1.1 Herfindahl-Hirschman Index (HHI) – vs. 2024
- 6.1.2 Tier 1, Tier 2 & Tier 3 Market Structure
- 6.1.3 Global, Regional & Local Player Dynamics
- 6.2 Mobile Payment Market Share Analysis – 2024
- 6.2.1 Global Revenue Share by Company
- 6.2.2 Global Volume Share by Company
- 6.2.3 Regional Revenue Share
- 6.2.4 Market Share Evolution ( vs. 2024)
- 6.2.5 OEM Segment Share by Company
- 6.2.6 Replacement Segment Share by Company
- 6.3 Production/Delivery Capacity & Facility Analysis
- 6.3.1 Global Installed Capacity
- 6.3.2 Capacity Utilization Rates
- 6.3.3 Production/Output Volume
- 6.3.4 Facility Locations & Capacity Map
- 6.3.5 Planned Capacity Additions
- 6.4 Mobile Payment Competitive Benchmarking Matrix
- 6.4.1 Revenue, Volume, CAGR & Profitability Comparison
- 6.4.2 Channel Revenue Mix
- 6.4.3 Geographic Revenue Exposure
- 6.4.4 R&D Intensity
- 6.4.5 Sustainability Maturity
- 6.5 Strategic Developments in Mobile Payment (Last 24 Months)
- 6.5.1 Mergers, Acquisitions & Divestments
- 6.5.2 New Mobile Payment Launches
- 6.5.3 Facility Expansions
- 6.5.4 Strategic Alliances, Joint Ventures & Partnerships
- 6.5.5 Distribution Expansion & Market Entry
- 6.5.6 Sustainability & ESG Initiatives
- 6.6 Competitive Strategy Mapping
- 6.6.1 Leader, Challenger, Follower & Niche Classification
- 6.6.2 Pricing Strategy Comparison
- 6.6.3 Channel Strategy Matrix
Note: Strategic developments are included based on their materiality and the availability of reliable information.
Chapter 7. Global Mobile Payment Market – By Distribution Channel
- 7.1 Segment Overview
- 7.1.1 Volume & Revenue Split by Channel (2024 & 2032)
- 7.1.2 Channel Mix Evolution (2024-2032)
Chapter 8. Regional Market Analysis – Global Overview
- 8.1 Global Regional Overview
- 8.1.1 Regional Volume Share
- 8.1.2 Regional Revenue Share
- 8.1.3 Regional Volume by Region
- 8.1.4 Regional Revenue by Region
- 8.1.5 Regional Forecast Through 2032
- 8.2 Cross-Regional Segment Analysis
- 8.2.1 By Distribution Channel
- 8.2.2 By Brand/Price Tier
Chapter 9. North America Mobile Payment Market
- 9.1 United States
- 9.2 Canada
- 9.3 Mexico
Chapter 10. Europe Mobile Payment Market
- 10.1 Germany
- 10.2 France
- 10.3 Italy
- 10.4 United Kingdom
- 10.5 Spain
- 10.6 Poland
- 10.7 Russia
- 10.8 Netherlands
- 10.9 Belgium
- 10.10 Sweden
- 10.11 Denmark
- 10.12 Norway
- 10.13 Rest of Europe
Chapter 11. Asia Pacific Mobile Payment Market
- 11.1 China
- 11.2 India
- 11.3 Japan
- 11.4 South Korea
- 11.5 Thailand
- 11.6 Indonesia
- 11.7 Vietnam
- 11.8 Malaysia
- 11.9 Australia
- 11.10 Rest of Asia Pacific
Chapter 12. Latin America Mobile Payment Market
- 12.1 Brazil
- 12.2 Argentina
- 12.3 Colombia
- 12.4 Chile
- 12.5 Rest of Latin America
Chapter 13. Middle East Mobile Payment Market
- 13.1 Saudi Arabia
- 13.2 United Arab Emirates
- 13.3 Turkey
- 13.4 Israel
- 13.5 Iran
- 13.6 Rest of the Middle East
Chapter 14. Africa Mobile Payment Market
- 14.1 South Africa
- 14.2 Egypt
- 14.3 Nigeria
- 14.4 Morocco
- 14.5 Rest of Africa
Chapter 15. Mobile Payment Company Profiles
- 15.1 [Company 01]
- 15.1.1 Company Overview
- 15.1.2 Key Management Personnel
- 15.1.3 Products & Services Portfolio
- 15.1.4 Financial Performance
- 15.1.5 Key Market Focus & Geographic Presence
- 15.1.6 Recent Developments & Strategic Initiatives
Note: The company profile list is preliminary and may change based on research findings, market developments, data availability, and client requirements.
Chapter 16. Appendices
- Appendix A – List of Abbreviations & Acronyms
- Appendix B – Industry Classification Code Reference – Full Series
- Appendix C – Production & Capacity Data Tables
- Appendix D – End-Use & Demand Base Tables
- Appendix E – Consumption & Replacement Rate Assumptions
- Appendix F – ASP Reference Tables
- Appendix G – Manufacturing & Facility Database
- Appendix H – Import-Export Data Tables
- Appendix I – Regulatory Summary Tables
- Appendix J – Primary Research Participant List (Anonymized)
- Appendix K – Primary Research Questionnaire Framework
- Appendix L – Data Sources & Bibliography
- Appendix M – Market Size Divergence & Source Comparison
Chapter 17. Research Methodology
- 17.1 Research Framework & Philosophy
- 17.2 Secondary Research – Sources, Hierarchy & Data Extraction
- 17.3 Data Modeling – Bottom-Up & Top-Down Market Sizing
- 17.4 Primary Research – Stakeholder Framework, LOI & Sample Sizes
- 17.5 Forecast Methodology – Regression, Scenario & Sensitivity Analysis
- 17.6 Quality Control – Four-Layer Validation Framework
- 17.7 Limitations & Standard Assumptions
- 17.8 Disclaimer
