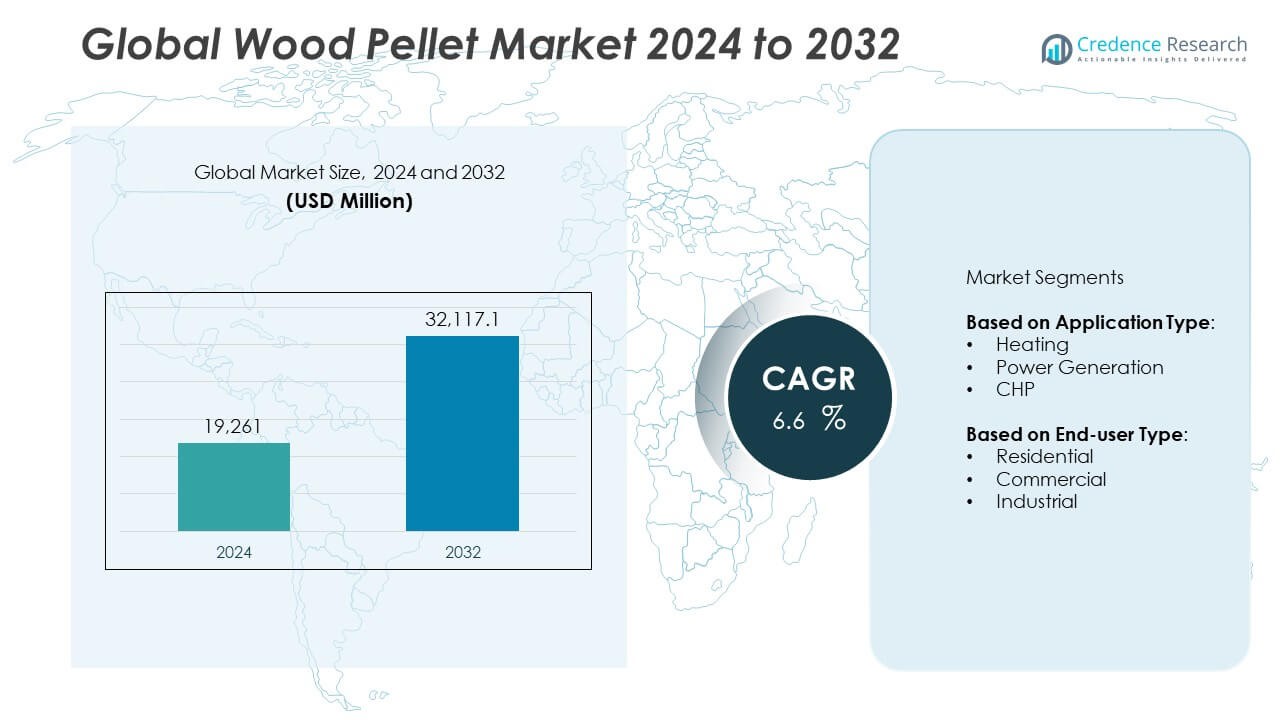
Home » Energy » Wood Pellets Market

Wood Pellets Market By Product (Forest Wood & Waste, Agriculture Residue, Others); By Application (Pellet Stove Inserts, Pellet Boilers, Free-standing Pellet Stoves); By End-user (Residential Commercial, Power Generation, Co-firing, Combined Heat and Power (CHP)) – Growth, Share, Opportunities & Competitive Analysis, 2024 – 2032

Price: $4999

Published: | Report ID: 6376 | Report Format : PDF
REPORT ATTRIBUTE DETAILS
Historical Period  2019-2022
Base Year  2023
Forecast Period  2024-2032
Wood Pellets Market Size 2023  USD 9,423.87 Million
Wood Pellets Market, CAGR  7.25%
Wood Pellets Market Size 2032  USD 17,693.14 Million

Market Overview

The global wood pellets market has emerged as a significant segment within the renewable energy sector, demonstrating substantial growth over the past decade. Wood pellets, made from compressed organic matter or biomass—primarily sawdust and other by-products from the wood manufacturing process—serve as a clean, sustainable, and highly efficient source of energy. The market’s appeal is further enhanced by its role in reducing greenhouse gas emissions compared to fossil fuels, positioning it as a key player in the global movement towards green energy solutions.

The wood pellets market was valued at USD 9,423.87 Million in 2023 and is anticipated to reach USD 17,693.14 Million by 2032 at 7.25% CAGR from 2024 to 2032. This growth trajectory is indicative of the increasing adoption of wood pellets for both residential heating and large-scale industrial power generation across Europe, North America, and parts of Asia. Europe stands out as the largest market, driven by stringent environmental regulations and significant investments in renewable energy infrastructure. North America follows, with a robust market growth fueled by the rising demand for clean energy solutions and the abundant availability of raw materials.

Wood pellets are a type of fuel made from sawdust and industrial wastes from the manufacturing of wood products such as furniture, construction, and milling lumber. They are considered a viable alternative to fossil fuels like natural gas or coal. Virgin trees are most suitable for producing wood pellets. Wood pellets are cylindrical in shape, with a diameter of 6–12 mm and a length of 1-3 cm. They are dry and can be easily stored. The hydraulic rate of wood pellets is stable compared to other biomass fuels. Moreover, wood pellets have a high energy density, making it possible to transport them over long distances. Wood pellets also emit lower amounts of carbon dioxide (CO2), making them a suitable alternative to fossil fuels.

The demand for renewable energy is a key factor driving the growth of the wood pellet market. Wood pellets are considered a source of renewable energy and are easily available, making them an important source of energy. Wood pellets are carbon dioxide (CO2) neutral, meaning the carbon released during the burning process is part of the natural carbon cycle. Wood pellets do not require a high initial investment, making them a suitable alternative to conventional fossil fuels. In 2021, U.S. energy-related carbon dioxide (CO2) emissions increased by 296 million metric tons (MMmt), or 6%, compared with 2020 levels. Global average atmospheric carbon dioxide was 417.06 parts per million (ppm) in 2022, setting a new record high.

Industries contribute significantly to the economic development and welfare of a country. However, the pollution emitted from industrial activities poses a significant threat to the environment. In the U.S., more than 5 billion metric tons of carbon dioxide (CO2) were generated from energy consumption in 2017. In 2022, U.S. greenhouse gas emissions totaled 6,341.2 million metric tons of carbon dioxide equivalents. Global energy-related carbon dioxide emissions rose by 6% in 2021 to 36.3 billion metric tons, their highest ever level. These factors have paved the way for the heightened demand for wood pellets.

However, rising construction activities have led to deforestation, which is a key factor restraining the growth of the market. Nearly 66,000 square kilometers of forest were lost in 2022. Over the decade since 2010, the net loss in forests globally has been 4.7 million hectares per year.

Design Element 2

Access crucial information at unmatched prices!

Request your free sample report today & start making informed decisions powered by Credence Research!

Download Free Sample
CTA Design Element 3

Key Market Drivers

The growth of the wood pellets market is driven by environmental, economic, and policy factors. The increasing global efforts to combat climate change have heightened the demand for renewable energy sources, positioning wood pellets as a favorable substitute for coal and natural gas in power generation and heating. This demand is underpinned by wood pellets’ carbon-neutral status, where the carbon dioxide released during combustion is balanced by the CO2 absorbed by newly planted trees. Such a characteristic aligns with international climate commitments, including the Paris Climate Accord, aimed at reducing carbon emissions.

Role of Government Policies and Technological Advancements

Furthermore, government policies and incentives are critical to fostering the wood pellet market. Various countries offer subsidies, tax benefits, and support for research and development to promote bioenergy use. For instance, the European Union’s Renewable Energy Directive, with its ambitious renewable energy consumption targets, is a notable example that benefits the wood pellet industry. Additionally, advancements in pellet production and combustion technologies have improved the efficiency and appeal of wood pellets as a fuel source, contributing to market expansion.

Increasing demand for clean energy generation

The global shift toward cleaner energy sources has propelled the demand for wood pellets. These small, cylindrical pellets are made from compressed sawdust, wood shavings, or other biomass materials. Their combustion produces significantly fewer greenhouse gas emissions compared to fossil fuels. As countries strive to meet climate goals and reduce their carbon footprint, wood pellets have emerged as a viable alternative. Notably, Europe has been at the forefront of adopting wood pellets for residential heating, industrial processes, and power generation.

Advantages of Wood Pellets

Wood pellets offer several advantages that contribute to their popularity. First, they exhibit consistent properties, including high energy content and uniform size. This standardization ensures efficient combustion and reliable performance. Second, their high density allows for easy storage and transportation. As a result, wood pellets are widely used in pellet stoves, boilers, and furnaces. Residential and commercial sectors appreciate their affordability and versatility for cooking, grilling, and space heating.

Potential to Replace Coal in Power Generation 

Wood pellets have the potential to play a crucial role in transitioning away from coal-based power generation. Co-firing wood pellets with coal in existing power plants can significantly reduce greenhouse gas emissions. For instance, in India, the total installed capacity for coal was 205,235 MW, which accounted for 49.1% of the total installed capacity as of May 2023. Recent advancements in thermal upgrading processes, such as torrefaction and hydrothermal carbonization, enhance wood pellets’ properties. These upgraded pellets can withstand the rigors of co-combustion, making them an attractive option for utilities seeking cleaner energy alternatives.

Asia-Pacific Opportunity 

The Asia-Pacific region, home to a substantial number of coal-fired power plants, presents a significant growth opportunity for the wood pellet market. Countries like China, Japan, and South Korea are actively exploring ways to diversify their energy mix. As they seek cleaner and more sustainable options, wood pellets emerge as a viable solution. However, challenges related to logistics, infrastructure, and supply chain development need to be addressed to fully tap into this potential. The Asia-Pacific wood pellet market is projected to grow at a CAGR of 6.5% during the forecast period of 2023–2032.

European Dominance 

Europe remains the epicenter of the wood pellet market. The region’s commitment to renewable energy and stringent environmental regulations have driven wood pellet consumption. European countries have established robust policies supporting biomass utilization, incentivizing both production and consumption. Additionally, the availability of sustainable forest resources contributes to Europe’s dominance in this sector. The European wood pellet market is expected to grow at a CAGR of more than 6% during the forecast period of 2022–2032.

Government Initiatives and Environmental Awareness Governments worldwide are actively promoting the adoption of renewable energy. Incentives, subsidies, and policy frameworks encourage the use of wood pellets for heat and electricity generation. Consumers and businesses are increasingly aware of the environmental impact of their energy choices. As a result, wood pellets gain favor as a renewable, carbon-neutral alternative.

Key Market Restraints

Despite the growing interest in renewable energy sources, awareness about wood pellets as a sustainable option remains relatively low in certain regions. This lack of awareness among consumers, businesses, and policymakers about the benefits and applications of wood pellets can impede market growth. Moreover, the presence of alternative renewable energy sources, such as solar photovoltaic, wind energy, and geothermal power, offers competition to wood pellets. As these alternatives become more prominent, they may challenge the demand for wood pellets.

Regulatory frameworks also significantly influence the wood pellets market. Compliance with sustainability, forest management, and emissions standards is essential, yet these requirements can introduce challenges. Stricter regulations may lead to increased production costs, affect supply chains, and restrict market expansion. While adherence to environmental guidelines is beneficial for sustainability, it can also be restrictive for businesses in the industry.

Additionally, wood pellets face competition from substitute cleaner fuels. Despite their advantages, such as standardized properties and high energy content, the availability of biomass alternatives, natural gas, and electric heating systems presents viable options for consumers. The choice among these fuels is often influenced by their availability and affordability, which can affect the adoption of wood pellets.

The wood pellet market has also benefited from government support through incentives, subsidies, and programs aimed at encouraging renewable energy adoption. However, the potential evolution or expiration of these support mechanisms could introduce uncertainty into the market. A reduction in government financial assistance can adversely affect production, distribution, and the overall dynamics of the wood pellet industry, leading to fluctuations in market stability and growth.

Market Opportunities

  1. Expansion into Emerging Markets: Growing awareness and adoption of renewable energy in emerging economies present untapped opportunities for market expansion.
  2. Advancements in Pellet Production Technology: Innovations that improve efficiency and reduce costs can make wood pellets more competitive against other energy sources.
  3. Integration with Existing Heating Systems: Developing solutions that facilitate the use of wood pellets in existing heating systems could broaden their market.
  4. Industrial and Commercial Heating Applications: Beyond residential heating, there’s significant potential in industrial and commercial settings, where the demand for sustainable energy solutions is rising.
  5. Co-firing with Coal in Power Generation: Co-firing wood pellets with coal in existing power plants offers a transitional strategy towards cleaner energy, with substantial market potential.
  6. Development of Specialized Pellets: Creating pellets tailored for specific applications, such as high-energy or low-emission variants, could meet diverse consumer needs.
  7. Strategic Partnerships and Alliances: Collaborations between pellet producers, technology providers, and distribution networks can enhance market reach and efficiency.

Segmentations:

By Product

  • Forest Wood & Waste
  • Agriculture Residue
  • Others

By Application

  • Pellet stove inserts
  • Pellet Boilers
  • Free-standing pellet stoves

By End-user

  • Residential Commercial
  • Power Generation
  • Co-firing
  • Combined Heat and Power (CHP)

Top Leading Players

  • Energex
  • Enviva LP
  • Graanul Invest
  • Drax Biomass
  • Pinnacle
  • Sinclar Group Forest Products
  • Lauzon
  • Wood Pellet Energy (UK) Ltd.
  • United Company
  • Highland Pellets LLC
  • Groupe Savoie Inc.
  • C.S. (Lacroix) Lumber Inc.
  • Vermont Wood Pellet Company
  • AVPGroup
  • Farm Fuels
  • Others

Competitive Landscape

The competitive landscape of the wood pellet market is characterized by a mix of large multinational corporations and small to medium-sized enterprises. Market leaders such as Enviva Partners and Drax Group have established extensive production and supply chain networks. For instance, Enviva Partners, a key player in the wood pellet industry, produced approximately 3.5 million metric tons of wood pellets in 2023.

Competition is based on production capacity, sustainability certifications, and the ability to secure long-term contracts with utilities and heating customers. For example, Drax Group, another significant player, has been able to secure long-term contracts due to its sustainability certifications and large production capacity. The company has a production capacity of over 2 million tons per year and has secured contracts with several large utilities across Europe.

Recent Developments:

  • In November 2019, Pinnacle Renewable Holdings inked a partnership with Tolko Industries Ltd. to establish a wood pellet manufacturing facility in Alberta, Canada. Expected to start operations in the fourth quarter of 2020, this facility aims to diversify the company’s fiber supply by primarily sourcing high-quality wood fiber from Tolko’s sawmill in Canada.
  • In October 2019, Pinnacle Renewable Energy secured a contract with Mitsui and Co., to supply 100,000 metric tons per year of industrial wood pellets for a new biomass energy project in Japan, starting in 2023. This agreement marks a significant step for Pinnacle in expanding its footprint across the Asia Pacific region. In the same month, Enviva Partners LP announced a substantial investment of US$ 175 million in a new wood pellet production facility at the Port of Epes Industrial Park in Epes, Alabama, U.S., aiming to bolster its presence in the United States.
  • In February 2020, An Viet Phat Energy Co., LTD declared its intention to construct a US$ 51.6 million timber processing factory within the Vung Ang economic zone located in Ky Anh Township, Ha Tinh Province, on the north-central coast of Vietnam. The facility, boasting an annual production capacity of 187,200 tons, highlights the company’s commitment to expanding its manufacturing capabilities.
  • In April 2018, The Westervelt Company announced an expansion plan for its lumber manufacturing capacity in South Alabama, U.S. This new mill is projected to produce 250 million board feet of lumber annually, signifying the company’s effort to strengthen its regional presence in North America.
  • In 2021, Drax Group PLC, a leading energy company in the United Kingdom, acquired Canada-based wood pellet producer Pinnacle Renewable Energy Inc. in February. This acquisition expanded Drax’s portfolio to include 17 pellet plants and development projects, significantly enhancing its production capabilities. In April of the same year, Enviva and Mitsui OSK Lines (MOL) entered into a Memorandum of Understanding (MoU) to develop and deploy an environmentally friendly bulk carrier, emphasizing the partners’ dedication to sustainable marine transport solutions.
  • In June 2022, Mitrabara Adiperdana (MBAP) commence construction of its inaugural wood pellet plant through its subsidiary MalinauHijau Lestari, marking the company’s venture into the renewable energy sector. With a production capacity of at least 120,000 tons per year, the facility is anticipated to become operational in the first quarter of 2024.
  • In October 2022, Enviva Inc. published a white paper exploring the use of biomass in industries beyond fossil fuels, including steel, cement, lime, chemicals, and sustainable aviation fuel (SAF). This publication underscores the versatility and potential of wood biomass in contributing to a range of sustainable industrial processes.

Regional Analysis

North America

North America, particularly the United States and Canada, is a significant producer and consumer of wood pellets. The region’s vast forestry resources provide an ample supply of raw materials for pellet production. In the U.S., the demand for wood pellets is primarily for residential heating and, to a lesser extent, for power generation. Canada exports a substantial portion of its wood pellet production to Europe and Asia, driven by strong international demand. Environmental policies and the shift towards renewable energy sources are key drivers for the wood pellet market in North America.

Europe

Europe is the epicenter of the global wood pellet market, both in terms of demand and regulatory support. The European Union’s commitment to reducing carbon emissions and increasing the share of renewable energy sources has led to significant growth in the wood pellet industry. Countries like the UK, Italy, Germany, and Sweden are major consumers, using wood pellets for residential heating, industrial energy, and power generation. The EU’s Renewable Energy Directive provides a regulatory framework that supports the use of biomass, including wood pellets. Europe also leads in sustainability and certification standards for wood pellets.

Asia-Pacific

The Asia-Pacific region presents a rapidly growing market for wood pellets, driven by the need to diversify energy sources and reduce reliance on coal. Countries like South Korea, Japan, and China have shown increasing interest in wood pellets for power generation and industrial heating. The demand in this region is primarily driven by government policies aimed at reducing greenhouse gas emissions and increasing the use of renewable energy. However, the market faces challenges such as developing the supply chain, infrastructure, and ensuring the sustainability of raw materials.

Latin America

Latin America has the potential to become a significant player in the wood pellet market, thanks to its extensive forestry resources and growing interest in renewable energy. Countries like Brazil and Chile are emerging as potential producers of wood pellets, aiming to serve both domestic and international markets. However, the region’s wood pellet industry is still in its developmental stages, with challenges in market structure, logistics, and policy support to be addressed.

Russia and Eastern Europe

Russia and Eastern European countries possess vast forest resources, making them potential key suppliers of wood pellets. The demand in these regions is primarily for export, particularly to the European market. However, the development of the wood pellet market in these areas is influenced by factors such as infrastructure, investment, and regulatory environment. There’s a growing interest in utilizing wood pellets for domestic heating and power generation as well.

 Interesting Facts About the Market

  1. The energy content of wood pellets is approximately 4.7–5.2 MWh/ton, making them a highly efficient fuel source. For instance, the energy content of one ton of pellets is approximately 4,700–4,900 kWh.
  2. Sweden was one of the first countries to adopt wood pellets for heating on a large scale in the 1980s.
  3. The global wood pellet trade has more than doubled in the past decade, reflecting the growing demand across continents.
  4. Wood pellets produce about 0.01% to 0.03% ash per ton of fuel, significantly lower than coal. For instance, under the European EN Plus A1 premium quality specifications, ash production must be below 0.7%.
  5. The use of wood pellets can reduce heating costs by up to 50% compared to fossil fuels in some regions. For instance, pellets have 17,200,000 BTUs per ton at an average of $350/ton with an average use of 4 tons in a heating season.
  6. The United Kingdom is one of the largest consumers of wood pellets, driven by its biomass power generation policies. For instance, in 2019, the UK consumed 9.2 million metric tons of wood pellets.
  7. Wood pellet production is highly efficient, with a conversion efficiency of over 90% from raw material to finished product. For instance, wood fibers used for wood pellet production were derived from wood processing co-products such as chips and particles (47.8%) and directly from forests (52.2%).
  8. The port of Rotterdam is a major hub for the international wood pellet trade, facilitating shipments across Europe and beyond. For instance, in 2022, wood pellet exports from the Netherlands soared to 379K tons, growing by 44% compared with the previous year’s figure.
  9. North America’s vast forest resources provide a significant raw material base for wood pellet production. For instance, wood pellet production capacity reached 20 million metric tons in North America in 2021.
  10. The development of torrefied wood pellets, which have higher energy content and water resistance, represents a future growth area for the market.

Shape Your Report to Specific Countries or Regions & Enjoy 30% Off!

Future Outlook

  1. Increasing demand for renewable energy sources will continue to drive market growth.
  2. Technological innovations in production and combustion will enhance the efficiency and environmental profile of wood pellets.
  3. Expansion into new markets, particularly in Asia and Africa, as they seek sustainable energy sources.
  4. Greater emphasis on sustainability and carbon neutrality in corporate and governmental policies will favor the wood pellets market.
  5. The development of more sophisticated logistics networks will improve the global distribution of wood pellets.
  6. Continued R&D could lead to the development of next-generation wood pellets with higher energy content and lower emissions.
  7. Potential challenges include raw material availability and competition from other renewable energy sources.
  8. The role of wood pellets in achieving net-zero emissions targets will become increasingly prominent.
  9. The regulatory landscape will evolve to further support the growth of the wood pellets market.
  10. New applications for wood pellets, beyond energy production, will emerge as technology advances.

Table of Content
CHAPTER NO. 1 : INTRODUCTION 23
1.1.1. Report Description 23
Purpose of the Report 23
USP & Key Offerings 23
1.1.2. Key Benefits for Stakeholders 23
1.1.3. Target Audience 24
1.1.4. Report Scope 24
1.1.5. Regional Scope 25
CHAPTER NO. 2 : EXECUTIVE SUMMARY 26
2.1.1. Wood Pellets Market Snapshot 26
2.1.2. Global Wood Pellets Market, 2018 – 2032 (Kilo Tons) (USD Million) 28
2.1.3. Insights from Primary Respondents 29
CHAPTER NO. 3 : GEOPOLITICAL CRISIS IMPACT ANALYSIS 30
3.1.1. Russia-Ukraine and Israel-Palestine War Impacts 30
CHAPTER NO. 4 : WOOD PELLETS MARKET – INDUSTRY ANALYSIS 31
4.1.1. Introduction 31
4.1.2. Market Drivers 32
4.1.3. Driving Factor 1 Analysis 32
4.1.4. Driving Factor 2 Analysis 33
4.1.5. Market Restraints 34
4.1.6. Restraining Factor Analysis 34
4.1.7. Market Opportunities 35
4.1.8. Market Opportunity Analysis 35
4.1.9. Porter’s Five Forces Analysis 36
4.1.10. Value Chain Analysis 37
4.1.11. Buying Criteria 38
CHAPTER NO. 5 : IMPORT EXPORT ANALYSIS 39
5.1.1. Import Analysis by Region 39
5.1.2. Global Wood Pellets Market Import Volume/Revenue, By Region, 2018 – 2023 39
5.1.3. Export Analysis by Region 40
5.1.4. Global Wood Pellets Market Export Volume/Revenue, By Region, 2018 – 2023 40
CHAPTER NO. 6 : DEMAND SUPPLY ANALYSIS 41
6.1.1. Demand Analysis by Region 41
6.1.2. Global Wood Pellets Market Demand Volume/Revenue, By Region, 2018 – 2023 41
6.1.3. Supply Analysis by Region 42
6.1.4. Global Wood Pellets Market Supply Volume/Revenue, By Region, 2018 – 2023 42
CHAPTER NO. 7 : PRICE ANALYSIS 43
7.1.1. Price Analysis by Region 43
7.1.2. Global Wood Pellets Market Price, By Region, 2018 – 2023 43
7.1.3. Global Product Market Price, By Region, 2018 – 2023 43
7.1.4. Price Analysis by Product 44
7.1.5. Global Wood Pellets Market Price, By Product, 2018 – 2023 44
7.1.6. Global Product Market Price, By Product, 2018 – 2023 44
CHAPTER NO. 8 : ANALYSIS COMPETITIVE LANDSCAPE 45
8.1.1. Company Market Share Analysis – 2023 45
8.1.2. Global Wood Pellets Market: Company Market Share, by Volume, 2023 45
8.1.3. Global Wood Pellets Market: Company Market Share, by Revenue, 2023 46
8.1.4. Global Wood Pellets Market: Top 6 Company Market Share, by Revenue, 2023 46
8.1.5. Global Wood Pellets Market: Top 3 Company Market Share, by Revenue, 2023 47
8.1.6. Global Wood Pellets Market Company Volume Market Share, 2023 48
8.1.7. Global Wood Pellets Market Company Revenue Market Share, 2023 49
8.1.8. Company Assessment Metrics, 2023 50
8.1.9. Stars 50
8.1.10. Emerging Leaders 50
8.1.11. Pervasive Players 50
8.1.12. Participants 50
8.1.13. Start-ups /SMEs Assessment Metrics, 2023 50
8.1.14. Progressive Companies 50
8.1.15. Responsive Companies 50
8.1.16. Dynamic Companies 50
8.1.17. Starting Blocks 50
8.1.18. Strategic Developments 51
8.1.19. Acquisitions & Mergers 51
New Product Launch 51
Regional Expansion 51
8.1.20. Key Players Product Matrix 52
CHAPTER NO. 9 : PESTEL & ADJACENT MARKET ANALYSIS 53
9.1.1. PESTEL 53
9.1.2. Political Factors 53
9.1.3. Economic Factors 53
9.1.4. Social Factors 53
9.1.5. Technological Factors 53
9.1.6. Environmental Factors 53
9.1.7. Legal Factors 53
9.1.8. Adjacent Market Analysis 53
CHAPTER NO. 10 : WOOD PELLETS MARKET – BY PRODUCT SEGMENT ANALYSIS 54
10.1.1. Wood Pellets Market Overview, by Product Segment 54
10.1.2. Wood Pellets Market Volume Share, By Product, 2023 & 2032 55
10.1.3. Wood Pellets Market Revenue Share, By Product, 2023 & 2032 55
10.1.4. Wood Pellets Market Attractiveness Analysis, By Product 56
10.1.5. Incremental Revenue Growth Opportunity, by Product, 2024 – 2032 56
10.1.6. Wood Pellets Market Revenue, By Product, 2018, 2023, 2027 & 2032 57
10.1.7. Forest Wood & Waste 58
10.1.8. Global Forest Wood & Waste Wood Pellets Market Volume & Revenue, By Region, 2018 – 2023 (Kilo Tons) (USD Million) 59
10.1.9. Global Forest Wood & Waste Wood Pellets Market Volume & Revenue, By Region, 2024 – 2032 (Kilo Tons) (USD Million) 59
10.1.10. Agriculture Residue 60
10.1.11. Global Agriculture Residue Wood Pellets Market Volume & Revenue, By Region, 2018 – 2023 (Kilo Tons) (USD Million) 61
10.1.12. Global Agriculture Residue Wood Pellets Market Volume & Revenue, By Region, 2024 – 2032 (Kilo Tons) (USD Million) 61
10.1.13. Others 62
10.1.14. Global Others Wood Pellets Market Volume & Revenue, By Region, 2018 – 2023 (Kilo Tons) (USD Million) 63
10.1.15. Global Others Wood Pellets Market Volume & Revenue, By Region, 2024 – 2032 (Kilo Tons) (USD Million) 63
CHAPTER NO. 11 : WOOD PELLETS MARKET – BY APPLICATION SEGMENT ANALYSIS 64
11.1.1. Wood Pellets Market Overview, by Application Segment 64
11.1.2. Wood Pellets Market Volume Share, By Application, 2023 & 2032 65
11.1.3. Wood Pellets Market Revenue Share, By Application, 2023 & 2032 65
11.1.4. Wood Pellets Market Attractiveness Analysis, By Application 66
11.1.5. Incremental Revenue Growth Opportunity, by Application, 2024 – 2032 66
11.1.6. Wood Pellets Market Revenue, By Application, 2018, 2023, 2027 & 2032 67
11.1.7. Pellet stove inserts 68
11.1.8. Global Pellet stove inserts Wood Pellets Market Volume & Revenue, By Region, 2018 – 2023 (Kilo Tons) (USD Million) 69
11.1.9. Global Pellet stove inserts Wood Pellets Market Volume & Revenue, By Region, 2024 – 2032 (Kilo Tons) (USD Million) 69
11.1.10. Pellet Boilers 69
11.1.11. Global Pellet Boilers Wood Pellets Market Volume & Revenue, By Region, 2018 – 2023 (Kilo Tons) (USD Million) 71
11.1.12. Global Pellet Boilers Wood Pellets Market Volume & Revenue, By Region, 2024 – 2032 (Kilo Tons) (USD Million) 71
11.1.13. Free-standing pellet stoves 71
11.1.14. Global Free-standing pellet stoves Wood Pellets Market Volume & Revenue, By Region, 2018 – 2023 (Kilo Tons) (USD Million) 73
11.1.15. Global Free-standing pellet stoves Wood Pellets Market Volume & Revenue, By Region, 2024 – 2032 (Kilo Tons) (USD Million) 73
CHAPTER NO. 12 : WOOD PELLETS MARKET – BY END-USER SEGMENT ANALYSIS 74
12.1.1. Wood Pellets Market Overview, by End-user Segment 74
12.1.2. Wood Pellets Market Volume Share, By End-user, 2023 & 2032 75
12.1.3. Wood Pellets Market Revenue Share, By End-user, 2023 & 2032 75
12.1.4. Wood Pellets Market Attractiveness Analysis, By End-user 76
12.1.5. Incremental Revenue Growth Opportunity, by End-user, 2024 – 2032 76
12.1.6. Wood Pellets Market Revenue, By End-user, 2018, 2023, 2027 & 2032 77
12.1.7. Residential 78
12.1.8. Global Residential Wood Pellets Market Volume & Revenue, By Region, 2018 – 2023 (Kilo Tons) (USD Million) 79
12.1.9. Global Residential Wood Pellets Market Volume & Revenue, By Region, 2024 – 2032 (Kilo Tons) (USD Million) 79
12.1.10. Commercial 80
12.1.11. Global Commercial Wood Pellets Market Volume & Revenue, By Region, 2018 – 2023 (Kilo Tons) (USD Million) 81
12.1.12. Global Commercial Wood Pellets Market Volume & Revenue, By Region, 2024 – 2032 (Kilo Tons) (USD Million) 81
12.1.13. Power Generation 82
12.1.14. Global Power Generation Wood Pellets Market Volume & Revenue, By Region, 2018 – 2023 (Kilo Tons) (USD Million) 83
12.1.15. Global Power Generation Wood Pellets Market Volume & Revenue, By Region, 2024 – 2032 (Kilo Tons) (USD Million) 83
12.1.16. Co-firing 84
12.1.17. Global Co-firing Wood Pellets Market Volume & Revenue, By Region, 2018 – 2023 (Kilo Tons) (USD Million) 85
12.1.18. Global Co-firing Wood Pellets Market Volume & Revenue, By Region, 2024 – 2032 (Kilo Tons) (USD Million) 85
12.1.19. Combined Heat and Power (CHP) 86
12.1.20. Global Combined Heat and Power (CHP) Wood Pellets Market Volume & Revenue, By Region, 2018 – 2023 (Kilo Tons) (USD Million) 87
12.1.21. Global Combined Heat and Power (CHP) Wood Pellets Market Volume & Revenue, By Region, 2024 – 2032 (Kilo Tons) (USD Million) 87
CHAPTER NO. 13 : WOOD PELLETS MARKET – REGIONAL ANALYSIS 88
13.1.1. Wood Pellets Market Overview, by Regional Segments 88
13.1.2. Region 89
13.1.3. Global Wood Pellets Market Volume Share, By Region, 2023 & 2032 89
13.1.4. Global Wood Pellets Market Revenue Share, By Region, 2023 & 2032 89
13.1.5. Wood Pellets Market Attractiveness Analysis, By Region 90
13.1.6. Incremental Revenue Growth Opportunity, by Region, 2024 – 2032 90
13.1.7. Wood Pellets Market Revenue, By Region, 2018, 2023, 2027 & 2032 91
13.1.8. Global Wood Pellets Market Volume & Revenue, By Region, 2018 – 2023 (Kilo Tons) (USD Million) 92
13.1.9. Global Wood Pellets Market Volume & Revenue, By Region, 2024 – 2032 (Kilo Tons) (USD Million) 92
13.1.10. Product 93
13.1.11. Global Wood Pellets Market Volume & Revenue, By Product, 2018 – 2023 (Kilo Tons) (USD Million) 93
13.1.12. Global Wood Pellets Market Volume & Revenue, By Product, 2024 – 2032 (Kilo Tons) (USD Million) 93
13.1.13. Application 94
13.1.14. Global Wood Pellets Market Volume & Revenue, By Application, 2018 – 2023 (Kilo Tons) (USD Million) 94
13.1.15. Global Wood Pellets Market Volume & Revenue, By Application, 2024 – 2032 (Kilo Tons) (USD Million) 94
13.1.16. End-user 95
13.1.17. Global Wood Pellets Market Volume & Revenue, By End-user, 2018 – 2023 (Kilo Tons) (USD Million) 95
13.1.18. Global Wood Pellets Market Volume & Revenue, By End-user, 2024 – 2032 (Kilo Tons) (USD Million) 95
13.1.19. Technology 96
13.1.20. Global Wood Pellets Market Volume & Revenue, By Technology, 2018 – 2023 (Kilo Tons) (USD Million) 96
13.1.21. Global Wood Pellets Market Volume & Revenue, By Technology, 2024 – 2032 (Kilo Tons) (USD Million) 96
13.1.22. Distribution Channel 97
13.1.23. Global Wood Pellets Market Volume & Revenue, By Distribution Channel, 2018 – 2023 (Kilo Tons) (USD Million) 97
13.1.24. Global Wood Pellets Market Volume & Revenue, By Distribution Channel, 2024 – 2032 (Kilo Tons) (USD Million) 97
CHAPTER NO. 14 : WOOD PELLETS MARKET – NORTH AMERICA 98
14.1.1. North America 98
14.1.1. Key Highlights 98
14.1.2. North America Wood Pellets Market Volume, By Country, 2018 – 2032 (Kilo Tons) 99
14.1.3. North America Wood Pellets Market Revenue, By Country, 2018 – 2023 (USD Million) 100
14.1.4. North America Wood Pellets Market Volume, By Product, 2018 – 2023 (Kilo Tons) 101
14.1.5. North America Wood Pellets Market Revenue, By Product, 2018 – 2023 (USD Million) 102
14.1.6. North America Wood Pellets Market Volume, By Application, 2018 – 2023 (Kilo Tons) 103
14.1.7. North America Wood Pellets Market Revenue, By Application, 2018 – 2023 (USD Million) 104
14.1.8. North America Wood Pellets Market Volume, By End-user, 2018 – 2023 (Kilo Tons) 105
14.1.9. North America Wood Pellets Market Revenue, By End-user, 2018 – 2023 (USD Million) 106
14.1.10. U.S. 107
14.1.11. Canada 107
14.1.12. Mexico 107
CHAPTER NO. 15 : WOOD PELLETS MARKET – EUROPE 108
15.1.1. Europe 108
15.1.2. Key Highlights 108
15.1.3. Europe Wood Pellets Market Volume, By Country, 2018 – 2032 (Kilo Tons) 109
15.1.4. Europe Wood Pellets Market Revenue, By Country, 2018 – 2023 (USD Million) 110
15.1.5. Europe Wood Pellets Market Volume, By Product, 2018 – 2023 (Kilo Tons) 111
15.1.6. Europe Wood Pellets Market Revenue, By Product, 2018 – 2023 (USD Million) 112
15.1.7. Europe Wood Pellets Market Volume, By Application, 2018 – 2023 (Kilo Tons) 113
15.1.8. Europe Wood Pellets Market Revenue, By Application, 2018 – 2023 (USD Million) 114
15.1.9. Europe Wood Pellets Market Volume, By End-user, 2018 – 2023 (Kilo Tons) 115
15.1.10. Europe Wood Pellets Market Revenue, By End-user, 2018 – 2023 (USD Million) 116
15.1.11. UK 117
15.1.12. France 117
15.1.13. Germany 117
15.1.14. Italy 117
15.1.15. Spain 117
15.1.16. Russia 117
15.1.17. Belgium 117
15.1.18. Netherland 117
15.1.19. Austria 117
15.1.20. Sweden 117
15.1.21. Poland 117
15.1.22. Denmark 117
15.1.23. Switzerland 117
15.1.24. Rest of Europe 117
CHAPTER NO. 16 : WOOD PELLETS MARKET – ASIA PACIFIC 118
16.1.1. Asia Pacific 118
16.1.2. Key Highlights 118
16.1.3. Asia Pacific Wood Pellets Market Volume, By Country, 2018 – 2032 (Kilo Tons) 119
16.1.4. Asia Pacific Wood Pellets Market Revenue, By Country, 2018 – 2023 (USD Million) 120
16.1.5. Asia Pacific Wood Pellets Market Volume, By Product, 2018 – 2023 (Kilo Tons) 121
16.1.6. Asia Pacific Wood Pellets Market Revenue, By Product, 2018 – 2023 (USD Million) 122
16.1.7. Asia Pacific Wood Pellets Market Volume, By Application, 2018 – 2023 (Kilo Tons) 123
16.1.8. Asia Pacific Wood Pellets Market Revenue, By Application, 2018 – 2023 (USD Million) 124
16.1.9. Asia Pacific Wood Pellets Market Volume, By End-user, 2018 – 2023 (Kilo Tons) 125
16.1.10. Asia Pacific Wood Pellets Market Revenue, By End-user, 2018 – 2023 (USD Million) 126
16.1.11. China 127
16.1.12. Japan 127
16.1.13. South Korea 127
16.1.14. India 127
16.1.15. Australia 127
16.1.16. Thailand 127
16.1.17. Indonesia 127
16.1.18. Vietnam 127
16.1.19. Malaysia 127
16.1.20. Philippines 127
16.1.21. Taiwan 127
16.1.22. Rest of Asia Pacific 127

CHAPTER NO. 17 : WOOD PELLETS MARKET – LATIN AMERICA 128
17.1.1. Latin America 128
17.1.2. Key Highlights 128
17.1.3. Latin America Wood Pellets Market Volume, By Country, 2018 – 2032 (Kilo Tons) 129
17.1.4. Latin America Wood Pellets Market Revenue, By Country, 2018 – 2023 (USD Million) 130
17.1.5. Latin America Wood Pellets Market Volume, By Product, 2018 – 2023 (Kilo Tons) 131
17.1.6. Latin America Wood Pellets Market Revenue, By Product, 2018 – 2023 (USD Million) 132
17.1.7. Latin America Wood Pellets Market Volume, By Application, 2018 – 2023 (Kilo Tons) 133
17.1.8. Latin America Wood Pellets Market Revenue, By Application, 2018 – 2023 (USD Million) 134
17.1.9. Latin America Wood Pellets Market Volume, By End-user, 2018 – 2023 (Kilo Tons) 135
17.1.10. Latin America Wood Pellets Market Revenue, By End-user, 2018 – 2023 (USD Million) 136
17.1.11. Brazil 137
17.1.12. Argentina 137
17.1.13. Peru 137
17.1.14. Chile 137
17.1.15. Colombia 137
17.1.16. Rest of Latin America 137

CHAPTER NO. 18 : WOOD PELLETS MARKET – MIDDLE EAST 138
18.1.1. Middle East 138
18.1.2. Key Highlights 138
18.1.3. Middle East Wood Pellets Market Volume, By Country, 2018 – 2032 (Kilo Tons) 139
18.1.4. Middle East Wood Pellets Market Revenue, By Country, 2018 – 2023 (USD Million) 140
18.1.5. Middle East Wood Pellets Market Volume, By Product, 2018 – 2023 (Kilo Tons) 141
18.1.6. Middle East Wood Pellets Market Revenue, By Product, 2018 – 2023 (USD Million) 142
18.1.7. Middle East Wood Pellets Market Volume, By Application, 2018 – 2023 (Kilo Tons) 143
18.1.8. Middle East Wood Pellets Market Revenue, By Application, 2018 – 2023 (USD Million) 144
18.1.9. Middle East Wood Pellets Market Volume, By End-user, 2018 – 2023 (Kilo Tons) 145
18.1.10. Middle East Wood Pellets Market Revenue, By End-user, 2018 – 2023 (USD Million) 146
18.1.11. UAE 147
18.1.12. KSA 147
18.1.13. Israel 147
18.1.14. Turkey 147
18.1.15. Iran 147
18.1.16. Rest of Middle East 147

CHAPTER NO. 19 : WOOD PELLETS MARKET – AFRICA 148
19.1.1. Africa 148
19.1.2. Key Highlights 148
19.1.3. Africa Wood Pellets Market Volume, By Country, 2018 – 2032 (Kilo Tons) 149
19.1.4. Africa Wood Pellets Market Revenue, By Country, 2018 – 2023 (USD Million) 150
19.1.5. Africa Wood Pellets Market Volume, By Product, 2018 – 2023 (Kilo Tons) 151
19.1.6. Africa Wood Pellets Market Revenue, By Product, 2018 – 2023 (USD Million) 152
19.1.7. Africa Wood Pellets Market Volume, By Application, 2018 – 2023 (Kilo Tons) 153
19.1.8. Africa Wood Pellets Market Revenue, By Application, 2018 – 2023 (USD Million) 154
19.1.9. Africa Wood Pellets Market Volume, By End-user, 2018 – 2023 (Kilo Tons) 155
19.1.10. Africa Wood Pellets Market Revenue, By End-user, 2018 – 2023 (USD Million) 156
19.1.11. Egypt 157
19.1.12. Nigeria 157
19.1.13. Algeria 157
19.1.14. Morocco 157
19.1.15. Rest of Africa 157

CHAPTER NO. 20 : COMPANY PROFILES 158
20.1.1. Energex 158
20.1.2. Company Overview 158
20.1.3. Product Portfolio 158
20.1.4. Swot Analysis 158
20.1.5. Business Strategy 158
20.1.6. Financial Overview 159
20.1.7. Enviva LP 160
20.1.8. Graanul Invest 160
20.1.9. Drax Biomass 160
20.1.10. Pinnacle 160
20.1.11. Sinclar Group Forest Products 160
20.1.12. Lauzon 160
20.1.13. Wood Pellet Energy (UK) Ltd. 160
20.1.14. United Company 160
20.1.15. Highland Pellets LLC 160
20.1.16. Groupe Savoie Inc. 160
20.1.17. I.C.S. (Lacroix) Lumber Inc. 160
20.1.18. Vermont Wood Pellet Company 160
20.1.19. AVPGroup 160
20.1.20. Farm Fuels 160
CHAPTER NO. 21 : RESEARCH METHODOLOGY 161
21.1.1. Research Methodology 161
21.1.2. Phase I – Secondary Research 162
21.1.3. Phase II – Data Modeling 162
Company Share Analysis Model 163
Revenue Based Modeling 163
21.1.4. Phase III – Primary Research 164
21.1.5. Research Limitations 165
Assumptions 165

List of Figures
FIG NO. 1. Global Wood Pellets Market Volume & Revenue, 2018 – 2032 (Kilo Tons) (USD Million) 28
FIG NO. 2. Porter’s Five Forces Analysis for Global Wood Pellets Market 36
FIG NO. 3. Value Chain Analysis for Global Wood Pellets Market 37
FIG NO. 4. Global Wood Pellets Market Import Volume/Revenue, By Region, 2018 – 2023 39
FIG NO. 5. Global Wood Pellets Market Export Volume/Revenue, By Region, 2018 – 2023 40
FIG NO. 6. Global Wood Pellets Market Demand Volume/Revenue, By Region, 2018 – 2023 41
FIG NO. 7. Global Wood Pellets Market Supply Volume/Revenue, By Region, 2018 – 2023 42
FIG NO. 8. Global Wood Pellets Market Price, By Region, 2018 – 2023 43
FIG NO. 9. Global Wood Pellets Market Price, By Product, 2018 – 2023 44
FIG NO. 10. Company Share Analysis, 2023 45
FIG NO. 11. Company Share Analysis, 2023 46
FIG NO. 12. Company Share Analysis, 2023 46
FIG NO. 13. Company Share Analysis, 2023 47
FIG NO. 14. Wood Pellets Market – Company Volume Market Share, 2023 48
FIG NO. 15. Wood Pellets Market – Company Revenue Market Share, 2023 49
FIG NO. 16. Wood Pellets Market Volume Share, By Product, 2023 & 2032 55
FIG NO. 17. Wood Pellets Market Revenue Share, By Product, 2023 & 2032 55
FIG NO. 18. Market Attractiveness Analysis, By Product 56
FIG NO. 19. Incremental Revenue Growth Opportunity by Product, 2024 – 2032 56
FIG NO. 20. Wood Pellets Market Revenue, By Product, 2018, 2023, 2027 & 2032 57
FIG NO. 21. Global Wood Pellets Market for Forest Wood & Waste, Volume & Revenue (Kilo Tons) (USD Million) 2018 – 2032 58
FIG NO. 22. Global Wood Pellets Market for Agriculture Residue, Volume & Revenue (Kilo Tons) (USD Million) 2018 – 2032 60
FIG NO. 23. Global Wood Pellets Market for Others, Volume & Revenue (Kilo Tons) (USD Million) 2018 – 2032 62
FIG NO. 24. Wood Pellets Market Volume Share, By Application, 2023 & 2032 65
FIG NO. 25. Wood Pellets Market Revenue Share, By Application, 2023 & 2032 65
FIG NO. 26. Market Attractiveness Analysis, By Application 66
FIG NO. 27. Incremental Revenue Growth Opportunity by Application, 2024 – 2032 66
FIG NO. 28. Wood Pellets Market Revenue, By Application, 2018, 2023, 2027 & 2032 67
FIG NO. 29. Global Wood Pellets Market for Pellet stove inserts, Volume & Revenue (Kilo Tons) (USD Million) 2018 – 2032 68
FIG NO. 30. Global Wood Pellets Market for Pellet Boilers, Volume & Revenue (Kilo Tons) (USD Million) 2018 – 2032 70
FIG NO. 31. Global Wood Pellets Market for Free-standing pellet stoves, Volume & Revenue (Kilo Tons) (USD Million) 2018 – 2032 72
FIG NO. 32. Wood Pellets Market Volume Share, By End-user, 2023 & 2032 75
FIG NO. 33. Wood Pellets Market Revenue Share, By End-user, 2023 & 2032 75
FIG NO. 34. Market Attractiveness Analysis, By End-user 76
FIG NO. 35. Incremental Revenue Growth Opportunity by End-user, 2024 – 2032 76
FIG NO. 36. Wood Pellets Market Revenue, By End-user, 2018, 2023, 2027 & 2032 77
FIG NO. 37. Global Wood Pellets Market for Residential, Volume & Revenue (Kilo Tons) (USD Million) 2018 – 2032 78
FIG NO. 38. Global Wood Pellets Market for Commercial, Volume & Revenue (Kilo Tons) (USD Million) 2018 – 2032 80
FIG NO. 39. Global Wood Pellets Market for Power Generation, Volume & Revenue (Kilo Tons) (USD Million) 2018 – 2032 82
FIG NO. 40. Global Wood Pellets Market for Co-firing, Volume & Revenue (Kilo Tons) (USD Million) 2018 – 2032 84
FIG NO. 41. Global Wood Pellets Market for Combined Heat and Power (CHP), Volume & Revenue (Kilo Tons) (USD Million) 2018 – 2032 86
FIG NO. 42. Global Wood Pellets Market Volume Share, By Region, 2023 & 2032 89
FIG NO. 43. Global Wood Pellets Market Revenue Share, By Region, 2023 & 2032 89
FIG NO. 44. Market Attractiveness Analysis, By Region 90
FIG NO. 45. Incremental Revenue Growth Opportunity by Region, 2024 – 2032 90
FIG NO. 46. Wood Pellets Market Revenue, By Region, 2018, 2023, 2027 & 2032 91
FIG NO. 47. North America Wood Pellets Market Volume & Revenue, 2018 – 2032 (Kilo Tons) (USD Million) 98
FIG NO. 48. Europe Wood Pellets Market Volume & Revenue, 2018 – 2032 (Kilo Tons) (USD Million) 108
FIG NO. 49. Asia Pacific Wood Pellets Market Volume & Revenue, 2018 – 2032 (Kilo Tons) (USD Million) 118
FIG NO. 50. Latin America Wood Pellets Market Volume & Revenue, 2018 – 2032 (Kilo Tons) (USD Million) 128
FIG NO. 51. Middle East Wood Pellets Market Volume & Revenue, 2018 – 2032 (Kilo Tons) (USD Million) 138
FIG NO. 52. Africa Wood Pellets Market Volume & Revenue, 2018 – 2032 (Kilo Tons) (USD Million) 148
FIG NO. 53. Research Methodology – Detailed View 161
FIG NO. 54. Research Methodology 162

List of Tables
TABLE NO. 1. : Global Wood Pellets Market: Snapshot 26
TABLE NO. 2. : Drivers for the Wood Pellets Market: Impact Analysis 32
TABLE NO. 3. : Restraints for the Wood Pellets Market: Impact Analysis 34
TABLE NO. 4. : Global Wood Pellets Market Volume & Revenue, By Region, 2018 – 2023 43
TABLE NO. 5. : Global Wood Pellets Market Volume & Revenue, By Product, 2018 – 2023 44
TABLE NO. 6. : Global Forest Wood & Waste Wood Pellets Market Volume & Revenue, By Region, 2018 – 2023 (Kilo Tons) (USD Million) 59
TABLE NO. 7. : Global Forest Wood & Waste Wood Pellets Market Volume & Revenue, By Region, 2024 – 2032 (Kilo Tons) (USD Million) 59
TABLE NO. 8. : Global Agriculture Residue Wood Pellets Market Volume & Revenue, By Region, 2018 – 2023 (Kilo Tons) (USD Million) 61
TABLE NO. 9. : Global Agriculture Residue Wood Pellets Market Volume & Revenue, By Region, 2024 – 2032 (Kilo Tons) (USD Million) 61
TABLE NO. 10. : Global Others Wood Pellets Market Volume & Revenue, By Region, 2018 – 2023 (Kilo Tons) (USD Million) 63
TABLE NO. 11. : Global Others Wood Pellets Market Volume & Revenue, By Region, 2024 – 2032 (Kilo Tons) (USD Million) 63
TABLE NO. 12. : Global Pellet stove inserts Wood Pellets Market Volume & Revenue, By Region, 2018 – 2023 (Kilo Tons) (USD Million) 69
TABLE NO. 13. : Global Pellet stove inserts Wood Pellets Market Volume & Revenue, By Region, 2024 – 2032 (Kilo Tons) (USD Million) 69
TABLE NO. 14. : Global Pellet Boilers Wood Pellets Market Volume & Revenue, By Region, 2018 – 2023 (Kilo Tons) (USD Million) 71
TABLE NO. 15. : Global Pellet Boilers Wood Pellets Market Volume & Revenue, By Region, 2024 – 2032 (Kilo Tons) (USD Million) 71
TABLE NO. 16. : Global Free-standing pellet stoves Wood Pellets Market Volume & Revenue, By Region, 2018 – 2023 (Kilo Tons) (USD Million) 73
TABLE NO. 17. : Global Free-standing pellet stoves Wood Pellets Market Volume & Revenue, By Region, 2024 – 2032 (Kilo Tons) (USD Million) 73
TABLE NO. 18. : Global Residential Wood Pellets Market Volume & Revenue, By Region, 2018 – 2023 (Kilo Tons) (USD Million) 79
TABLE NO. 19. : Global Residential Wood Pellets Market Volume & Revenue, By Region, 2024 – 2032 (Kilo Tons) (USD Million) 79
TABLE NO. 20. : Global Commercial Wood Pellets Market Volume & Revenue, By Region, 2018 – 2023 (Kilo Tons) (USD Million) 81
TABLE NO. 21. : Global Commercial Wood Pellets Market Volume & Revenue, By Region, 2024 – 2032 (Kilo Tons) (USD Million) 81
TABLE NO. 22. : Global Power Generation Wood Pellets Market Volume & Revenue, By Region, 2018 – 2023 (Kilo Tons) (USD Million) 83
TABLE NO. 23. : Global Power Generation Wood Pellets Market Volume & Revenue, By Region, 2024 – 2032 (Kilo Tons) (USD Million) 83
TABLE NO. 24. : Global Co-firing Wood Pellets Market Volume & Revenue, By Region, 2018 – 2023 (Kilo Tons) (USD Million) 85
TABLE NO. 25. : Global Co-firing Wood Pellets Market Volume & Revenue, By Region, 2024 – 2032 (Kilo Tons) (USD Million) 85
TABLE NO. 26. : Global Combined Heat and Power (CHP) Wood Pellets Market Volume & Revenue, By Region, 2018 – 2023 (Kilo Tons) (USD Million) 87
TABLE NO. 27. : Global Combined Heat and Power (CHP) Wood Pellets Market Volume & Revenue, By Region, 2024 – 2032 (Kilo Tons) (USD Million) 87
TABLE NO. 28. : Global Wood Pellets Market Volume & Revenue, By Region, 2018 – 2023 (Kilo Tons) (USD Million) 92
TABLE NO. 29. : Global Wood Pellets Market Volume & Revenue, By Region, 2024 – 2032 (Kilo Tons) (USD Million) 92
TABLE NO. 30. : Global Wood Pellets Market Volume & Revenue, By Product, 2018 – 2023 (Kilo Tons) (USD Million) 93
TABLE NO. 31. : Global Wood Pellets Market Volume & Revenue, By Product, 2024 – 2032 (Kilo Tons) (USD Million) 93
TABLE NO. 32. : Global Wood Pellets Market Volume & Revenue, By Application, 2018 – 2023 (Kilo Tons) (USD Million) 94
TABLE NO. 33. : Global Wood Pellets Market Volume & Revenue, By Application, 2024 – 2032 (Kilo Tons) (USD Million) 94
TABLE NO. 34. : Global Wood Pellets Market Volume & Revenue, By End-user, 2018 – 2023 (Kilo Tons) (USD Million) 95
TABLE NO. 35. : Global Wood Pellets Market Volume & Revenue, By End-user, 2024 – 2032 (Kilo Tons) (USD Million) 95
TABLE NO. 36. : Global Wood Pellets Market Volume & Revenue, By Technology, 2018 – 2023 (Kilo Tons) (USD Million) 96
TABLE NO. 37. : Global Wood Pellets Market Volume & Revenue, By Technology, 2024 – 2032 (Kilo Tons) (USD Million) 96
TABLE NO. 38. : Global Wood Pellets Market Volume & Revenue, By Distribution Channel, 2018 – 2023 (Kilo Tons) (USD Million) 97
TABLE NO. 39. : Global Wood Pellets Market Volume & Revenue, By Distribution Channel, 2024 – 2032 (Kilo Tons) (USD Million) 97
TABLE NO. 40. : North America Wood Pellets Market Volume, By Country, 2018 – 2023 (Kilo Tons) 99
TABLE NO. 41. : North America Wood Pellets Market Volume, By Country, 2024 – 2032 (Kilo Tons) 99
TABLE NO. 42. : North America Wood Pellets Market Revenue, By Country, 2018 – 2023 (USD Million) 100
TABLE NO. 43. : North America Wood Pellets Market Revenue, By Country, 2024 – 2032 (USD Million) 100
TABLE NO. 44. : North America Wood Pellets Market Volume, By Product, 2018 – 2023 (Kilo Tons) 101
TABLE NO. 45. : North America Wood Pellets Market Volume, By Product, 2024 – 2032 (Kilo Tons) 101
TABLE NO. 46. : North America Wood Pellets Market Revenue, By Product, 2018 – 2023 (USD Million) 102
TABLE NO. 47. : North America Wood Pellets Market Revenue, By Product, 2024 – 2032 (USD Million) 102
TABLE NO. 48. : North America Wood Pellets Market Volume, By Application, 2018 – 2023 (Kilo Tons) 103
TABLE NO. 49. : North America Wood Pellets Market Volume, By Application, 2024 – 2032 (Kilo Tons) 103
TABLE NO. 50. : North America Wood Pellets Market Revenue, By Application, 2018 – 2023 (USD Million) 104
TABLE NO. 51. : North America Wood Pellets Market Revenue, By Application, 2024 – 2032 (USD Million) 104
TABLE NO. 52. : North America Wood Pellets Market Volume, By End-user, 2018 – 2023 (Kilo Tons) 105
TABLE NO. 53. : North America Wood Pellets Market Volume, By End-user, 2024 – 2032 (Kilo Tons) 105
TABLE NO. 54. : North America Wood Pellets Market Revenue, By End-user, 2018 – 2023 (USD Million) 106
TABLE NO. 55. : North America Wood Pellets Market Revenue, By End-user, 2024 – 2032 (USD Million) 106
TABLE NO. 56. : Europe Wood Pellets Market Volume, By Country, 2018 – 2023 (Kilo Tons) 109
TABLE NO. 57. : Europe Wood Pellets Market Volume, By Country, 2024 – 2032 (Kilo Tons) 109
TABLE NO. 58. : Europe Wood Pellets Market Revenue, By Country, 2018 – 2023 (USD Million) 110
TABLE NO. 59. : Europe Wood Pellets Market Revenue, By Country, 2024 – 2032 (USD Million) 110
TABLE NO. 60. : Europe Wood Pellets Market Volume, By Product, 2018 – 2023 (Kilo Tons) 111
TABLE NO. 61. : Europe Wood Pellets Market Volume, By Product, 2024 – 2032 (Kilo Tons) 111
TABLE NO. 62. : Europe Wood Pellets Market Revenue, By Product, 2018 – 2023 (USD Million) 112
TABLE NO. 63. : Europe Wood Pellets Market Revenue, By Product, 2024 – 2032 (USD Million) 112
TABLE NO. 64. : Europe Wood Pellets Market Volume, By Application, 2018 – 2023 (Kilo Tons) 113
TABLE NO. 65. : Europe Wood Pellets Market Volume, By Application, 2024 – 2032 (Kilo Tons) 113
TABLE NO. 66. : Europe Wood Pellets Market Revenue, By Application, 2018 – 2023 (USD Million) 114
TABLE NO. 67. : Europe Wood Pellets Market Revenue, By Application, 2024 – 2032 (USD Million) 114
TABLE NO. 68. : Europe Wood Pellets Market Volume, By End-user, 2018 – 2023 (Kilo Tons) 115
TABLE NO. 69. : Europe Wood Pellets Market Volume, By End-user, 2024 – 2032 (Kilo Tons) 115
TABLE NO. 70. : Europe Wood Pellets Market Revenue, By End-user, 2018 – 2023 (USD Million) 116
TABLE NO. 71. : Europe Wood Pellets Market Revenue, By End-user, 2024 – 2032 (USD Million) 116
TABLE NO. 72. : Asia Pacific Wood Pellets Market Volume, By Country, 2018 – 2023 (Kilo Tons) 119
TABLE NO. 73. : Asia Pacific Wood Pellets Market Volume, By Country, 2024 – 2032 (Kilo Tons) 119
TABLE NO. 74. : Asia Pacific Wood Pellets Market Revenue, By Country, 2018 – 2023 (USD Million) 120
TABLE NO. 75. : Asia Pacific Wood Pellets Market Revenue, By Country, 2024 – 2032 (USD Million) 120
TABLE NO. 76. : Asia Pacific Wood Pellets Market Volume, By Product, 2018 – 2023 (Kilo Tons) 121
TABLE NO. 77. : Asia Pacific Wood Pellets Market Volume, By Product, 2024 – 2032 (Kilo Tons) 121
TABLE NO. 78. : Asia Pacific Wood Pellets Market Revenue, By Product, 2018 – 2023 (USD Million) 122
TABLE NO. 79. : Asia Pacific Wood Pellets Market Revenue, By Product, 2024 – 2032 (USD Million) 122
TABLE NO. 80. : Asia Pacific Wood Pellets Market Volume, By Application, 2018 – 2023 (Kilo Tons) 123
TABLE NO. 81. : Asia Pacific Wood Pellets Market Volume, By Application, 2024 – 2032 (Kilo Tons) 123
TABLE NO. 82. : Asia Pacific Wood Pellets Market Revenue, By Application, 2018 – 2023 (USD Million) 124
TABLE NO. 83. : Asia Pacific Wood Pellets Market Revenue, By Application, 2024 – 2032 (USD Million) 124
TABLE NO. 84. : Asia Pacific Wood Pellets Market Volume, By End-user, 2018 – 2023 (Kilo Tons) 125
TABLE NO. 85. : Asia Pacific Wood Pellets Market Volume, By End-user, 2024 – 2032 (Kilo Tons) 125
TABLE NO. 86. : Asia Pacific Wood Pellets Market Revenue, By End-user, 2018 – 2023 (USD Million) 126
TABLE NO. 87. : Asia Pacific Wood Pellets Market Revenue, By End-user, 2024 – 2032 (USD Million) 126
TABLE NO. 88. : Latin America Wood Pellets Market Volume, By Country, 2018 – 2023 (Kilo Tons) 129
TABLE NO. 89. : Latin America Wood Pellets Market Volume, By Country, 2024 – 2032 (Kilo Tons) 129
TABLE NO. 90. : Latin America Wood Pellets Market Revenue, By Country, 2018 – 2023 (USD Million) 130
TABLE NO. 91. : Latin America Wood Pellets Market Revenue, By Country, 2024 – 2032 (USD Million) 130
TABLE NO. 92. : Latin America Wood Pellets Market Volume, By Product, 2018 – 2023 (Kilo Tons) 131
TABLE NO. 93. : Latin America Wood Pellets Market Volume, By Product, 2024 – 2032 (Kilo Tons) 131
TABLE NO. 94. : Latin America Wood Pellets Market Revenue, By Product, 2018 – 2023 (USD Million) 132
TABLE NO. 95. : Latin America Wood Pellets Market Revenue, By Product, 2024 – 2032 (USD Million) 132
TABLE NO. 96. : Latin America Wood Pellets Market Volume, By Application, 2018 – 2023 (Kilo Tons) 133
TABLE NO. 97. : Latin America Wood Pellets Market Volume, By Application, 2024 – 2032 (Kilo Tons) 133
TABLE NO. 98. : Latin America Wood Pellets Market Revenue, By Application, 2018 – 2023 (USD Million) 134
TABLE NO. 99. : Latin America Wood Pellets Market Revenue, By Application, 2024 – 2032 (USD Million) 134
TABLE NO. 100. : Latin America Wood Pellets Market Volume, By End-user, 2018 – 2023 (Kilo Tons) 135
TABLE NO. 101. : Latin America Wood Pellets Market Volume, By End-user, 2024 – 2032 (Kilo Tons) 135
TABLE NO. 102. : Latin America Wood Pellets Market Revenue, By End-user, 2018 – 2023 (USD Million) 136
TABLE NO. 103. : Latin America Wood Pellets Market Revenue, By End-user, 2024 – 2032 (USD Million) 136
TABLE NO. 104. : Middle East Wood Pellets Market Volume, By Country, 2018 – 2023 (Kilo Tons) 139
TABLE NO. 105. : Middle East Wood Pellets Market Volume, By Country, 2024 – 2032 (Kilo Tons) 139
TABLE NO. 106. : Middle East Wood Pellets Market Revenue, By Country, 2018 – 2023 (USD Million) 140
TABLE NO. 107. : Middle East Wood Pellets Market Revenue, By Country, 2024 – 2032 (USD Million) 140
TABLE NO. 108. : Middle East Wood Pellets Market Volume, By Product, 2018 – 2023 (Kilo Tons) 141
TABLE NO. 109. : Middle East Wood Pellets Market Volume, By Product, 2024 – 2032 (Kilo Tons) 141
TABLE NO. 110. : Middle East Wood Pellets Market Revenue, By Product, 2018 – 2023 (USD Million) 142
TABLE NO. 111. : Middle East Wood Pellets Market Revenue, By Product, 2024 – 2032 (USD Million) 142
TABLE NO. 112. : Middle East Wood Pellets Market Volume, By Application, 2018 – 2023 (Kilo Tons) 143
TABLE NO. 113. : Middle East Wood Pellets Market Volume, By Application, 2024 – 2032 (Kilo Tons) 143
TABLE NO. 114. : Middle East Wood Pellets Market Revenue, By Application, 2018 – 2023 (USD Million) 144
TABLE NO. 115. : Middle East Wood Pellets Market Revenue, By Application, 2024 – 2032 (USD Million) 144
TABLE NO. 116. : Middle East Wood Pellets Market Volume, By End-user, 2018 – 2023 (Kilo Tons) 145
TABLE NO. 117. : Middle East Wood Pellets Market Volume, By End-user, 2024 – 2032 (Kilo Tons) 145
TABLE NO. 118. : Middle East Wood Pellets Market Revenue, By End-user, 2018 – 2023 (USD Million) 146
TABLE NO. 119. : Middle East Wood Pellets Market Revenue, By End-user, 2024 – 2032 (USD Million) 146
TABLE NO. 120. : Africa Wood Pellets Market Volume, By Country, 2018 – 2023 (Kilo Tons) 149
TABLE NO. 121. : Africa Wood Pellets Market Volume, By Country, 2024 – 2032 (Kilo Tons) 149
TABLE NO. 122. : Africa Wood Pellets Market Revenue, By Country, 2018 – 2023 (USD Million) 150
TABLE NO. 123. : Africa Wood Pellets Market Revenue, By Country, 2024 – 2032 (USD Million) 150
TABLE NO. 124. : Africa Wood Pellets Market Volume, By Product, 2018 – 2023 (Kilo Tons) 151
TABLE NO. 125. : Africa Wood Pellets Market Volume, By Product, 2024 – 2032 (Kilo Tons) 151
TABLE NO. 126. : Africa Wood Pellets Market Revenue, By Product, 2018 – 2023 (USD Million) 152
TABLE NO. 127. : Africa Wood Pellets Market Revenue, By Product, 2024 – 2032 (USD Million) 152
TABLE NO. 128. : Africa Wood Pellets Market Volume, By Application, 2018 – 2023 (Kilo Tons) 153
TABLE NO. 129. : Africa Wood Pellets Market Volume, By Application, 2024 – 2032 (Kilo Tons) 153
TABLE NO. 130. : Africa Wood Pellets Market Revenue, By Application, 2018 – 2023 (USD Million) 154
TABLE NO. 131. : Africa Wood Pellets Market Revenue, By Application, 2024 – 2032 (USD Million) 154
TABLE NO. 132. : Africa Wood Pellets Market Volume, By End-user, 2018 – 2023 (Kilo Tons) 155
TABLE NO. 133. : Africa Wood Pellets Market Volume, By End-user, 2024 – 2032 (Kilo Tons) 155
TABLE NO. 134. : Africa Wood Pellets Market Revenue, By End-user, 2018 – 2023 (USD Million) 156
TABLE NO. 135. : Africa Wood Pellets Market Revenue, By End-user, 2024 – 2032 (USD Million) 156


Frequently Asked Questions:

What are wood pellets, and why are they important for renewable energy?

Wood pellets are a form of biomass fuel, made from compressed organic matter, primarily sawdust and other by-products from the wood manufacturing process. They serve as a clean, sustainable, and highly efficient source of energy, contributing significantly to the renewable energy sector. Their importance lies in their ability to reduce greenhouse gas emissions compared to traditional fossil fuels, positioning them as a vital component of the global shift towards green energy solutions.

How much is the wood pellets market worth, and what is its future projection?

As of 2023, the global wood pellets market was valued at USD 9,423.87 Million. It is anticipated to grow to USD 17,693.14 Million by 2032, with a Compound Annual Growth Rate (CAGR) of 7.25% from 2024 to 2032. This projected growth underscores the increasing adoption of wood pellets for both residential heating and industrial power generation, particularly in Europe, North America, and parts of Asia.

What drives the growth of the wood pellets market?

The market’s growth is driven by a combination of environmental, economic, and policy factors. The global effort to combat climate change has increased the demand for renewable energy sources, making wood pellets a favorable alternative to coal and natural gas. Their carbon-neutral status—where the CO2 released during combustion is offset by the CO2 absorbed by newly planted trees—aligns with international efforts to reduce carbon emissions. Furthermore, government policies and incentives, as well as advancements in pellet production and combustion technologies, play crucial roles in market expansion.

Which region is the largest market for wood pellets, and what are the key factors contributing to its dominance?

Europe is the largest market for wood pellets, attributed to stringent environmental regulations and significant investments in renewable energy infrastructure. The European Union’s Renewable Energy Directive, which sets ambitious targets for renewable energy consumption, has been a key factor in driving demand. North America follows Europe in market size, with its growth fueled by a rising demand for clean energy solutions and the abundant availability of raw materials for pellet production.

U.S. Ground Power Unit Market

Published:
Report ID: 36528

Germany Ground Power Unit Market

Published:
Report ID: 36282

Solar Generator Market

Published:
Report ID: 36226

Drilling Fluids Market

Published:
Report ID: 5398

Gas Engines Market

Published:
Report ID: 6044

India Solar Canopy Carport Market

Published:
Report ID: 36081

Intelligent Pigging Services Market

Published:
Report ID: 6909

Drill Bits Market

Published:
Report ID: 5399

Air Compressor Market

Published:
Report ID: 2818

Pipeline Leak Detection Market

Published:
Report ID: 9703

Pressure Pumping Market

Published:
Report ID: 6029

UK Ground Power Unit Market

Published:
Report ID: 35478

Purchase Options

$2999
Delivery Format: Excel.
$4999
Designed for the individual purchaser.
$6999
Users located at a single corporate site or regional office.
$7999
Allowed for unlimited sharing globally within one company.
Smallform of Sample request

Have a question?

User Profile

Don’t settle for less – trust Mitul to help you find the best solution.

Report delivery within 24 to 48 hours

– Other Info –

What people say?-

User Review

I am very impressed with the information in this report. The author clearly did their research when they came up with this product and it has already given me a lot of ideas.

Jana Schmidt
CEDAR CX Technologies

– Connect with us –

Phone

+91 6232 49 3207


support

24/7 Research Support


sales@credenceresearch.com

– Research Methodology –

Going beyond the basics: advanced techniques in research methodology

– Trusted By –

Pepshi, LG, Nestle
Motorola, Honeywell, Johnson and johnson
LG Chem, SIEMENS, Pfizer
Unilever, Samsonite, QIAGEN