Market Overview
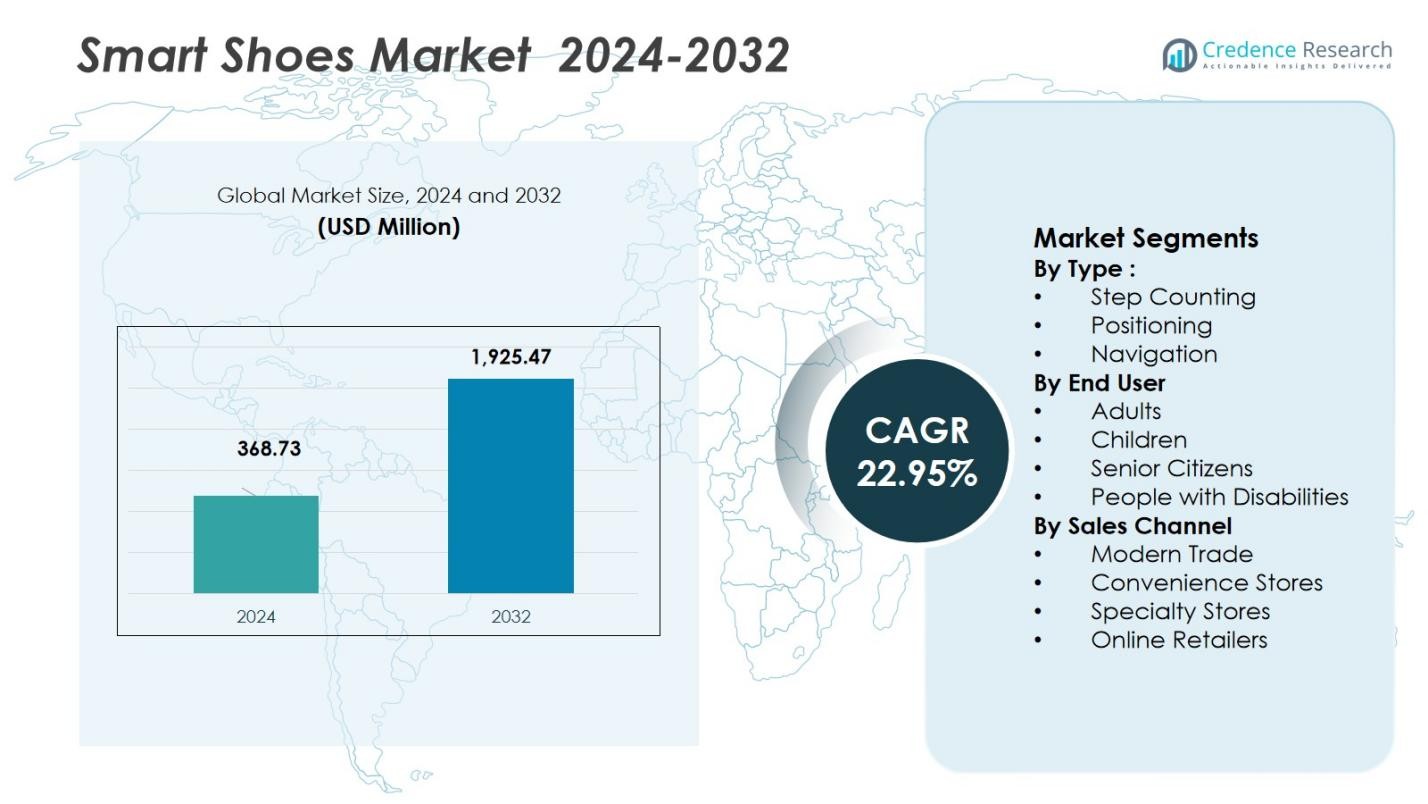
Smart Shoes Market size was valued at USD 368.73 million in 2024 and is anticipated to reach USD 1,925.47 million by 2032, growing at a CAGR of 22.95% during the forecast period.
| REPORT ATTRIBUTE |
DETAILS |
| Historical Period |
2020-2023 |
| Base Year |
2024 |
| Forecast Period |
2025-2032 |
| Smart Shoes Market Size 2024 |
USD 368.73 Million |
| Smart Shoes Market, CAGR |
22.95% |
| Smart Shoes Market Size 2032 |
USD 1,925.47 Million |
Smart Shoes Market continues to be shaped by top players such as Nike, Inc., Adidas Group, PUMA SE, Under Armour, Inc., and Digitsole, each leveraging strong brand recognition, technology integration, and broad distribution networks. These industry leaders invest heavily in product innovation from sensor‑enabled step counting designs to self‑adjusting and app‑linked smart footwear to address both fitness and lifestyle segments. Regionally, North America leads with a 44.5% share of the global market as of 2024, supported by high consumer spending power and widespread adoption of wearables. Europe follows with a 20.0% market share, while Asia‑Pacific accounts for 18.7%, reflecting increasing health awareness and rapid urbanization. Latin America holds 9.0%, and Middle East & Africa comprise 7.8%, indicating growing but more modest uptake outside major markets.
Access crucial information at unmatched prices!
Request your sample report today & start making informed decisions powered by Credence Research Inc.!
Download Sample
Market Insights
- Smart Shoes Market is valued at USD 368.73 million in 2024 and is projected to grow at a CAGR of 22.95% through 2032, reaching USD 1,925.47 million.
- Rising adoption of fitness and wellness technologies is fueling demand, as consumers increasingly prefer sensor‑enabled footwear for activity tracking and health monitoring.
- Expansion of AI‑driven analytics and integration with wearable ecosystems is shaping a trend toward personalized gait analysis, posture tracking, and injury prevention features in smart shoes.
- Leading brands such as Nike, Adidas, PUMA, Under Armour, and Digitsole dominate through technological innovation and global distribution; step‑counting holds 42% share in 2024, while sales via online retailers capture 49% share.
- Regionally, North America commands 44.5% of the market in 2024, followed by Europe at 20.0%, Asia‑Pacific at 18.7%, Latin America at 9.0%, and Middle East & Africa at 7.8%, showing diversified adoption across global markets.
 Market Segmentation Analysis:
By Type:
In 2024, the step counting segment led the Smart Shoes Market with a 42% share, driven by rising fitness awareness and integration of basic health-tracking features suitable for everyday use. Its dominance reflects strong adoption among consumers seeking cost-effective smart wearables without complex navigation systems. Positioning held a 33% share, supported by demand in sports performance monitoring and location-based tracking. Navigation accounted for a 25% share, gaining traction from emerging applications in indoor guidance and mobility assistance. The leadership of step counting is fueled by simple functionality, lower price points, and compatibility with mainstream fitness ecosystems.
- For instance, Under Armour’s HOVR series offered GPS-enabled distance measurement and running form diagnostics through the MapMyRun platform, enhancing athlete engagement.
By End User:
Adults dominated the market with a 57% share in 2024, driven by increasing interest in fitness technologies, sports performance analytics, and lifestyle-oriented wearables. This group benefits from higher purchasing power and strong engagement with health-tracking apps, reinforcing their leading position. Children represented a 18% share, supported by the growing trend of safety-focused smart footwear. Senior citizens held a 14% share, as demand rises for fall detection and health monitoring features. People with disabilities captured an 11% share, driven by mobility-supportive functions. Adult adoption remains the primary growth driver due to sustained fitness and wellness priorities.
- For instance, Skechers’ Hands Free Slip-ins line and Samsung’s Galaxy Watch6 with irregular heart rhythm notifications have gained traction among older adults.
By Sales Channel:
Online retailers led the Smart Shoes Market with a 49% share in 2024, driven by the convenience of digital shopping, broader product availability, and strong influence of e-commerce promotions and brand partnerships. Modern trade accounted for a 26% share, supported by the presence of premium sports and lifestyle chains. Specialty stores held a 15% share, driven by personalized fitting and product guidance for performance-focused buyers. Convenience stores captured a 10% share, reflecting limited product range. The dominance of online retail is fueled by rapid digital adoption, seamless price comparison, and widespread direct-to-consumer strategies from smart footwear brands.
Key Growth Drivers
Rising Adoption of Fitness and Wellness Technologies
Growing global emphasis on personal health and active lifestyles is driving strong demand for smart shoes equipped with step tracking, calorie monitoring, and gait analysis features. Consumers are increasingly shifting from traditional footwear to data-driven solutions that support performance improvement and daily activity monitoring. Integration with fitness apps and wearable ecosystems enhances user engagement, creating repeat purchase behavior. Sports enthusiasts, gym users, and everyday fitness-conscious consumers are fueling market expansion, while brands leverage biometric insights to position smart shoes as essential wellness accessories rather than niche gadgets.
- For instance, Digitsole, a French company, produces connected insoles powered by Mov-Scan technology to analyze biomechanics, optimize performance, and prevent injuries by tracking movement data in real-time.
Advancements in Sensors and IoT Integration
Rapid improvements in sensor accuracy, miniaturization, and low-power IoT connectivity are accelerating smart shoe adoption. Embedded pressure sensors, motion trackers, and GPS modules enable real-time analytics for performance assessment and mobility support. These capabilities enhance product functionality, making smart shoes more valuable for sports training, medical monitoring, and personalized feedback. The integration of Bluetooth and cloud connectivity further supports seamless data transfer and remote analytics. Continuous technological enhancements are helping manufacturers deliver more intelligent, durable, and responsive footwear, strengthening market growth across both consumer and assistive applications.
- For instance, Nike’s Adapt series features motorized laces that automatically adjust to the foot’s shape and movement, providing a personalized fit and support.
Growing Applications in Healthcare and Assisted Mobility
Beyond fitness, smart shoes are gaining traction in medical monitoring, rehabilitation, and mobility assistance, driving wider market penetration. Features such as fall detection, gait correction, and posture monitoring offer significant benefits for senior citizens and individuals with disabilities. Healthcare providers and rehabilitation centers are increasingly adopting smart footwear to track patient progress and personalize therapy programs. The ability to provide non-invasive, continuous monitoring positions smart shoes as a valuable tool in preventive healthcare and movement disorders. This expanding clinical relevance is opening new revenue streams and encouraging investment in specialized product development.
Key Trends & Opportunities
Expansion of AI-Driven Personalized Analytics
A major trend shaping the market is the shift toward AI-enabled insights that deliver personalized recommendations for movement, performance, and health improvement. Machine learning algorithms can analyze gait patterns, predict injury risks, and tailor fitness guidance to individual users. This capability not only enhances user experience but also creates opportunities for subscription-based digital services and app integrations. Brands are exploring AI platforms to differentiate their offerings and build long-term engagement, unlocking revenue beyond hardware sales. The trend positions smart shoes as intelligent companions rather than simple tracking devices.
- For instance, Nike’s Adapt BB uses embedded sensors and a custom Nike FitAdapt app to automatically adjust shoe tightness based on user activity and feedback.
Growth of E-Commerce and Direct-to-Consumer Models
Accelerated digital adoption is creating substantial opportunity for brands to expand through online platforms and direct-to-consumer channels. E-commerce enables broader product visibility, easier comparison, and access to global markets without heavy retail infrastructure investments. Personalized sizing tools, virtual try-on technologies, and online promotions further drive customer conversion. Startups and established brands are leveraging digital channels to launch innovative models rapidly, gather user feedback, and refine product features. This shift not only reduces distribution costs but also strengthens brand-customer relationships, fueling faster market penetration and scalable growth.
- For instance, Nike’s mobile app, Nike Fit, uses augmented reality to scan users’ feet and recommend the perfect shoe size, significantly improving online shoe fit accuracy and reducing returns.
Key Challenges
High Product Costs and Price Sensitivity
Despite rising interest, the market faces a significant challenge due to the high cost of smart shoes driven by advanced sensors, electronics, and software integration. Price-sensitive consumers in developing markets often favor traditional footwear or basic wearables, limiting mass adoption. The shorter replacement cycle and concerns about long-term durability further discourage investment. Manufacturers must balance innovation with affordability to penetrate broader demographics. Without cost optimization and scalable production, premium pricing may slow market expansion and restrict growth primarily to fitness enthusiasts and high-income segments.
Data Privacy and User Trust Concerns
Smart shoes collect sensitive biometric and location data, creating concerns around privacy, security, and data misuse. Users may hesitate to adopt products that lack transparent data policies or robust cybersecurity protections. Regulatory pressures around digital health data and cross-border data storage add complexity for global manufacturers. Any breach or misuse of personal information can damage brand credibility and hinder consumer confidence. Building secure platforms, ensuring compliance, and offering clear consent mechanisms are essential to overcoming trust barriers and supporting sustainable market growth.
Regional Analysis
North America
In 2024, the North America region held a 44.5% share of the global smart shoes market, making it the dominant regional market. High consumer spending power, widespread adoption of wearable fitness devices, and a mature culture of health and wellness drive demand. The region benefits from strong technological infrastructure and high penetration of fitness‑conscious consumers who value data‑driven health and performance tracking. Leading footwear and wearable brands — based or heavily active in North America — further boost regional growth through aggressive marketing, frequent product launches, and broad retail distribution networks.
Europe
The Europe region captured a 20.0% share of the global smart shoes market in 2024. In Europe, growing consumer awareness around health and fitness and increasing adoption of wearable footwear supports market expansion. Regulatory frameworks and data‑protection standards enhance consumer trust in wearable technology. The presence of established sports footwear brands and steady demand for fitness and lifestyle wearables further fuel growth. As a result, smart shoes are increasingly accepted as everyday footwear among urban, health‑conscious European consumers seeking performance and wellness benefits.
Asia‑Pacific
The Asia Pacific region accounted for 18.7% of the global smart shoes market in 2024. Growing disposable incomes, rising urbanization, and increasing health‑awareness among younger demographics propel demand. Expanding e‑commerce infrastructure and rising smartphone penetration support distribution and purchase of smart footwear. Emerging markets such as China and India show particular potential as manufacturers target both fitness‑enthusiasts and first‑time buyers upgrading from conventional shoes. The combination of price‑sensitive yet tech‑open consumers makes Asia‑Pacific a high-growth region for mid‑ to high‑end smart shoe offerings.
Latin America
The Latin America region is estimated to hold a 9.0% share of the global smart shoes market in 2024. Growing internet penetration and rising awareness of fitness and wearable technologies fuel regional adoption. Urban populations increasingly value smart health‑monitoring wearables, and expanding e‑commerce channels facilitate access to smart footwear. Nonetheless, price sensitivity and lower disposable income compared to developed regions pose limitations. As local distributors and global brands expand online and retail presence, Latin America represents a steady but modest growth opportunity.
Middle East & Africa
The Middle East & Africa (MEA) region held a 7.8% share of the global smart shoes market in 2024. Demand is driven by rising health awareness, growing middle‑class populations in urban centers, and increasing interest in wearable fitness products. As digital penetration improves and global footwear brands expand regionally, consumers particularly younger, tech‑savvy individuals begin adopting smart shoes. However, infrastructure limitations, varying disposable incomes, and limited awareness continue to moderate growth. As awareness and distribution channels improve, MEA offers a gradually expanding but still under‑penetrated market.
Market Segmentations:
By Type :
- Step Counting
- Positioning
- Navigation
By End User
- Adults
- Children
- Senior Citizens
- People with Disabilities
By Sales Channel
- Modern Trade
- Convenience Stores
- Specialty Stores
- Online Retailers
By Geography
- North America
- Europe
- Germany
- France
- U.K.
- Italy
- Spain
- Rest of Europe
- Asia Pacific
- China
- Japan
- India
- South Korea
- South-east Asia
- Rest of Asia Pacific
- Latin America
- Brazil
- Argentina
- Rest of Latin America
- Middle East & Africa
- GCC Countries
- South Africa
- Rest of the Middle East and Africa
Competitive Landscape
The smart shoes market is highly competitive and includes major players such as Nike, Inc., Digitsole, Adidas Group, PUMA SE, Under Armour, Inc., Salted Venture Inc., Sole Power, LLC, No New Folk Studio Inc., Intellinium, and Powerlace Technology Inc. Industry competition centers on rapid product innovation, technological differentiation, and brand positioning aimed at both fitness‑oriented and lifestyle segments. Leading firms regularly launch new models like self‑lacing footwear, integrated sensor shoes, and app‑linked performance trackers to address evolving consumer preferences for functionality and convenience. Smaller, niche players challenge incumbents by targeting specialized applications such as rehabilitation, mobility assistance, or biomechanics analytics offering tailored solutions that large brands may not prioritize. These firms often emphasize data‑driven value propositions, lower-cost alternatives, or regionally relevant designs. The competitive pressure encourages continuous R&D, patenting of new sensor or auto‑fit technologies, and strategic collaborations (e.g., between footwear manufacturers and tech companies).
Key Player Analysis
- Nike, Inc.
- Sole Power, LLC
- PUMA SE
- Intellinium
- Adidas Group
- Under Armour, Inc.
- B‑Shoe Ltd
- Salted Venture Inc.
- Powerlace Technology Inc.
- Digitsole
Recent Developments
- In October 2025, Nike, Inc. announced Project Amplify a powered footwear system developed with robotics firm Dephy aimed at enhancing walking and running performance via a battery‑powered motor and brace, seeking to boost mobility and performance.
- In July 2025, Paragon Footwear announced a partnership with FreshFeet to launch a new range of smart school shoes aimed at children.
- In October 2025, Nike in collaboration with bionic‑footwear company Dephy unveiled Project Amplify, a powered footwear system for running and walking, marking one of the first motorised “smart shoe” efforts designed to enhance mobility.
Shape Your Report to Specific Countries or Regions & Enjoy 30% Off!
Report Coverage
The research report offers an in-depth analysis based on Type, End User, Sales Channel and Geography. It details leading market players, providing an overview of their business, product offerings, investments, revenue streams, and key applications. Additionally, the report includes insights into the competitive environment, SWOT analysis, current market trends, as well as the primary drivers and constraints. Furthermore, it discusses various factors that have driven market expansion in recent years. The report also explores market dynamics, regulatory scenarios, and technological advancements that are shaping the industry. It assesses the impact of external factors and global economic changes on market growth. Lastly, it provides strategic recommendations for new entrants and established companies to navigate the complexities of the market.
Future Outlook
- Adoption of smart shoes will accelerate as sensor technology becomes more accurate, compact, and affordable.
- Integration of smart shoes with broader health‑tech ecosystems (fitness apps, wearables, medical devices) will expand use cases beyond sports.
- Growing interest in assisted mobility and rehabilitation will drive demand among senior citizens and people with disabilities.
- Brands will increasingly deploy AI analytics to offer personalized gait, posture, and injury‑prevention insights.
- Direct‑to‑consumer and online retail channels will scale globally, improving accessibility and reducing distribution costs.
- Rising health and wellness awareness will make smart shoes part of everyday lifestyle choices beyond athletic use.
- Collaborations between footwear companies and tech firms will lead to hybrid designs combining fashion, comfort, and intelligence.
- Regional expansion in emerging markets will create new growth pockets as urban populations rise.
- Demand for sustainable, durable materials and recyclable components will grow, aligning smart shoes with circular economy goals.
- Longitudinal health monitoring via smart shoes will support preventative care trends and attract interest from healthcare sectors.


