CHAPTER NO. 1 : INTRODUCTION 30
1.1. Report Description 30
Purpose of the Report 30
USP & Key Offerings 30
1.2. Key Benefits for Stakeholders 31
1.3. Target Audience 31
CHAPTER NO. 2 : EXECUTIVE SUMMARY 32
CHAPTER NO. 3 : AUTOMOTIVE MOTOR CORE MARKET FORCES & INDUSTRY PULSE 34
3.1. Foundations of Change – Market Overview 34
3.2. Catalysts of Expansion – Key Market Drivers 36
3.2.1. Momentum Boosters – Growth Triggers 37
3.2.2. Innovation Fuel – Disruptive Technologies 37
3.3. Headwinds & Crosswinds – Market Restraints 38
3.3.1. Regulatory Tides – Compliance Challenges 39
3.3.2. Economic Frictions – Inflationary Pressures 39
3.4. Untapped Horizons – Growth Potential & Opportunities and Strategic Navigation – Industry Frameworks 40
3.5. Market Equilibrium – Porter’s Five Forces 41
3.6. Ecosystem Dynamics – Value Chain Analysis 43
3.7. Macro Forces – PESTEL Breakdown 45
3.8. Price Trend Analysis 47
3.8.1. Regional Price Trend 48
3.8.2. Price Trend by Type 48
3.9. Buying Criteria 49
CHAPTER NO. 4 : COMPETITION ANALYSIS 50
4.1. Company Market Share Analysis 50
4.1.1. Global Automotive Motor Core Market Company Volume Market Share 50
4.1.2. Global Automotive Motor Core Market Company Revenue Market Share 52
4.2. Strategic Developments 54
4.2.1. Acquisitions & Mergers 54
4.2.2. New Product Type Launch 55
4.2.3. Agreements & Collaborations 56
4.3. Competitive Dashboard 57
4.4. Company Assessment Metrics, 2024 58
CHAPTER NO. 5 : GLOBAL MARKET ANALYSIS, INSIGHTS & FORECAST, BY PRODUCT TYPE 59
CHAPTER NO. 6 : GLOBAL MARKET ANALYSIS, INSIGHTS & FORECAST, BY APPLICATION 64
CHAPTER NO. 7 : GLOBAL MARKET ANALYSIS, INSIGHTS & FORECAST, BY END-USER 69
CHAPTER NO. 8 : GLOBAL MARKET ANALYSIS, INSIGHTS & FORECAST, BY MATERIAL TYPE 74
CHAPTER NO. 9 : GLOBAL MARKET ANALYSIS, INSIGHTS & FORECAST, BY MANUFACTURING PROCESS 78
CHAPTER NO. 10 : GLOBAL MARKET ANALYSIS, INSIGHTS & FORECAST, BY MOTOR SIZE 82
CHAPTER NO. 11 : GLOBAL MARKET ANALYSIS, INSIGHTS & FORECAST, BY REGION 86
CHAPTER NO. 12 : NORTH AMERICA MARKET ANALYSIS, INSIGHTS & FORECAST, BY COUNTRY 91
12.1. North America Market Analysis, Insights & Forecast, by Product Type 94
12.2. North America Market Analysis, Insights & Forecast, by Application 96
12.3. North America Market Analysis, Insights & Forecast, by End-user 98
12.4. North America Market Analysis, Insights & Forecast, by Material Type 100
12.5. North America Market Analysis, Insights & Forecast, by Manufacturing Process 102
12.6. North America Market Analysis, Insights & Forecast, by Motor Size 104
CHAPTER NO. 13 : EUROPE MARKET ANALYSIS, INSIGHTS & FORECAST, BY COUNTRY 106
13.1. Europe Market Analysis, Insights & Forecast, by Product Type 111
13.2. Europe Market Analysis, Insights & Forecast, by Application 113
13.3. Europe Market Analysis, Insights & Forecast, by End-user 115
13.4. Europe Market Analysis, Insights & Forecast, by Material Type 117
13.5. Europe Market Analysis, Insights & Forecast, by Manufacturing Process 119
13.6. Europe Market Analysis, Insights & Forecast, by Motor Size 121
CHAPTER NO. 14 : ASIA PACIFIC MARKET ANALYSIS, INSIGHTS & FORECAST, BY COUNTRY 123
14.1. Asia Pacific Market Analysis, Insights & Forecast, by Product Type 128
14.2. Asia Pacific Market Analysis, Insights & Forecast, by Application 130
14.3. Asia Pacific Market Analysis, Insights & Forecast, by End-user 132
14.4. Asia Pacific Market Analysis, Insights & Forecast, by Material Type 134
14.5. Asia Pacific Market Analysis, Insights & Forecast, by Manufacturing Process 136
14.6. Asia Pacific Market Analysis, Insights & Forecast, by Motor Size 138
CHAPTER NO. 15 : LATIN AMERICA MARKET ANALYSIS, INSIGHTS & FORECAST, BY COUNTRY 140
15.1. Latin America Market Analysis, Insights & Forecast, by Product Type 145
15.2. Latin America Market Analysis, Insights & Forecast, by Application 147
15.3. Latin America Market Analysis, Insights & Forecast, by End-user 149
15.4. Latin America Market Analysis, Insights & Forecast, by Material Type 151
15.5. Latin America Market Analysis, Insights & Forecast, by Manufacturing Process 153
15.6. Latin America Market Analysis, Insights & Forecast, by Motor Size 155
CHAPTER NO. 16 : MIDDLE EAST MARKET ANALYSIS, INSIGHTS & FORECAST, BY COUNTRY 157
16.1. Middle East Market Analysis, Insights & Forecast, by Product Type 163
16.2. Middle East Market Analysis, Insights & Forecast, by Application 165
16.3. Middle East Market Analysis, Insights & Forecast, by End-user 167
16.4. Middle East Market Analysis, Insights & Forecast, by Material Type 169
16.5. Middle East Market Analysis, Insights & Forecast, by Manufacturing Process 171
16.6. Middle East Market Analysis, Insights & Forecast, by Motor Size 173
CHAPTER NO. 17 : AFRICA MARKET ANALYSIS, INSIGHTS & FORECAST, BY COUNTRY 175
17.1. Africa Market Analysis, Insights & Forecast, by Product Type 180
17.2. Africa Market Analysis, Insights & Forecast, by Application 182
17.3. Africa Market Analysis, Insights & Forecast, by End-user 184
17.4. Africa Market Analysis, Insights & Forecast, by Material Type 186
17.5. Africa Market Analysis, Insights & Forecast, by Manufacturing Process 188
17.6. Africa Market Analysis, Insights & Forecast, by Motor Size 190
CHAPTER NO. 18 : COMPANY PROFILE 192
18.1. Siemens AG 192
18.2. Robert Bosch GmbH 195
18.3. Mitsubishi Electric Corporation 195
18.4. Nidec Corporation 195
18.5. ABB Ltd. 195
18.6. Hitachi Automotive Systems, Ltd. 195
18.7. Johnson Electric Holdings Limited 195
18.8. Toshiba Corporation 195
18.9. Denso Corporation 195
18.10. Continental AG 195
18.11. Valeo SA 195
18.12. Magna International Inc. 195
18.13. Mitsui High‑tec, Inc. 195
18.14. NHK Spring Co., Ltd. 195
18.15. Shinko Electric Industries Co., Ltd. 195
18.16. Brose Fahrzeugteile GmbH & Co. KG 195
18.17. Mahle GmbH 196
18.18. Yaskawa Electric Corporation 196
18.19. Wolong Electric Group Co., Ltd. 196
List of Figures
FIG NO. 1. Automotive Motor Core Market Revenue Share, By Product Type, 2024 & 2032 59
FIG NO. 2. Market Attractiveness Analysis, By Product Type 60
FIG NO. 3. Incremental Revenue Growth Opportunity by Product Type, 2024 – 2032 61
FIG NO. 4. Automotive Motor Core Market Revenue Share, By Application, 2024 & 2032 64
FIG NO. 5. Market Attractiveness Analysis, Application 65
FIG NO. 6. Incremental Revenue Growth Opportunity by Application, 2024 – 2032 66
FIG NO. 7. Automotive Motor Core Market Revenue Share, By End-user, 2024 & 2032 69
FIG NO. 8. Market Attractiveness Analysis, By End-user 70
FIG NO. 9. Incremental Revenue Growth Opportunity by End-user, 2024 – 2032 71
FIG NO. 10. Automotive Motor Core Market Revenue Share, By Material Type, 2024 & 2032 74
FIG NO. 11. Market Attractiveness Analysis, By Material Type 75
FIG NO. 12. Incremental Revenue Growth Opportunity by Material Type, 2024 – 2032 76
FIG NO. 13. Automotive Motor Core Market Revenue Share, By Manufacturing Process, 2024 & 2032 78
FIG NO. 14. Market Attractiveness Analysis, By Manufacturing Process 79
FIG NO. 15. Incremental Revenue Growth Opportunity by Manufacturing Process, 2024 – 2032 80
FIG NO. 16. Automotive Motor Core Market Revenue Share, By Motor Size, 2024 & 2032 82
FIG NO. 17. Market Attractiveness Analysis, By Motor Size 83
FIG NO. 18. Incremental Revenue Growth Opportunity by Motor Size, 2024 – 2032 84
FIG NO. 19. Automotive Motor Core Market Revenue Share, By Region, 2024 & 2032 86
FIG NO. 20. Market Attractiveness Analysis, By Region 87
FIG NO. 21. Incremental Revenue Growth Opportunity by Region, 2024 – 2032 88
FIG NO. 22. Automotive Motor Core Market Revenue Share, By Country, 2024 & 2032 91
FIG NO. 23. Automotive Motor Core Market Revenue Share, By Country, 2024 & 2032 106
FIG NO. 24. Automotive Motor Core Market Revenue Share, By Country, 2024 & 2032 123
FIG NO. 25. Automotive Motor Core Market Revenue Share, By Country, 2024 & 2032 140
FIG NO. 26. Automotive Motor Core Market Revenue Share, By Country, 2024 & 2032 157
FIG NO. 27. Automotive Motor Core Market Revenue Share, By Country, 2024 & 2032 175
List of Tables
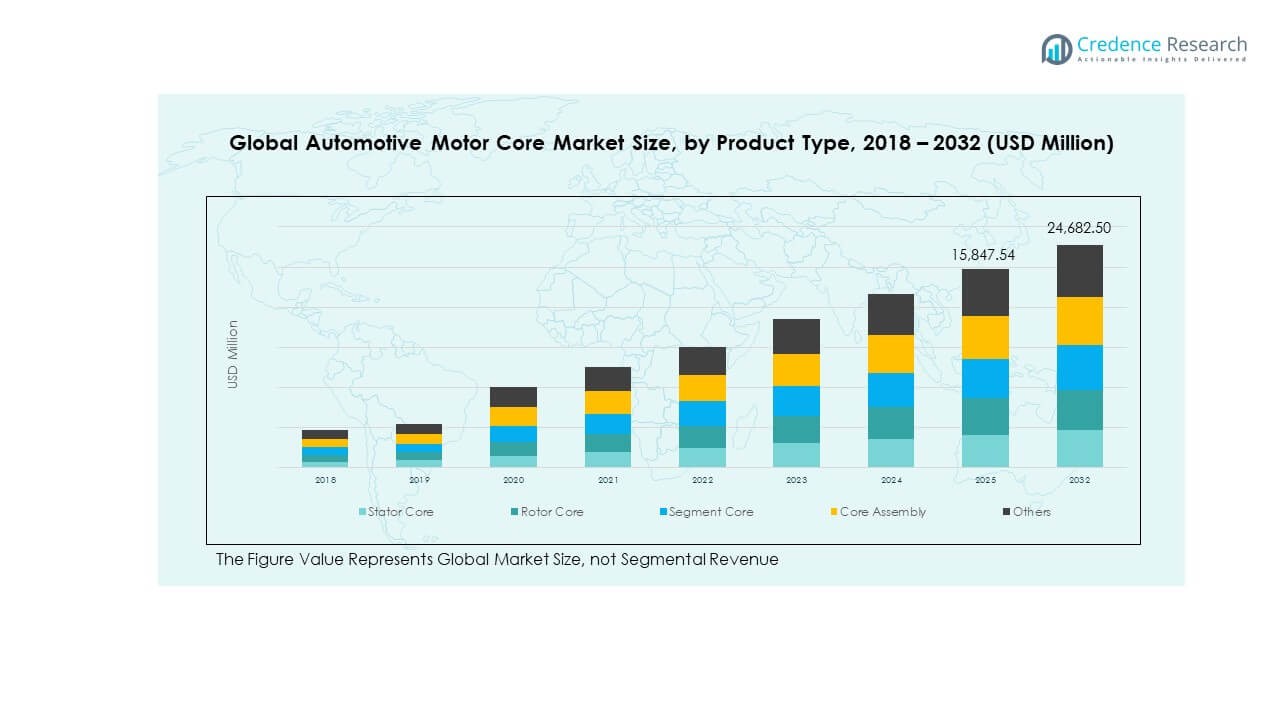
TABLE NO. 1. : Global Automotive Motor Core Market Revenue, By Product Type, 2018 – 2024 (USD Million) 62
TABLE NO. 2. : Global Automotive Motor Core Market Revenue, By Product Type, 2025 – 2032 (USD Million) 62
TABLE NO. 3. : Global Automotive Motor Core Market Revenue, By Product Type, 2018 – 2024 (K Units) 63
TABLE NO. 4. : Global Automotive Motor Core Market Revenue, By Product Type, 2025 – 2032 (K Units) 63
TABLE NO. 5. : Global Automotive Motor Core Market Revenue, By Application, 2018 – 2024 (USD Million) 67
TABLE NO. 6. : Global Automotive Motor Core Market Revenue, By Application, 2025 – 2032 (USD Million) 67
TABLE NO. 7. : Global Automotive Motor Core Market Revenue, By Application, 2018 – 2024 (K Units) 68
TABLE NO. 8. : Global Automotive Motor Core Market Revenue, By Application, 2025 – 2032 (K Units) 68
TABLE NO. 9. : Global Automotive Motor Core Market Revenue, By End-user, 2018 – 2024 (USD Million) 72
TABLE NO. 10. : Global Automotive Motor Core Market Revenue, By End-user, 2025 – 2032 (USD Million) 72
TABLE NO. 11. : Global Automotive Motor Core Market Revenue, By End-user, 2018 – 2024 (K Units) 73
TABLE NO. 12. : Global Automotive Motor Core Market Revenue, By End-user, 2025 – 2032 (K Units) 73
TABLE NO. 13. : Global Automotive Motor Core Market Revenue, By Material Type, 2018 – 2024 (USD Million) 77
TABLE NO. 14. : Global Automotive Motor Core Market Revenue, By Material Type, 2025 – 2032 (USD Million) 77
TABLE NO. 15. : Global Automotive Motor Core Market Revenue, By Manufacturing Process, 2018 – 2024 (USD Million) 81
TABLE NO. 16. : Global Automotive Motor Core Market Revenue, By Manufacturing Process, 2025 – 2032 (USD Million) 81
TABLE NO. 17. : Global Automotive Motor Core Market Revenue, By Motor Size , 2018 – 2024 (USD Million) 85
TABLE NO. 18. : Global Automotive Motor Core Market Revenue, By Material Type, 2025 – 2032 (USD Million) 85
TABLE NO. 19. : Global Automotive Motor Core Market Revenue, By Region, 2018 – 2024 (USD Million) 89
TABLE NO. 20. : Global Automotive Motor Core Market Revenue, By Region, 2025– 2032 (USD Million) 90
TABLE NO. 21. : North America Automotive Motor Core Market Revenue, By Country, 2018 – 2024 (USD Million) 92
TABLE NO. 22. : North America Automotive Motor Core Market Revenue, By Country, 2025– 2032 (USD Million) 92
TABLE NO. 23. : North America Automotive Motor Core Market Revenue, By Country, 2018 – 2024 (K Units) 93
TABLE NO. 24. : North America Automotive Motor Core Market Revenue, By Country, 2025– 2032 (K Units) 93
TABLE NO. 25. : North America Automotive Motor Core Market Revenue, By Product Type, 2018 – 2024 (USD Million) 94
TABLE NO. 26. : North America Automotive Motor Core Market Revenue, By Product Type, 2025 – 2032 (USD Million) 94
TABLE NO. 27. : North America Automotive Motor Core Market Revenue, By Product Type, 2018 – 2024 (K Units) 95
TABLE NO. 28. : North America Automotive Motor Core Market Revenue, By Product Type, 2025 – 2032 (K Units) 95
TABLE NO. 29. : North America Automotive Motor Core Market Revenue, By Application, 2018 – 2024 (USD Million) 96
TABLE NO. 30. : North America Automotive Motor Core Market Revenue, By Application, 2025 – 2032 (USD Million) 96
TABLE NO. 31. : North America Automotive Motor Core Market Revenue, By Application, 2018 – 2024 (K Units) 97
TABLE NO. 32. : North America Automotive Motor Core Market Revenue, By Application, 2025 – 2032 (K Units) 97
TABLE NO. 33. : North America Automotive Motor Core Market Revenue, By End-user, 2018 – 2024 (USD Million) 98
TABLE NO. 34. : North America Automotive Motor Core Market Revenue, By End-user, 2025 – 2032 (USD Million) 98
TABLE NO. 35. : North America Automotive Motor Core Market Revenue, By End-user, 2018 – 2024 (K Units) 99
TABLE NO. 36. : North America Automotive Motor Core Market Revenue, By End-user, 2025 – 2032 (K Units) 99
TABLE NO. 37. : North America Automotive Motor Core Market Revenue, By Material Type, 2018 – 2024 (USD Million) 100
TABLE NO. 38. : North America Automotive Motor Core Market Revenue, By Material Type, 2025 – 2032 (USD Million) 100
TABLE NO. 39. : North America Automotive Motor Core Market Revenue, By Material Type, 2018 – 2024 (K Units) 101
TABLE NO. 40. : North America Automotive Motor Core Market Revenue, By Material Type, 2025 – 2032 (K Units) 101
TABLE NO. 41. : North America Automotive Motor Core Market Revenue, By Manufacturing Process, 2018 – 2024 (USD Million) 102
TABLE NO. 42. : North America Automotive Motor Core Market Revenue, By Manufacturing Process, 2025 – 2032 (USD Million) 102
TABLE NO. 43. : North America Automotive Motor Core Market Revenue, By Manufacturing Process, 2018 – 2024 (K Units) 103
TABLE NO. 44. : North America Automotive Motor Core Market Revenue, By Manufacturing Process, 2025 – 2032 (K Units) 103
TABLE NO. 45. : North America Automotive Motor Core Market Revenue, By Motor Size, 2018 – 2024 (USD Million) 104
TABLE NO. 46. : North America Automotive Motor Core Market Revenue, By Motor Size, 2025 – 2032 (USD Million) 104
TABLE NO. 47. : North America Automotive Motor Core Market Revenue, By Motor Size, 2018 – 2024 (K Units) 105
TABLE NO. 48. : North America Automotive Motor Core Market Revenue, By Motor Size, 2025 – 2032 (K Units) 105
TABLE NO. 49. : Europe Automotive Motor Core Market Revenue, By Country, 2018 – 2024 (USD Million) 107
TABLE NO. 50. : Europe Automotive Motor Core Market Revenue, By Country, 2025– 2032 (USD Million) 108
TABLE NO. 51. : Europe Automotive Motor Core Market Revenue, By Country, 2018 – 2024 (K Units) 109
TABLE NO. 52. : Europe Automotive Motor Core Market Revenue, By Country, 2025– 2032 (K Units) 110
TABLE NO. 53. : North America Automotive Motor Core Market Revenue, By Product Type, 2018 – 2024 (USD Million) 111
TABLE NO. 54. : North America Automotive Motor Core Market Revenue, By Product Type, 2025 – 2032 (USD Million) 111
TABLE NO. 55. : Europe Automotive Motor Core Market Revenue, By Product Type, 2018 – 2024 (K Units) 112
TABLE NO. 56. : Europe Automotive Motor Core Market Revenue, By Product Type, 2025 – 2032 (K Units) 112
TABLE NO. 57. : Europe Automotive Motor Core Market Revenue, By Application, 2018 – 2024 (USD Million) 113
TABLE NO. 58. : Europe Automotive Motor Core Market Revenue, By Application, 2025 – 2032 (USD Million) 113
TABLE NO. 59. : Europe Automotive Motor Core Market Revenue, By Application, 2018 – 2024 (K Units) 114
TABLE NO. 60. : Europe Automotive Motor Core Market Revenue, By Application, 2025 – 2032 (K Units) 114
TABLE NO. 61. : Europe Automotive Motor Core Market Revenue, By End-user, 2018 – 2024 (USD Million) 115
TABLE NO. 62. : Europe Automotive Motor Core Market Revenue, By End-user, 2025 – 2032 (USD Million) 115
TABLE NO. 63. : Europe Automotive Motor Core Market Revenue, By End-user, 2018 – 2024 (K Units) 116
TABLE NO. 64. : Europe Automotive Motor Core Market Revenue, By End-user, 2025 – 2032 (K Units) 116
TABLE NO. 65. : Europe Automotive Motor Core Market Revenue, By Material Type, 2018 – 2024 (USD Million) 117
TABLE NO. 66. : Europe Automotive Motor Core Market Revenue, By Material Type, 2025 – 2032 (USD Million) 117
TABLE NO. 67. : Europe Automotive Motor Core Market Revenue, By Material Type, 2018 – 2024 (K Units) 118
TABLE NO. 68. : Europe Automotive Motor Core Market Revenue, By Material Type, 2025 – 2032 (K Units) 118
TABLE NO. 69. : Europe Automotive Motor Core Market Revenue, By Manufacturing Process, 2018 – 2024 (USD Million) 119
TABLE NO. 70. : Europe Automotive Motor Core Market Revenue, By Manufacturing Process, 2025 – 2032 (USD Million) 119
TABLE NO. 71. : Europe Automotive Motor Core Market Revenue, By Manufacturing Process, 2018 – 2024 (K Units) 120
TABLE NO. 72. : Europe Automotive Motor Core Market Revenue, By Manufacturing Process, 2025 – 2032 (K Units) 120
TABLE NO. 73. : Europe Automotive Motor Core Market Revenue, By Motor Size, 2018 – 2024 (USD Million) 121
TABLE NO. 74. : Europe Automotive Motor Core Market Revenue, By Motor Size, 2025 – 2032 (USD Million) 121
TABLE NO. 75. : Europe Automotive Motor Core Market Revenue, By Motor Size, 2018 – 2024 (K Units) 122
TABLE NO. 76. : Europe Automotive Motor Core Market Revenue, By Motor Size, 2025 – 2032 (K Units) 122
TABLE NO. 77. : Asia Pacific Automotive Motor Core Market Revenue, By Country, 2018 – 2024 (USD Million) 124
TABLE NO. 78. : Asia Pacific Automotive Motor Core Market Revenue, By Country, 2025– 2032 (USD Million) 125
TABLE NO. 79. : Asia Pacific Automotive Motor Core Market Revenue, By Country, 2018 – 2024 (K Units) 126
TABLE NO. 80. : Asia Pacific Automotive Motor Core Market Revenue, By Country, 2025– 2032 (K Units) 127
TABLE NO. 81. : Asia Pacific Automotive Motor Core Market Revenue, By Product Type, 2018 – 2024 (USD Million) 128
TABLE NO. 82. : Asia Pacific Automotive Motor Core Market Revenue, By Product Type, 2025 – 2032 (USD Million) 128
TABLE NO. 83. : Asia Pacific Automotive Motor Core Market Revenue, By Product Type, 2018 – 2024 (K Units) 129
TABLE NO. 84. : Asia Pacific Automotive Motor Core Market Revenue, By Product Type, 2025 – 2032 (K Units) 129
TABLE NO. 85. : Asia Pacific Automotive Motor Core Market Revenue, By Application, 2018 – 2024 (USD Million) 130
TABLE NO. 86. : Asia Pacific Automotive Motor Core Market Revenue, By Application, 2025 – 2032 (USD Million) 130
TABLE NO. 87. : Asia Pacific Automotive Motor Core Market Revenue, By Application, 2018 – 2024 (K Units) 131
TABLE NO. 88. : Asia Pacific Automotive Motor Core Market Revenue, By Application, 2025 – 2032 (K Units) 131
TABLE NO. 89. : Asia Pacific Automotive Motor Core Market Revenue, By End-user, 2018 – 2024 (USD Million) 132
TABLE NO. 90. : Asia Pacific Automotive Motor Core Market Revenue, By End-user, 2025 – 2032 (USD Million) 132
TABLE NO. 91. : Asia Pacific Automotive Motor Core Market Revenue, By End-user, 2018 – 2024 (K Units) 133
TABLE NO. 92. : Asia Pacific Automotive Motor Core Market Revenue, By End-user, 2025 – 2032 (K Units) 133
TABLE NO. 93. : Asia Pacific Automotive Motor Core Market Revenue, By Material Type, 2018 – 2024 (USD Million) 134
TABLE NO. 94. : Asia Pacific Automotive Motor Core Market Revenue, By Material Type, 2025 – 2032 (USD Million) 134
TABLE NO. 95. : Asia Pacific Automotive Motor Core Market Revenue, By Material Type, 2018 – 2024 (K Units) 135
TABLE NO. 96. : Asia Pacific Automotive Motor Core Market Revenue, By Material Type, 2025 – 2032 (K Units) 135
TABLE NO. 97. : Asia Pacific Automotive Motor Core Market Revenue, By Manufacturing Process, 2018 – 2024 (USD Million) 136
TABLE NO. 98. : Asia Pacific Automotive Motor Core Market Revenue, By Manufacturing Process, 2025 – 2032 (USD Million) 136
TABLE NO. 99. : Asia Pacific Automotive Motor Core Market Revenue, By Manufacturing Process, 2018 – 2024 (K Units) 137
TABLE NO. 100. : Asia Pacific Automotive Motor Core Market Revenue, By Manufacturing Process, 2025 – 2032 (K Units) 137
TABLE NO. 101. : Asia Pacific Automotive Motor Core Market Revenue, By Motor Size, 2018 – 2024 (USD Million) 138
TABLE NO. 102. : Asia Pacific Automotive Motor Core Market Revenue, By Motor Size, 2025 – 2032 (USD Million) 138
TABLE NO. 103. : Asia Pacific Automotive Motor Core Market Revenue, By Motor Size, 2018 – 2024 (K Units) 139
TABLE NO. 104. : Asia Pacific Automotive Motor Core Market Revenue, By Motor Size, 2025 – 2032 (K Units) 139
TABLE NO. 105. : Latin America Automotive Motor Core Market Revenue, By Country, 2018 – 2024 (USD Million) 141
TABLE NO. 106. : Latin America Automotive Motor Core Market Revenue, By Country, 2025– 2032 (USD Million) 142
TABLE NO. 107. : Latin America Automotive Motor Core Market Revenue, By Country, 2018 – 2024 (K Units) 143
TABLE NO. 108. : Latin America Automotive Motor Core Market Revenue, By Country, 2025– 2032 (K Units) 144
TABLE NO. 109. : Latin America Automotive Motor Core Market Revenue, By Product Type, 2018 – 2024 (USD Million) 145
TABLE NO. 110. : Latin America Automotive Motor Core Market Revenue, By Product Type, 2025 – 2032 (USD Million) 145
TABLE NO. 111. : Latin America Automotive Motor Core Market Revenue, By Product Type, 2018 – 2024 (K Units) 146
TABLE NO. 112. : Latin America Automotive Motor Core Market Revenue, By Product Type, 2025 – 2032 (K Units) 146
TABLE NO. 113. : Latin America Automotive Motor Core Market Revenue, By Application, 2018 – 2024 (USD Million) 147
TABLE NO. 114. : Latin America Automotive Motor Core Market Revenue, By Application, 2025 – 2032 (USD Million) 147
TABLE NO. 115. : Latin America Automotive Motor Core Market Revenue, By Application, 2018 – 2024 (K Units) 148
TABLE NO. 116. : Latin America Automotive Motor Core Market Revenue, By Application, 2025 – 2032 (K Units) 148
TABLE NO. 117. : Latin America Automotive Motor Core Market Revenue, By End-user, 2018 – 2024 (USD Million) 149
TABLE NO. 118. : Latin America Automotive Motor Core Market Revenue, By End-user, 2025 – 2032 (USD Million) 149
TABLE NO. 119. : Latin America Automotive Motor Core Market Revenue, By End-user, 2018 – 2024 (K Units) 150
TABLE NO. 120. : Latin America Automotive Motor Core Market Revenue, By End-user, 2025 – 2032 (K Units) 150
TABLE NO. 121. : Latin America Automotive Motor Core Market Revenue, By Material Type, 2018 – 2024 (USD Million) 151
TABLE NO. 122. : Latin America Automotive Motor Core Market Revenue, By Material Type, 2025 – 2032 (USD Million) 151
TABLE NO. 123. : Latin America Automotive Motor Core Market Revenue, By Material Type, 2018 – 2024 (K Units) 152
TABLE NO. 124. : Latin America Automotive Motor Core Market Revenue, By Material Type, 2025 – 2032 (K Units) 152
TABLE NO. 125. : Latin America Automotive Motor Core Market Revenue, By Manufacturing Process, 2018 – 2024 (USD Million) 153
TABLE NO. 126. : Latin America Automotive Motor Core Market Revenue, By Manufacturing Process, 2025 – 2032 (USD Million) 153
TABLE NO. 127. : Latin America Automotive Motor Core Market Revenue, By Manufacturing Process, 2018 – 2024 (K Units) 154
TABLE NO. 128. : Latin America Automotive Motor Core Market Revenue, By Manufacturing Process, 2025 – 2032 (K Units) 154
TABLE NO. 129. : Latin America Automotive Motor Core Market Revenue, By Motor Size, 2018 – 2024 (USD Million) 155
TABLE NO. 130. : Latin America Automotive Motor Core Market Revenue, By Motor Size, 2025 – 2032 (USD Million) 155
TABLE NO. 131. : Latin America Automotive Motor Core Market Revenue, By Motor Size, 2018 – 2024 (K Units) 156
TABLE NO. 132. : Latin America Automotive Motor Core Market Revenue, By Motor Size, 2025 – 2032 (K Units) 156
TABLE NO. 133. : Middle East Automotive Motor Core Market Revenue, By Country, 2018 – 2024 (USD Million) 158
TABLE NO. 134. : Middle East Automotive Motor Core Market Revenue, By Country, 2025– 2032 (USD Million) 159
TABLE NO. 135. : Middle East Automotive Motor Core Market Revenue, By Country, 2018 – 2024 (K Units) 160
TABLE NO. 136. : Middle East Automotive Motor Core Market Revenue, By Country, 2025– 2032 (K Units) 161
TABLE NO. 137. : Middle East Automotive Motor Core Market Revenue, By Product Type, 2018 – 2024 (USD Million) 163
TABLE NO. 138. : Middle East Automotive Motor Core Market Revenue, By Product Type, 2025 – 2032 (USD Million) 163
TABLE NO. 139. : Middle East Automotive Motor Core Market Revenue, By Product Type, 2018 – 2024 (K Units) 164
TABLE NO. 140. : Middle East Automotive Motor Core Market Revenue, By Product Type, 2025 – 2032 (K Units) 164
TABLE NO. 141. : Middle East Automotive Motor Core Market Revenue, By Application, 2018 – 2024 (USD Million) 165
TABLE NO. 142. : Middle East Automotive Motor Core Market Revenue, By Application, 2025 – 2032 (USD Million) 165
TABLE NO. 143. : Middle East Automotive Motor Core Market Revenue, By Application, 2018 – 2024 (K Units) 166
TABLE NO. 144. : Middle East Automotive Motor Core Market Revenue, By Application, 2025 – 2032 (K Units) 166
TABLE NO. 145. : Middle East Automotive Motor Core Market Revenue, By End-user, 2018 – 2024 (USD Million) 167
TABLE NO. 146. : Middle East Automotive Motor Core Market Revenue, By End-user, 2025 – 2032 (USD Million) 167
TABLE NO. 147. : Middle East Automotive Motor Core Market Revenue, By End-user, 2018 – 2024 (K Units) 168
TABLE NO. 148. : Middle East Automotive Motor Core Market Revenue, By End-user, 2025 – 2032 (K Units) 168
TABLE NO. 149. : Middle East Automotive Motor Core Market Revenue, By Material Type, 2018 – 2024 (USD Million) 169
TABLE NO. 150. : Middle East Automotive Motor Core Market Revenue, By Material Type, 2025 – 2032 (USD Million) 169
TABLE NO. 151. : Middle East Automotive Motor Core Market Revenue, By Material Type, 2018 – 2024 (K Units) 170
TABLE NO. 152. : Middle East Automotive Motor Core Market Revenue, By Material Type, 2025 – 2032 (K Units) 170
TABLE NO. 153. : Middle East Automotive Motor Core Market Revenue, By Manufacturing Process, 2018 – 2024 (USD Million) 171
TABLE NO. 154. : Middle East Automotive Motor Core Market Revenue, By Manufacturing Process, 2025 – 2032 (USD Million) 171
TABLE NO. 155. : Middle East Automotive Motor Core Market Revenue, By Manufacturing Process, 2018 – 2024 (K Units) 172
TABLE NO. 156. : Middle East Automotive Motor Core Market Revenue, By Manufacturing Process, 2025 – 2032 (K Units) 172
TABLE NO. 157. : Middle East Automotive Motor Core Market Revenue, By Motor Size, 2018 – 2024 (USD Million) 173
TABLE NO. 158. : Middle East Automotive Motor Core Market Revenue, By Motor Size, 2025 – 2032 (USD Million) 173
TABLE NO. 159. : Middle East Automotive Motor Core Market Revenue, By Motor Size, 2018 – 2024 (K Units) 174
TABLE NO. 160. : Middle East Automotive Motor Core Market Revenue, By Motor Size, 2025 – 2032 (K Units) 174
TABLE NO. 161. : Africa Automotive Motor Core Market Revenue, By Country, 2018 – 2024 (USD Million) 176
TABLE NO. 162. : Africa Automotive Motor Core Market Revenue, By Country, 2025– 2032 (USD Million) 177
TABLE NO. 163. : Africa Automotive Motor Core Market Revenue, By Country, 2018 – 2024 (K Units) 178
TABLE NO. 164. : Africa Automotive Motor Core Market Revenue, By Country, 2025– 2032 (K Units) 179
TABLE NO. 165. : Africa Automotive Motor Core Market Revenue, By Product Type, 2018 – 2024 (USD Million) 180
TABLE NO. 166. : Africa Automotive Motor Core Market Revenue, By Product Type, 2025 – 2032 (USD Million) 180
TABLE NO. 167. : Africa Automotive Motor Core Market Revenue, By Product Type, 2018 – 2024 (K Units) 181
TABLE NO. 168. : Africa Automotive Motor Core Market Revenue, By Product Type, 2025 – 2032 (K Units) 181
TABLE NO. 169. : Africa Automotive Motor Core Market Revenue, By Application, 2018 – 2024 (USD Million) 182
TABLE NO. 170. : Africa Automotive Motor Core Market Revenue, By Application, 2025 – 2032 (USD Million) 182
TABLE NO. 171. : Africa Automotive Motor Core Market Revenue, By Application, 2018 – 2024 (K Units) 183
TABLE NO. 172. : Africa Automotive Motor Core Market Revenue, By Application, 2025 – 2032 (K Units) 183
TABLE NO. 173. : Africa Automotive Motor Core Market Revenue, By End-user, 2018 – 2024 (USD Million) 184
TABLE NO. 174. : Africa Automotive Motor Core Market Revenue, By End-user, 2025 – 2032 (USD Million) 184
TABLE NO. 175. : Africa Automotive Motor Core Market Revenue, By End-user, 2018 – 2024 (K Units) 185
TABLE NO. 176. : Africa Automotive Motor Core Market Revenue, By End-user, 2025 – 2032 (K Units) 185
TABLE NO. 177. : Africa Automotive Motor Core Market Revenue, By Material Type, 2018 – 2024 (USD Million) 186
TABLE NO. 178. : Africa Automotive Motor Core Market Revenue, By Material Type, 2025 – 2032 (USD Million) 186
TABLE NO. 179. : Africa Automotive Motor Core Market Revenue, By Material Type, 2018 – 2024 (K Units) 187
TABLE NO. 180. : Africa Automotive Motor Core Market Revenue, By Material Type, 2025 – 2032 (K Units) 187
TABLE NO. 181. : Africa Automotive Motor Core Market Revenue, By Manufacturing Process, 2018 – 2024 (USD Million) 188
TABLE NO. 182. : Africa Automotive Motor Core Market Revenue, By Manufacturing Process, 2025 – 2032 (USD Million) 188
TABLE NO. 183. : Africa Automotive Motor Core Market Revenue, By Manufacturing Process, 2018 – 2024 (K Units) 189
TABLE NO. 184. : Africa Automotive Motor Core Market Revenue, By Manufacturing Process, 2025 – 2032 (K Units) 189
TABLE NO. 185. : Africa Automotive Motor Core Market Revenue, By Motor Size, 2018 – 2024 (USD Million) 190
TABLE NO. 186. : Africa Automotive Motor Core Market Revenue, By Motor Size, 2025 – 2032 (USD Million) 190
TABLE NO. 187. : Africa Automotive Motor Core Market Revenue, By Motor Size, 2018 – 2024 (K Units) 191
TABLE NO. 188. : Africa Automotive Motor Core Market Revenue, By Motor Size, 2025 – 2032 (K Units) 191