| REPORT ATTRIBUTE |
DETAILS |
| Historical Period |
2020-2023 |
| Base Year |
2024 |
| Forecast Period |
2025-2032 |
| Automotive LIDAR Sensors Market Size 2024 |
USD 1,936.31 Million |
| Automotive LIDAR Sensors Market, CAGR |
31.76% |
| Automotive LIDAR Sensors Market Size 2032 |
USD 17,460.18 Million |
Market Overview:
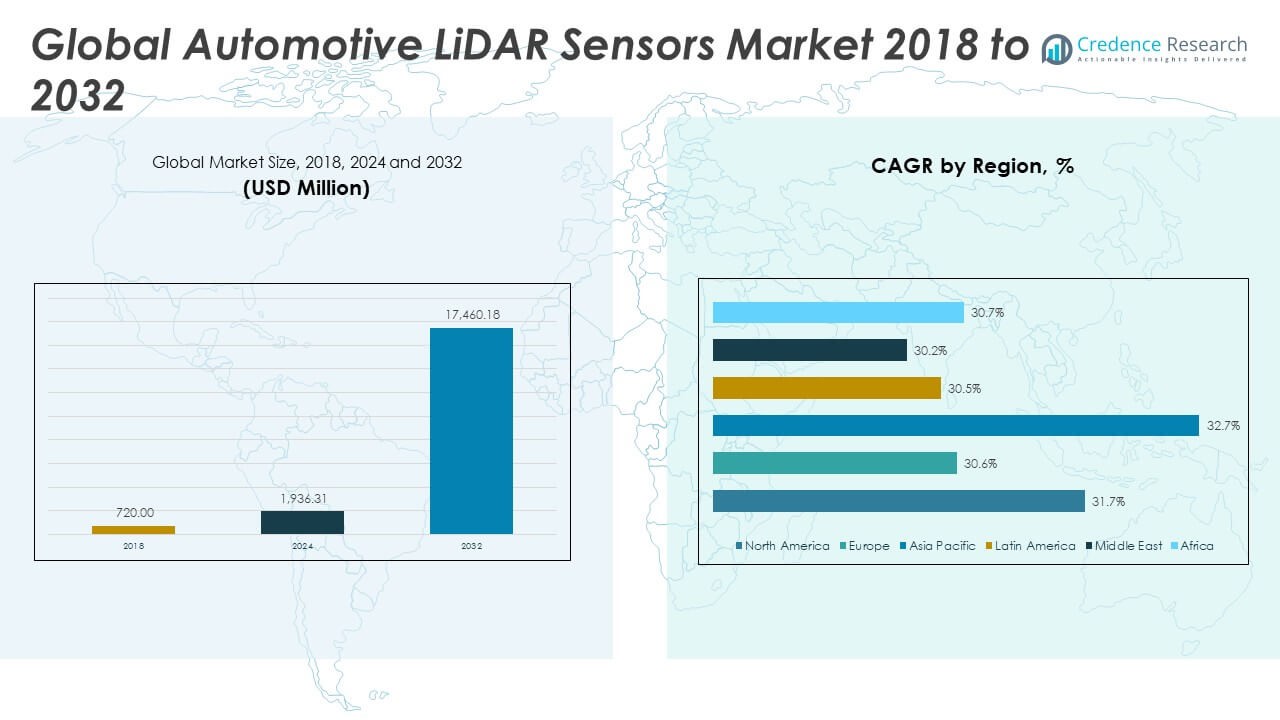
The Global Automotive LIDAR Sensors Market size was valued at USD 720.00 million in 2018 to USD 1,936.31 million in 2024 and is anticipated to reach USD 17,460.18 million by 2032, at a CAGR of 31.76% during the forecast period.
One of the primary drivers of the Global Automotive LiDAR Sensors Market is the rising demand for autonomous and semi-autonomous vehicles. LiDAR provides superior depth perception and object recognition, essential for enabling safe and efficient self-driving functionality. Governments and safety regulators in key markets are enforcing stricter vehicle safety norms, which are pushing automakers to include advanced sensor systems. The market is also being influenced by technological advancements such as solid-state LiDAR, frequency-modulated continuous wave (FMCW) systems, and AI-enhanced signal processing, which are improving performance while reducing cost and complexity. Strategic partnerships between OEMs and LiDAR technology providers are accelerating commercialization and fostering innovation. Furthermore, the rapid growth of electric and connected vehicle ecosystems is creating an ideal environment for LiDAR integration, where accurate environmental sensing is a crucial component of intelligent mobility.
Regionally, North America holds the largest share of the automotive LiDAR sensors market, supported by high investments in autonomous vehicle R&D, strong presence of tech firms, and early regulatory approvals for ADAS features. Europe follows closely, driven by increasing adoption of safety mandates and integration of LiDAR in premium vehicles by automakers such as Mercedes-Benz, BMW, and Volvo. The Asia-Pacific region is expected to witness the fastest growth rate due to China’s rapidly expanding autonomous driving ecosystem and the active role of domestic suppliers such as Hesai and RoboSense. Japan and South Korea are also investing in smart mobility initiatives that incorporate LiDAR technologies. Although the Latin American and Middle Eastern markets currently account for a smaller portion of global revenue, improving infrastructure and rising interest in vehicle safety standards are projected to stimulate gradual adoption in the coming years.
Access crucial information at unmatched prices!
Request your sample report today & start making informed decisions powered by Credence Research Inc.!
Download Sample
Market Insights:
- The Global Automotive LIDAR Sensors Market grew from USD 720.00 million in 2018 to USD 1,936.31 million in 2024 and is projected to reach USD 17,460.18 million by 2032, at a CAGR of 31.76%.
- LIDAR is increasingly used in ADAS applications such as lane keeping, automated parking, and collision avoidance to meet safety expectations and regulatory requirements.
- Rising deployment of autonomous and semi-autonomous vehicles is driving demand for LIDAR, with companies like Waymo and Cruise integrating it for real-time object detection and navigation.
- Advances in solid-state LIDAR are making sensors smaller, cheaper, and more durable, enabling wider adoption in mid-range and entry-level vehicles.
- Regulatory support from safety programs and smart mobility initiatives is encouraging OEMs to adopt LIDAR to meet compliance standards.
- High costs and complex integration processes continue to limit mass-market adoption, especially in vehicles with lower price sensitivity.
- North America holds the largest market share, while the Asia-Pacific region is witnessing the fastest growth due to increasing investment in autonomous driving technologies.
Market Drivers:
Expanding Use of LIDAR in Advanced Driver Assistance Systems (ADAS):
The Global Automotive LIDAR Sensors Market is gaining traction due to the growing importance of LIDAR in enhancing ADAS functionalities. Features like lane departure warning, automated parking, and cross-traffic alerts require high-resolution spatial awareness. LIDAR offers precise distance measurement and 3D mapping capabilities that complement cameras and radar systems. Automakers are incorporating LIDAR to meet consumer expectations for safety and driver convenience while complying with evolving vehicle safety regulations. As ADAS features move toward higher levels of automation, the need for reliable sensing technologies becomes critical.
- For instance, in 2024, Volvo announced that its EX90 SUV would be equipped with Luminar’s Iris LIDAR, delivering a 250-meter range with 10% reflectivity and a 120° horizontal field of view, supporting SAE Level 3 ADAS functions standard on every EX90 vehicle sold.
Rise in Autonomous and Semi-Autonomous Vehicle Deployment:
The increasing global emphasis on vehicle autonomy is significantly driving the demand for LIDAR sensors. Autonomous vehicles rely on LIDAR for situational awareness, object classification, and real-time obstacle detection. Companies like Tesla, Waymo, and Cruise are actively deploying sensor-rich platforms that include LIDAR as a core component. The Global Automotive LIDAR Sensors Market is benefiting from multi-billion-dollar investments in pilot projects, R&D, and production of Level 3 and above autonomous systems. The electrification of mobility further complements LIDAR adoption, with integrated vehicle platforms supporting sensor-driven features.
- For instance, Waymo’s fifth-generation autonomous vehicle platform, announced in 2023, includes custom roof-mounted LIDAR units capable of detecting objects at up to 300 meters and distinguishing shapes with centimeter-level accuracy, contributing to over 20 million autonomous miles driven on public roads.
Cost Optimization and Innovation in Solid-State LIDAR:
Technological advancements in LIDAR, particularly in solid-state variants, are transforming the market landscape. Unlike mechanical LIDAR systems that require moving parts, solid-state LIDAR uses fixed optical components, making it smaller, lighter, and more cost-effective. These systems are easier to integrate into vehicle designs and offer higher durability and scalability. Companies are investing in chip-based LIDAR and hybrid photonic platforms that deliver improved performance while reducing production costs. This is driving adoption in mid-range and mass-market vehicles, enabling broader access to autonomous features.
Policy Push and Regulatory Compliance for Road Safety:
Government regulations across major automotive markets are encouraging LIDAR adoption by setting high benchmarks for vehicle safety. Programs like the Euro NCAP and U.S. NHTSA safety ratings now reward vehicles with advanced sensing and automation capabilities. In emerging markets, authorities are launching smart mobility and smart city projects that incorporate LIDAR-enabled traffic management. The Global Automotive LIDAR Sensors Market is responding to these policy shifts by aligning product development with compliance standards. Regulatory incentives and pilot initiatives are also providing funding support to scale up LIDAR deployments.
Market Trends:
Multi-Sensor Fusion Becoming Standard in Vehicle Perception:
A notable trend in the Global Automotive LIDAR Sensors Market is the growing reliance on sensor fusion. Combining LIDAR with radar, cameras, and ultrasonic sensors enhances object detection reliability under diverse environmental conditions. Sensor fusion software processes data inputs to build a comprehensive and accurate 3D model of the vehicle’s surroundings. Automakers are standardizing fusion-based architectures to meet the safety requirements of advanced mobility systems. This integration reduces the individual limitations of each sensor type and boosts the effectiveness of ADAS and autonomous functions.
- For instance, Mercedes-Benz uses sensor fusion combining Valeo SCALA 2 LIDAR, radar, and camera arrays for Drive Pilot, its certified Level 3 autonomous driving system available in the 2024 S-Class and EQS, delivering automated object tracking, lane-level vehicle localization, and hands-off driving at speeds up to 40 mph.
LIDAR Miniaturization Enabling Seamless OEM Integration:
The push for sensor miniaturization is transforming how LIDAR systems are incorporated into vehicle designs. Compact LIDAR units can now be embedded into bumpers, headlamps, or side mirrors without disrupting the vehicle’s aesthetics or aerodynamics. This design evolution is making it easier for OEMs to offer LIDAR-equipped models across different classes of vehicles, from compact cars to SUVs. Smaller sensors also contribute to weight reduction and fuel efficiency, aligning with sustainability goals in vehicle manufacturing.
- For instance, Innoviz Technologies introduced the InnovizTwo LIDAR sensor in March 2024, featuring a compact, low-profile form factor (less than 45 mm height) and supporting complete automotive integration into both exterior trim and modular headlamp designs; the sensor offers 0.07° x 0.05° angular resolution across a 125° x 40° field, and is being deployed by multiple OEMs for 2025 vehicle models .
Emergence of LIDAR-as-a-Service and Fleet Subscriptions:
Automotive suppliers are introducing flexible service models that allow fleet operators and OEMs to access LIDAR technologies via subscriptions. This reduces capital expenditure while offering regular updates, maintenance, and performance analytics. LIDAR-as-a-Service is gaining popularity among shared mobility providers, robo-taxi services, and logistics companies that rely on automated navigation systems. These models provide scalable sensor access based on operational needs, creating recurring revenue streams for LIDAR manufacturers.
Strategic Collaborations Accelerating Product Commercialization:
Automakers and sensor companies are forming strategic alliances to co-develop and commercialize LIDAR-based systems. These partnerships accelerate time-to-market, ensure performance validation under real-world conditions, and reduce integration complexity. For instance, OEMs are entering exclusive agreements with LIDAR start-ups to supply sensors for specific vehicle platforms. Joint ventures, licensing arrangements, and R&D collaborations are becoming key instruments for innovation in the Global Automotive LIDAR Sensors Market.
Market Challenges Analysis:
High Cost and Integration Complexity Continue to Restrict Mass Adoption:
The Global Automotive LIDAR Sensors Market faces significant challenges related to the high cost of LiDAR systems and the complexity of their integration into vehicle platforms. Despite steady progress in reducing component costs, LiDAR sensors remain more expensive than traditional radar or camera systems. This pricing gap limits their adoption in mid-range and entry-level vehicles, where cost sensitivity is higher. The integration of LiDAR also requires alignment with existing sensor architectures, which can complicate vehicle design and calibration processes. Automakers must balance sensor redundancy, weight, energy consumption, and software compatibility, which increases development time and expenses. These barriers create hesitation among OEMs targeting mass-market rollouts and delay large-scale implementation of advanced autonomous functions.
Standardization Gaps and Environmental Limitations Affect Performance Reliability:
The lack of standardized testing protocols and performance benchmarks presents another major challenge for the Global Automotive LIDAR Sensors Market. It must address inconsistencies across sensor types, such as mechanical, solid-state, and FMCW LiDARs, to ensure interoperability and reliability. Current systems also struggle with environmental limitations such as rain, fog, snow, and reflective surfaces, which reduce signal accuracy and range. These constraints weaken sensor trustworthiness under real-world driving conditions and require redundant systems to compensate for potential failures. Regulatory uncertainty around approval processes for fully autonomous vehicles adds further complexity, leaving suppliers and OEMs without clear compliance guidelines. These unresolved issues could slow the deployment pace and hinder end-user confidence in LiDAR-based autonomous technologies.
Market Opportunities:
Rising Demand for Level 3+ Autonomy Unlocks Growth Potential:
The Global Automotive LIDAR Sensors Market holds significant opportunities with the growing deployment of Level 3 and higher autonomous driving systems. OEMs are actively investing in LiDAR to meet safety and perception requirements beyond the capabilities of cameras and radar alone. It stands to benefit from regulatory advancements that permit conditional automation in controlled environments. Consumer interest in semi-autonomous features such as highway pilot and automated parking is also creating demand for reliable sensing solutions. The integration of LiDAR into electric and premium vehicles is expanding, with brands positioning it as a key feature for differentiation. This trend is expected to drive both volume and value growth across global markets.
Emergence of Low-Cost, Solid-State LiDAR Accelerates Mass-Market Access:
Advancements in solid-state and chip-scale LiDAR technologies are opening new opportunities for the Global Automotive LIDAR Sensors Market. It can leverage these innovations to deliver compact, durable, and scalable solutions at lower price points. Tier-1 suppliers and startups are collaborating with automakers to integrate LiDAR into rooflines, grilles, and headlamps without design trade-offs. The rise of urban mobility platforms, robotaxis, and delivery vehicles also presents new end-use segments beyond private cars. Government support for smart mobility and smart city initiatives can further drive infrastructure-linked deployments. These developments are set to create long-term adoption pathways across both developed and emerging markets.
Market Segmentation Analysis:
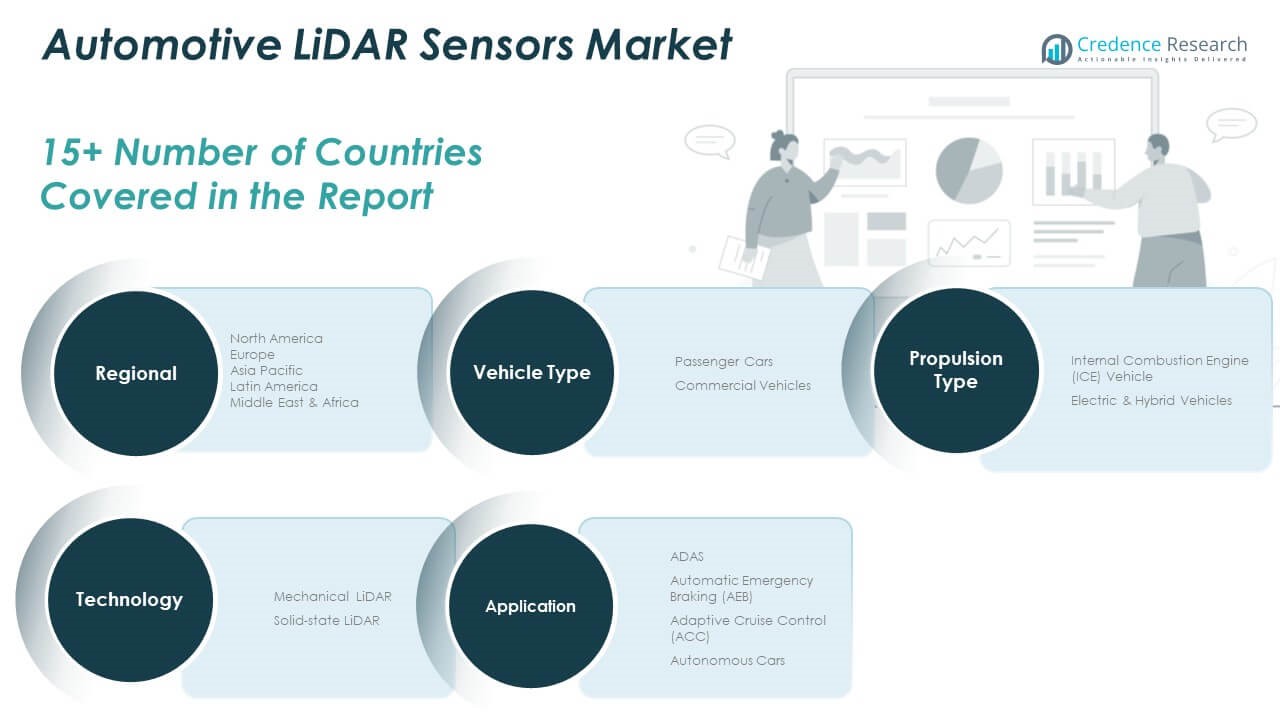
By Vehicle Type
The Global Automotive LIDAR Sensors Market sees higher adoption in passenger cars, driven by the integration of ADAS and autonomous features in premium and mid-range models. Passenger vehicles lead in revenue share due to faster technology rollout and consumer demand for safety innovations. Commercial vehicles are gradually increasing adoption, particularly in autonomous logistics, public transport, and fleet operations.
- For instance, Daimler Truck AG equipped its Freightliner Cascadia long-haul trucks for commercial delivery with Ouster’s LIDAR sensors, enabling 360° perception and reliable object detection for SAE Level 4 autonomous driving in real-world logistics operations across 200+ long-haul vehicles as of early 2024.
By Application
ADAS remains the largest application segment, supported by regulatory mandates and rising consumer preference for active safety systems. Automatic Emergency Braking (AEB) and Adaptive Cruise Control (ACC) rely on LiDAR for enhanced detection and responsiveness. The autonomous cars segment is expanding rapidly as companies invest in Level 3+ automation, with LiDAR playing a critical role in navigation and obstacle detection.
- For instance, Honda’s Legend Hybrid EX sedan, released in 2023 for the Japanese market, launched with Level 3 Traffic Jam Pilot using Valeo SCALA LIDAR, providing 270° short- and long-range coverage and allowing automated driving in highway congestion up to 50 km/h.
By Propulsion Type
Electric and hybrid vehicles account for the dominant share in LiDAR sensor integration. Their advanced architecture and digital platforms make them more suitable for embedding next-generation sensing systems. Internal Combustion Engine (ICE) vehicles maintain a presence, but adoption is slower due to legacy system limitations and tightening emission regulations.
By Technology
Mechanical LiDAR holds an early lead in deployments, particularly in prototype and research vehicles. However, solid-state LiDAR is gaining rapid traction due to its cost efficiency, compact design, and improved durability. It is becoming the technology of choice for large-scale production in both passenger and commercial vehicles.
Segmentation:
By Vehicle Type
- Passenger Cars
- Commercial Vehicles
By Application
- ADAS
- Automatic Emergency Braking (AEB)
- Adaptive Cruise Control (ACC)
- Autonomous Cars
By Propulsion Type
- Internal Combustion Engine (ICE) Vehicles
- Electric & Hybrid Vehicles
By Technology
- Mechanical LiDAR
- Solid-state LiDAR
By Region
- North America
- Europe
- Asia Pacific
- Latin America
- Middle East
- Africa
Regional Analysis:
North America
The North America Automotive LIDAR Sensors Market size was valued at USD 206.64 million in 2018 to USD 547.19 million in 2024 and is anticipated to reach USD 4,913.12 million by 2032, at a CAGR of 31.7% during the forecast period. The region leads in terms of early adoption of advanced mobility technologies and continues to dominate due to its robust infrastructure for autonomous vehicle testing and deployment. Strong support from government bodies and regulatory agencies, particularly in the U.S., encourages innovation and provides incentives for smart transportation solutions. Key players are actively involved in strategic partnerships and R&D investments, further enhancing market maturity. North America’s dominance is also driven by leading OEMs and tech companies headquartered in the region.
Europe
The Europe Automotive LIDAR Sensors Market size was valued at USD 154.08 million in 2018 to USD 394.57 million in 2024 and is anticipated to reach USD 3,313.12 million by 2032, at a CAGR of 30.6%. Europe is home to some of the world’s most established automotive manufacturers who are prioritizing LIDAR integration in their new vehicle models. The EU’s stringent vehicle safety standards and emissions regulations are compelling automakers to invest in sensor technologies. Countries like Germany, France, and the U.K. are leading in autonomous vehicle pilot programs and public-private innovation initiatives. Europe’s collaborative industrial ecosystem between carmakers and sensor developers plays a critical role in shaping the market landscape.
Asia Pacific
The Asia Pacific Automotive LIDAR Sensors Market size was valued at USD 278.64 million in 2018 to USD 770.35 million in 2024 and is anticipated to reach USD 7,366.78 million by 2032, at a CAGR of 32.7%. Asia Pacific is the fastest-growing regional market due to a massive automotive production base, smart city development, and rising investments in autonomous mobility. China, Japan, and South Korea are pioneering LIDAR deployment through large-scale AV initiatives and national AI strategies. Key automotive suppliers are based in this region, giving it a significant supply chain advantage. Increasing demand for EVs and connected vehicles further accelerates sensor integration.
Latin America
The Latin America Automotive LIDAR Sensors Market size was valued at USD 42.62 million in 2018 to USD 113.45 million in 2024 and is anticipated to reach USD 944.07 million by 2032, at a CAGR of 30.5%. Although at an early stage, the region is beginning to embrace LIDAR for commercial and industrial vehicle applications. Brazil and Mexico are the main contributors to market demand due to their growing automotive assembly sectors and increasing interest in connected transportation solutions. Government partnerships with international firms and infrastructure upgrades are expected to stimulate further adoption in the coming years.
Middle East
The Middle East Automotive LIDAR Sensors Market size was valued at USD 28.66 million in 2018 to USD 72.41 million in 2024 and is anticipated to reach USD 592.00 million by 2032, at a CAGR of 30.2%. The region is leveraging LIDAR technology in futuristic city developments and pilot projects for autonomous public transportation. Countries like the UAE and Saudi Arabia are investing heavily in smart mobility infrastructure as part of their national vision programs. The focus remains on high-end vehicles and luxury fleets, where LIDAR serves as a premium safety feature. Market momentum will increase as regional players partner with global technology providers.
Africa
The Africa Automotive LIDAR Sensors Market size was valued at USD 9.36 million in 2018 to USD 38.35 million in 2024 and is anticipated to reach USD 331.10 million by 2032, at a CAGR of 30.7%. Africa remains the smallest regional market, primarily due to limited infrastructure and low consumer adoption of autonomous technologies. However, urban development in South Africa and Kenya is creating interest in intelligent transportation systems. Import of luxury and high-end vehicles equipped with LIDAR sensors continues to grow. Support from international development agencies and investments in ICT infrastructure may gradually increase the region’s participation in the global market.
Shape Your Report to Specific Countries or Regions & Enjoy 30% Off!
Key Player Analysis:
- Continental AG
- Denso Corporation
- Innoviz Technologies
- LeddarTech Inc.
- KUBOTA Corporation
- Quanergy Solutions, Inc.
- Robert Bosch GmbH
- Teledyne Geospatial
- Valeo
- Velodyne LiDAR, Inc.
Competitive Analysis:
The Global Automotive LIDAR Sensors Market is highly competitive, with established players and emerging startups focusing on innovation, partnerships, and cost optimization. Key companies such as Velodyne LiDAR, Continental AG, Robert Bosch GmbH, Innoviz Technologies, Valeo, and Denso Corporation are leading in sensor development, integration, and commercial scaling. It is witnessing a shift toward solid-state and chip-based LiDAR systems, enabling lower production costs and seamless vehicle integration. Companies are investing in long-range, high-resolution LiDAR to meet Level 3+ autonomy requirements. Strategic collaborations between OEMs and technology firms are accelerating time-to-market and expanding product portfolios. Chinese firms like Hesai and RoboSense are expanding globally with cost-competitive offerings. The Global Automotive LIDAR Sensors Market continues to evolve with aggressive patent activity, growing R&D budgets, and increased M&A efforts, positioning players to gain a competitive edge in a fast-developing autonomous mobility ecosystem.
Recent Developments:
- On July 8, 2025, Innoviz Technologies marked a significant production milestone by shipping the first InnovizTwo LIDAR units from Fabrinet’s high-volume manufacturing line. This follows the June 2025 agreement to supply hundreds of InnovizTwo sensors as part of a development program with a top-five global passenger vehicle OEM. These sensors will power Level 3 highly automated production vehicles, with series production targeted for 2027. The ramp-up signals readiness for large-scale, OEM-integrated LIDAR deployment in advanced vehicle platforms.
- In June 2025, Kubota North America announced a strategic partnership with Agtonomy to commercialize autonomous operations on Kubota diesel tractors. The collaboration integrates Agtonomy’s autonomy software with Kubota’s equipment for specialty crop growers, enhancing efficiency in tasks like spraying and mowing. This reflects Kubota’s expanded commitment to AI-based perception, precision autonomy, and labor-saving machine technology within both agricultural and industrial equipment sectors.
- In May 2025, LeddarTech launched LeddarSim™, a next-generation simulation platform for automotive OEMs and Tier 1 suppliers. LeddarSim is designed to reduce the gap between virtual testing and real-world deployment by using AI-driven, multi-modality simulation of complex driving environments. Developers now benefit from real-time renderings of camera, radar, and LIDAR data, enabling validation and optimization of multi-sensor perception systems and reportedly achieving a tenfold reduction in data annotation costs for ADAS and autonomous driving applications.
- In April 2025, Quanergy Solutions announced the expansion of its partner ecosystem at ISC West, integrating its advanced 3D LIDAR with Hanwha’s Wisenet WAVE 6.0 VMS and Motorola’s Avigilon Unity video security platform. This partnership enhances real-time 3D perception and monitoring for automotive, IoT, and smart infrastructure use cases, underlining Quanergy’s continued focus on robust LIDAR technology for diverse industries.
Market Concentration & Characteristics:
The Global Automotive LIDAR Sensors Market exhibits moderate to high market concentration, with a mix of established technology leaders and fast-scaling startups shaping its structure. It features strong R&D intensity, rapid innovation cycles, and high entry barriers due to technical complexity and capital requirements. Leading players such as Velodyne, Bosch, and Innoviz dominate in terms of volume supply and OEM partnerships. The market is characterized by a transition from mechanical to solid-state LiDAR, driven by demand for compact, cost-efficient, and production-ready solutions. It supports a fast-paced competitive environment where strategic alliances, intellectual property, and product differentiation define market positioning. Growing standardization needs, regulatory alignment, and vertical integration are further influencing market dynamics.
Report Coverage:
The research report offers an in-depth analysis based on vehicle type, application, propulsion type, and technology. It details leading market players, providing an overview of their business, product offerings, investments, revenue streams, and key applications. Additionally, the report includes insights into the competitive environment, SWOT analysis, current market trends, as well as the primary drivers and constraints. Furthermore, it discusses various factors that have driven market expansion in recent years. The report also explores market dynamics, regulatory scenarios, and technological advancements that are shaping the industry. It assesses the impact of external factors and global economic changes on market growth. Lastly, it provides strategic recommendations for new entrants and established companies to navigate the complexities of the market.
Future Outlook:
- Demand for LiDAR sensors will accelerate with the global rollout of Level 3 and Level 4 autonomous vehicles.
- Solid-state LiDAR will replace mechanical systems in mass production due to its cost and integration advantages.
- OEM collaborations with LiDAR startups will increase to accelerate feature integration and shorten development cycles.
- Regulatory mandates for ADAS and collision avoidance will drive mandatory sensor adoption across vehicle segments.
- Growth in electric and connected vehicles will create a favorable ecosystem for advanced LiDAR integration.
- Asia-Pacific will emerge as the fastest-growing regional market, led by China’s rapid EV and autonomy push.
- Long-range LiDAR systems will gain prominence to support highway automation and high-speed navigation.
- Cloud-based data processing and AI-driven perception models will enhance LiDAR accuracy and responsiveness.
- Falling production costs through photonics and chip-scale integration will expand access to lower vehicle tiers.
- Fleet operators and logistics firms will adopt LiDAR-enabled platforms for commercial automation and safety.


