Home » Information and Communications Technology » Technology & Media » Underwater Data Centers Market

Underwater Data Center Market By Component (Hardware, Software, Services); By Deployment (Shallow Water, Deep Water); By Tier (Tier I, Tier II, Tier III, Tier IV); By End User (Government, BFSI, IT and Telecommunications, Energy, Defense, Others) – Growth, Share, Opportunities & Competitive Analysis, 2024 – 2032

Report ID: 10996 | Report Format : Excel, PDF

Market Overview

Underwater Data Center Market size was valued at USD 826.7 Million in 2018, reaching USD 2,510.2 Million in 2024, and is anticipated to grow to USD 10,543.4 Million by 2032, at a CAGR of 19.79% during the forecast period.

REPORT ATTRIBUTE DETAILS
Historical Period 2020-2023
Base Year 2024
Forecast Period 2025-2032
Underwater Data Center Market Size 2024 USD 2,510.2 Million
Underwater Data Center Market, CAGR 19.79%
Underwater Data Center Market Size 2032 USD 10,543.4 Million


The Underwater Data Center Market is highly competitive, with leading players such as Microsoft Corporation, Google LLC, Nautilus Data Technologies, and Subsea Cloud driving innovation and adoption globally. These companies focus on deploying energy-efficient submerged facilities, advanced cooling systems, and scalable modular designs to meet growing demands for cloud computing and edge infrastructure. North America emerges as the dominant region, holding 28% of the global market share in 2024, supported by significant investments, advanced IT infrastructure, and rapid adoption of low-latency, high-performance data solutions.

Europe follows with 22% market share, leveraging sustainability initiatives and energy-efficient cloud deployments. Asia Pacific is a high-growth region with 18% share, fueled by digitalization, expanding IT sectors, and increasing investments in shallow and deep-water underwater facilities. Together, these regions and key players shape the strategic direction and technological advancement of the underwater data center industry.

Underwater Data Center Market size

Market Insights

  • The Underwater Data Center Market was valued at USD 2,510.2 Million in 2024 and is projected to reach USD 10,543.4 Million by 2032, growing at a CAGR of 19.79%.
  • Growth is driven by rising demand for cloud computing and edge infrastructure, increasing adoption of energy-efficient cooling systems, and substantial investments from technology leaders such as Microsoft and Google.
  • Market trends include integration of AI and IoT for predictive maintenance, expansion of deep-water deployments, and adoption of modular, scalable designs to enhance operational efficiency and sustainability.
  • The competitive landscape features Microsoft Corporation, Google LLC, Nautilus Data Technologies, and Subsea Cloud, with companies focusing on innovation, strategic partnerships, and energy-efficient submerged facilities to capture market share.
  • North America leads with 28% market share, followed by Europe at 22% and Asia Pacific at 18%; shallow-water deployment dominates with 60% share, hardware leads the component segment at 55%, and Tier III data centers hold 45% share.

Access crucial information at unmatched prices!

Request your sample report today & start making informed decisions powered by Credence Research Inc.!

Download Sample

Market Segmentation Analysis:

By Component:

The hardware segment dominates the underwater data centers market, accounting for 55% of the component share. Growth is driven by increased adoption of energy-efficient servers, cooling systems, and advanced networking equipment tailored for underwater deployment. Hardware demand is propelled by enterprises seeking reliable infrastructure to reduce latency and improve computing efficiency in remote regions. While software and services contribute significantly, hardware remains the primary investment area as organizations prioritize robust physical infrastructure capable of withstanding high-pressure underwater environments.

  • For instance, Microsoft’s Project Natick demonstrated underwater servers to be eight times more reliable than onshore data centers through a nitrogen-filled capsule cooled by seawater heat exchangers.

By Deployment:

The shallow water segment leads the deployment category, capturing 60% of the market share. This preference is driven by easier installation, lower operational costs, and simplified maintenance compared with deep-water solutions. Shallow water facilities allow rapid access for upgrades, monitoring, and repairs, making them ideal for early-stage underwater data center adoption. Despite the growing interest in deep-water deployments for scalability and environmental stability, shallow water remains dominant due to its cost-efficiency and faster deployment capabilities.

By Tier:

Tier III data centers hold the largest share in the market, representing about 45% of the tier segment. Their resilience, high availability, and fault-tolerant infrastructure meet the growing demand from critical industries like BFSI, government, and IT. Tier III facilities balance cost and reliability, offering redundancy and uptime guarantees without the higher capital expenditure associated with Tier IV centers. This drives preference among enterprises seeking secure and reliable underwater data solutions while managing operational costs effectively.

  • For instance, Apple’s Mesa Data Center in Arizona is a Tier III facility covering 1.3 million square feet, powered entirely by renewable energy, supporting services like iCloud and Siri with a focus on sustainability and reliability. 

Key Growth Drivers

Rising Demand for Cloud Computing and Edge Data Solutions

The rapid expansion of cloud computing and edge data solutions is driving underwater data center adoption. Enterprises and tech giants are seeking low-latency, high-performance infrastructure to support AI, IoT, and data-intensive applications. Underwater data centers provide scalable solutions closer to coastal populations, reducing network delays while optimizing energy efficiency. The integration of advanced cooling systems in submerged facilities further enhances operational efficiency, making underwater deployment a preferred choice for companies aiming to expand cloud and edge capabilities with reliable, sustainable infrastructure.

  • For instance, China’s large-scale underwater AI computing cluster off Hainan Island, designed to minimize environmental impact while providing substantial cloud and edge service capacity closer to coastal populations.

Energy Efficiency and Sustainability Initiatives

Energy efficiency and environmental sustainability are key drivers in the underwater data center market. Submerged facilities utilize natural seawater for cooling, significantly reducing energy consumption compared with traditional onshore centers. Organizations are increasingly focused on lowering carbon footprints and achieving ESG goals, making underwater solutions attractive. The ability to maintain high uptime while leveraging renewable cooling reduces operational costs and enhances environmental compliance, encouraging governments, IT, and telecommunications firms to invest in submerged data centers as part of their long-term sustainable infrastructure strategies.

  • For instance, Subsea Cloud’s pressure-equalized pods, deployed in the US, achieve up to 40% energy and CO2 savings by eliminating traditional HVAC systems and using dielectric immersion cooling with natural convection, enabling secure, low-latency, and energy-efficient underwater data center operations.

Rising Investment from Technology Leaders

Major technology companies are actively investing in underwater data centers to meet growing digital demands. Companies like Microsoft and Google are deploying pilot underwater facilities, demonstrating feasibility and scalability. Such investments stimulate market growth by increasing visibility, validating technological reliability, and attracting further adoption across industries. Capital inflows support R&D in hardware, software, and deployment strategies, driving innovation in submersible designs, energy management, and monitoring systems. These initiatives encourage broader market adoption by showcasing operational benefits and long-term ROI for enterprises considering underwater infrastructure.

Underwater Data Center Market share

Key Trends & Opportunities

Integration of AI and IoT in Submerged Infrastructure

The integration of AI and IoT within underwater data centers is creating new operational efficiencies. Smart sensors and automated monitoring systems optimize power consumption, detect maintenance needs, and manage workloads dynamically. This trend enables predictive maintenance, reduces downtime, and ensures data center resilience. As enterprises increasingly rely on AI-driven analytics and IoT-enabled devices, underwater facilities offer a strategic opportunity to enhance performance while supporting the next generation of data-intensive applications, positioning these centers as a critical component of modern digital ecosystems.

  • For instance, China’s Highlander launched the world’s first commercial underwater AI-powered data center off Hainan, featuring over 400 high-performance servers capable of handling 7,000 AI queries per second, while cutting cooling costs by 90% using ocean currents and operating on 95% renewable energy from a nearby offshore wind farm.

Expansion of Deep-Water Deployments

While shallow-water facilities dominate today, deep-water deployments are emerging as a significant opportunity. Deep-water centers offer enhanced security, minimal environmental disruption, and long-term scalability, attracting industries requiring high reliability, including defense and energy sectors. Advances in underwater construction and pressure-resistant designs reduce operational risks, allowing for larger facilities with extended service life. This trend presents a growth opportunity for market players to differentiate through innovative deep-water solutions while meeting increasing global demand for resilient, high-capacity data infrastructure.

  • For instance, China’s Hainan Underwater Intelligent Computing Center operates a fully operational underwater AI data center cluster off the coast of Hainan island.

Key Challenges

High Capital Expenditure and Operational Complexity

The underwater data center market faces challenges from substantial initial investments and complex operational requirements. Submerged facilities demand specialized hardware, pressure-resistant enclosures, and marine engineering expertise, increasing deployment costs. Additionally, maintaining and upgrading submerged infrastructure is more complicated than traditional onshore centers, requiring skilled personnel and remote monitoring systems. These financial and logistical barriers slow adoption, particularly for smaller enterprises, making cost management and efficient operational planning essential to ensure viable returns on investment in this emerging segment.

Regulatory and Environmental Constraints

Strict regulatory frameworks and environmental considerations pose challenges for underwater data centers. Compliance with marine safety standards, oceanic environmental laws, and regional permitting requirements can delay projects and increase operational costs. Potential ecological impacts, including disruption to marine life, require careful assessment and mitigation strategies. Navigating these regulations demands collaboration with authorities and significant planning, limiting rapid deployment. Companies must balance operational efficiency with environmental responsibility to maintain public trust and adhere to international guidelines while pursuing underwater data center expansion.

Regional Analysis

North America

North America holds a dominant position in the underwater data center market, representing 28% of the global share in 2024. The region’s market size grew from USD 300.43 million in 2018 to USD 897.80 million in 2024, and it is projected to reach USD 3,690.17 million by 2032, reflecting a CAGR of 19.5%. Growth is fueled by significant investments from technology leaders like Microsoft and Google, coupled with increasing demand for low-latency, energy-efficient cloud solutions. Strong government support, robust IT infrastructure, and rapid adoption of edge computing further reinforce North America’s leadership in underwater data center deployment.

Europe

Europe accounted for 22% of the global underwater data center market share in 2024. The market expanded from USD 236.11 million in 2018 to USD 707.35 million in 2024, with projections of USD 2,917.35 million by 2032, growing at a CAGR of 19.1%. Growth is driven by the EU’s sustainability initiatives and the adoption of energy-efficient cloud infrastructure. Countries such as the UK, Germany, and France are investing heavily in shallow and deep-water data centers, aiming to optimize operational costs while supporting growing demands from BFSI, IT, and government sectors.

Asia Pacific

Asia Pacific is emerging as a high-growth market, capturing 18% of the global share in 2024. The market increased from USD 180.06 million in 2018 to USD 568.24 million in 2024 and is expected to reach USD 2,507.21 million by 2032, with a CAGR of 20.5%. Rapid digitalization, expanding IT and telecommunications sectors, and growing cloud adoption in countries like China, India, and Japan are driving this growth. Increasing investments in shallow and deep-water facilities for energy-efficient operations provide a significant opportunity to meet rising data demands across the region.

Latin America

Latin America contributes 6% of the global market share in 2024. The market grew from USD 60.52 million in 2018 to USD 182.57 million in 2024, with forecasts reaching USD 760.18 million by 2032, achieving a CAGR of 19.7%. Growth is driven by expanding cloud infrastructure in Brazil and Argentina, along with increasing investments in energy-efficient and resilient data centers. Companies are exploring shallow-water deployments to reduce latency for regional IT, BFSI, and government sectors while optimizing operational costs in Latin America’s emerging technology landscape.

Middle East

The Middle East is emerging as a significant market, holding 4% of global share in 2024. Market size increased from USD 37.20 million in 2018 to USD 119.42 million in 2024, projected to reach USD 537.71 million by 2032, with a CAGR of 20.8%. Growth is driven by rapid digital transformation, government-backed smart city initiatives, and investment in energy-efficient infrastructure. Countries like the UAE, Saudi Arabia, and Israel are leveraging submerged data centers to support IT, defense, and energy sectors, while deep-water deployments provide secure, scalable solutions with minimal environmental impact.

Africa

Africa represents a smaller but growing share, around 1.5% of the global market in 2024. The market expanded from USD 12.40 million in 2018 to USD 34.86 million in 2024 and is expected to reach USD 130.74 million by 2032, at a CAGR of 18.1%. Growth is driven by the adoption of cloud infrastructure in South Africa, Egypt, and other emerging economies. Increasing IT investments, demand for energy-efficient data solutions, and interest in shallow-water deployments to reduce latency and operational costs are contributing to the gradual expansion of underwater data centers across the African region.

Underwater Data Center Market segmentatuion

Market Segmentations:

By Component:

  • Hardware
  • Software
  • Services

By Deployment:

  • Shallow Water
  • Deep Water

By Tier:

  • Tier I
  • Tier II
  • Tier III
  • Tier IV

By End User:

  • Government
  • BFSI
  • IT and Telecommunications
  • Energy
  • Defense
  • Others

By Region:

  • North America
    • U.S.
    • Canada
    • Mexico
  • Europe
    • Germany
    • France
    • U.K.
    • Italy
    • Spain
    • Rest of Europe
  • Asia Pacific
    • China
    • Japan
    • India
    • South Korea
    • South-east Asia
    • Rest of Asia Pacific
  • Latin America
    • Brazil
    • Argentina
    • Rest of Latin America
  • Middle East & Africa
    • GCC Countries
    • South Africa
    • Rest of the Middle East and Africa

Competitive Landscape

The competitive landscape of the underwater data center market features key players such as Microsoft Corporation, Google LLC, Nautilus Data Technologies, and Subsea Cloud. Market competition is intensifying as companies focus on innovation, strategic partnerships, and technological advancements to establish leadership in this emerging segment. Players are investing in energy-efficient submerged facilities, advanced cooling systems, and scalable modular designs to differentiate offerings and capture market share. Collaborations with marine engineering firms and cloud service providers are enhancing deployment capabilities and reducing operational risks. Additionally, companies are prioritizing sustainability initiatives, integrating renewable energy solutions and eco-friendly materials to align with regulatory standards and customer expectations. The competitive environment is expected to drive continuous innovation, lower operational costs, and expand regional presence, positioning these firms to capitalize on the rising global demand for reliable, low-latency underwater data center infrastructure.

Shape Your Report to Specific Countries or Regions & Enjoy 30% Off!

Key Player Analysis

Recent Developments

  • In June 2025, HiCloud Technology, a subsidiary of Highlander, launched the world’s first wind-powered commercial underwater data center in Shanghai’s Lin-gang Special Area.
  • In October 2025, Germany’s Helsing announced plans to acquire Australian underwater drone maker Blue Ocean in a strategic move to enhance its capabilities in AI-driven autonomous marine systems.
  • In July 2025, Japan’s Mitsui O.S.K. Lines (MOL) partnered with Kinetics, a subsidiary of Turkish floating power firm Karpowership, to develop a floating data center with a capacity of 20 to 73 megawatts.

Report Coverage

The research report offers an in-depth analysis based on Component, Deployment, Tier, End User and Region. It details leading market players, providing an overview of their business, product offerings, investments, revenue streams, and key applications. Additionally, the report includes insights into the competitive environment, SWOT analysis, current market trends, as well as the primary drivers and constraints. Furthermore, it discusses various factors that have driven market expansion in recent years. The report also explores market dynamics, regulatory scenarios, and technological advancements that are shaping the industry. It assesses the impact of external factors and global economic changes on market growth. Lastly, it provides strategic recommendations for new entrants and established companies to navigate the complexities of the market.

Future Outlook

  1. The underwater data center market is expected to witness robust growth due to rising cloud computing and edge infrastructure demand.
  2. Increasing investments from technology leaders will drive innovation in submerged data center designs.
  3. Energy-efficient cooling systems using seawater will remain a key growth enabler.
  4. Shallow-water deployments will continue dominating early adoption, while deep-water centers will expand for large-scale operations.
  5. Tier III facilities will remain preferred for their balance of cost and reliability, supporting critical industries.
  6. Asia Pacific and the Middle East are projected to grow faster due to digitalization and infrastructure development.
  7. Integration of AI and IoT will enhance operational efficiency and predictive maintenance in underwater facilities.
  8. Sustainability initiatives will encourage adoption as companies seek low-carbon, environmentally friendly solutions.
  9. Collaboration with marine engineering and cloud service providers will reduce operational risks and improve scalability.
  10. The market will increasingly focus on modular, scalable, and resilient designs to meet evolving enterprise data demands.

CHAPTER NO. 1 :   GENESIS OF THE MARKET       

1.1 Market Prelude – Introduction & Scope

1.2 The Big Picture – Objectives & Vision

1.3 Strategic Edge – Unique Value Proposition

1.4 Stakeholder Compass – Key Beneficiaries       

CHAPTER NO. 2 :   EXECUTIVE LENS

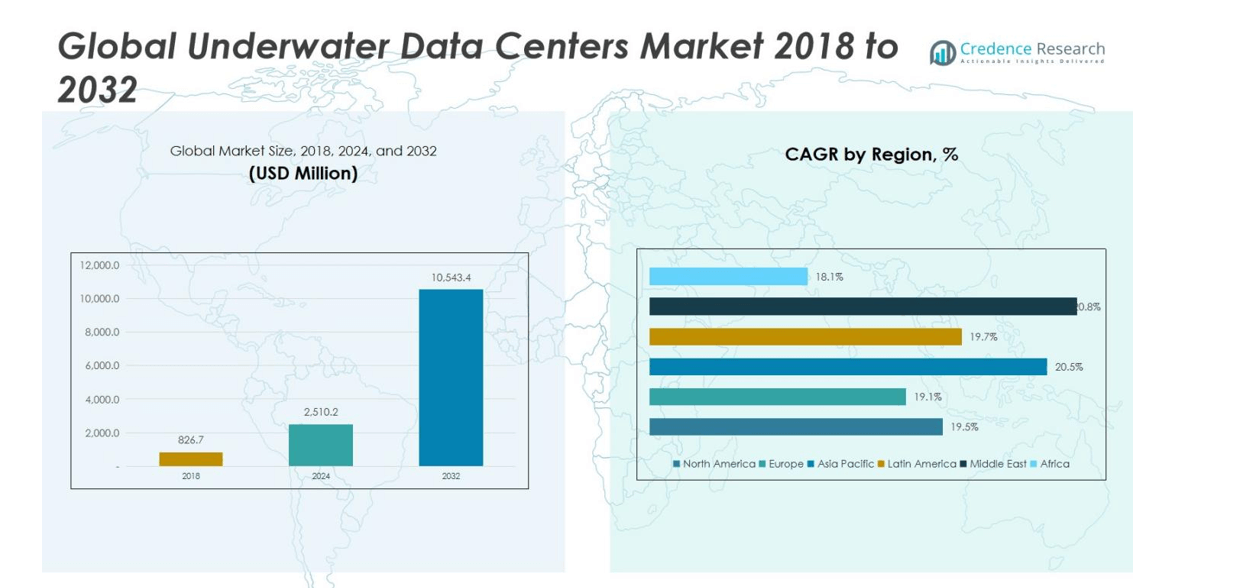
2.1 Pulse of the Industry – Market Snapshot

2.2 Growth Arc – Revenue Projections (USD Million)      

2.3. Premium Insights – Based on Primary Interviews       

CHAPTER NO. 3 :   UNDERWATER DATA CENTERS MARKET FORCES & INDUSTRY PULSE

3.1 Foundations of Change – Market Overview
3.2 Catalysts of Expansion – Key Market Drivers
3.2.1 Momentum Boosters – Growth Triggers
3.2.2 Innovation Fuel – Disruptive Technologies
3.3 Headwinds & Crosswinds – Market Restraints
3.3.1 Regulatory Tides – Compliance Challenges
3.3.2 Economic Frictions – Inflationary Pressures
3.4 Untapped Horizons – Growth Potential & Opportunities
3.5 Strategic Navigation – Industry Frameworks
3.5.1 Market Equilibrium – Porter’s Five Forces
3.5.2 Ecosystem Dynamics – Value Chain Analysis
3.5.3 Macro Forces – PESTEL Breakdown

CHAPTER NO. 4 :   KEY INVESTMENT EPICENTER          

4.1 Regional Goldmines – High-Growth Geographies

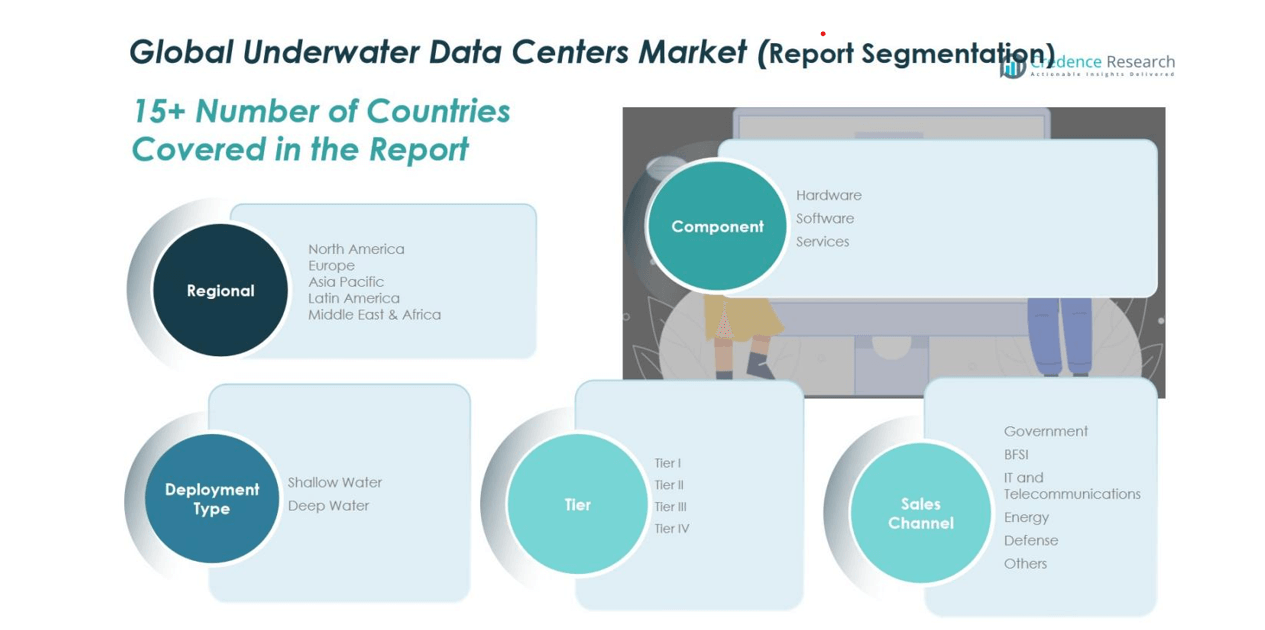
4.2 Product Frontiers – Lucrative Component Categories

4.3 Deployment Sweet Spots – Emerging Demand Segments          

CHAPTER NO. 5: REVENUE TRAJECTORY & WEALTH MAPPING

5.1 Momentum Metrics – Forecast & Growth Curves

5.2 Regional Revenue Footprint – Market Share Insights

5.3 Segmental Wealth Flow – Component, Deployment, Tier, & End User Revenue

CHAPTER NO. 6 :   TRADE & COMMERCE ANALYSIS      

6.1.      Import Analysis By Region   

6.1.1.   Global Underwater Data Centers Market Import Revenue By Region

6.2.      Export Analysis By Region   

6.2.1.   Global Underwater Data Centers Market Export Revenue By Region

CHAPTER NO. 7 :   COMPETITION ANALYSIS         

7.1.      Company Market Share Analysis      

7.1.1.   Global Underwater Data Centers Market: Company Market Share

7.2.      Global Underwater Data Centers Market Company Revenue Market Share

7.3.      Strategic Developments        

7.3.1.   Acquisitions & Mergers        

7.3.2.   New Product Launch

7.3.3.   Regional Expansion

7.4.      Competitive Dashboard

7.5.      Company Assessment Metrics, 2024

CHAPTER NO. 8 :   UNDERWATER DATA CENTERS MARKET – BY COMPONENT SEGMENT ANALYSIS

8.1.      Underwater Data Centers Market Overview By Component Segment         

8.1.1.   Underwater Data Centers Market Revenue Share By Component

8.2.      Hardware

8.3.      Software

8.4.      Services

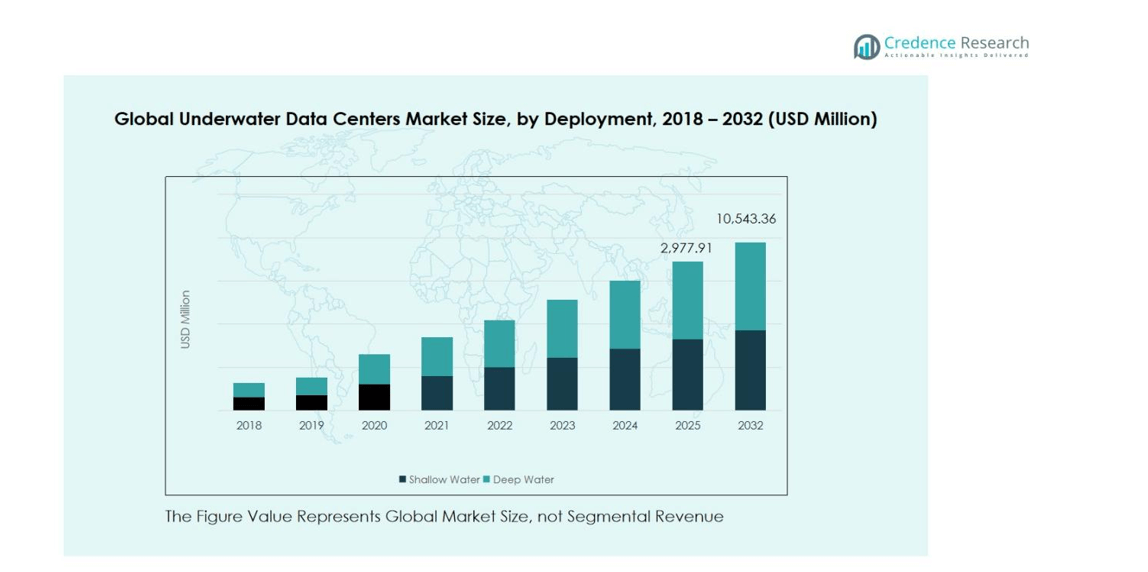
CHAPTER NO. 9 :   UNDERWATER DATA CENTERS MARKET – BY DEPLOYMENT SEGMENT ANALYSIS

9.1.      Underwater Data Centers Market Overview By Deployment Segment

9.1.1.   Underwater Data Centers Market Revenue Share By Deployment

9.2.      Shallow Water

9.3.      Deep Water

 CHAPTER NO. 10 : UNDERWATER DATA CENTERS MARKET – BY TIER SEGMENT ANALYSIS

10.1.    Underwater Data Centers Market Overview By Tier Segment           

10.1.1. Underwater Data Centers Market Revenue Share By Tier

10.2.    Tier I

10.3.    Tier II

10.4.    Tier III

10.5.    Tier IV

CHAPTER NO. 11 : UNDERWATER DATA CENTERS MARKET – BY END USER SEGMENT ANALYSIS

11.1.    Underwater Data Centers Market Overview By End User Segment         

11.1.1. Underwater Data Centers Market Revenue Share By End User

11.2.    Government

11.3.    BFSI

11.4.   IT and Telecommunications

11.5.   Energy

11.6.   Defense

11.7.   Others

CHAPTER NO. 12 : UNDERWATER DATA CENTERS MARKET – REGIONAL ANALYSIS

12.1.    Underwater Data Centers Market Overview By Region Segment         

12.1.1. Global Underwater Data Centers Market Revenue Share By Region

12.1.2. Regions          

12.1.3. Global Underwater Data Centers Market Revenue By Region            

12.1.4. Component    

12.1.5. Global Underwater Data Centers Market Revenue By Component    

12.1.6. Deployment   

12.1.7. Global Underwater Data Centers Market Revenue By Deployment

12.1.8. Tier    

12.1.9. Global Underwater Data Centers Market Revenue By Tier

12.1.10.           End User        

12.1.11.           Global Underwater Data Centers Market Revenue By End User

CHAPTER NO. 13 : NORTH AMERICA UNDERWATER DATA CENTERS MARKET – COUNTRY ANALYSIS

13.1.    North America Underwater Data Centers Market Overview By Country Segment

13.1.1. North America Underwater Data Centers Market Revenue Share By Region

13.2.    North America           

13.2.1. North America Underwater Data Centers Market Revenue By Country

13.2.2. Component    

13.2.3. North America Underwater Data Centers Market Revenue By Component

13.2.4. Deployment   

13.2.5. North America Underwater Data Centers Market Revenue By Deployment

13.2.6. Tier    

13.2.7. North America Underwater Data Centers Market Revenue By Tier

13.2.8. End User        

13.2.9. North America Underwater Data Centers Market Revenue By End User

13.3.    U.S.    

13.4.    Canada           

13.5.    Mexico           

CHAPTER NO. 14 : EUROPE UNDERWATER DATA CENTERS MARKET – COUNTRY ANALYSIS

14.1.    Europe Underwater Data Centers Market Overview By Country Segment

14.1.1. Europe Underwater Data Centers Market Revenue Share By Region

14.2.    Europe

14.2.1. Europe Underwater Data Centers Market Revenue By Country            

14.2.2. Component

14.2.3. Europe Underwater Data Centers Market Revenue By Component    

14.2.4. Deployment   

14.2.5. Europe Underwater Data Centers Market Revenue By Deployment

14.2.6. Tier    

14.2.7. Europe Underwater Data Centers Market Revenue By Tier

14.2.8. End User        

14.2.9. Europe Underwater Data Centers Market Revenue By End User

14.3.    UK     

14.4.    France

14.5.    Germany        

14.6.    Italy    

14.7.    Spain  

14.8.    Russia

14.9.   Rest of Europe

CHAPTER NO. 15 : ASIA PACIFIC UNDERWATER DATA CENTERS MARKET – COUNTRY ANALYSIS

15.1.    Asia Pacific Underwater Data Centers Market Overview By Country Segment

15.1.1. Asia Pacific Underwater Data Centers Market Revenue Share By Region

15.2.    Asia Pacific   

15.2.1. Asia Pacific Underwater Data Centers Market Revenue By Country

15.2.2. Component    

15.2.3. Asia Pacific Underwater Data Centers Market Revenue By Component    

15.2.4. Deployment   

15.2.5. Asia Pacific Underwater Data Centers Market Revenue By Deployment

15.2.6. Tier    

15.2.7. Asia Pacific Underwater Data Centers Market Revenue By Tier

15.2.8. End User        

15.2.9. Asia Pacific Underwater Data Centers Market Revenue By End User

15.3.    China 

15.4.    Japan  

15.5.    South Korea   

15.6.    India   

15.7.    Australia        

15.8.    Southeast Asia

15.9.    Rest of Asia Pacific

CHAPTER NO. 16 : LATIN AMERICA UNDERWATER DATA CENTERS MARKET – COUNTRY ANALYSIS

16.1.    Latin America Underwater Data Centers Market Overview By Country Segment

16.1.1. Latin America Underwater Data Centers Market Revenue Share By Region

16.2.    Latin America

16.2.1. Latin America Underwater Data Centers Market Revenue By Country

16.2.2. Component    

16.2.3. Latin America Underwater Data Centers Market Revenue By Component

16.2.4. Deployment   

16.2.5. Latin America Underwater Data Centers Market Revenue By Deployment

16.2.6. Tier    

16.2.7. Latin America Underwater Data Centers Market Revenue By Tier

16.2.8. End User        

16.2.9. Latin America Underwater Data Centers Market Revenue By End User

16.3.    Brazil 

16.4.    Argentina       

16.5.    Rest of Latin America

CHAPTER NO. 17 : MIDDLE EAST UNDERWATER DATA CENTERS MARKET – COUNTRY ANALYSIS

17.1.    Middle East Underwater Data Centers Market Overview By Country Segment

17.1.1. Middle East Underwater Data Centers Market Revenue Share By Region

17.2.    Middle East    

17.2.1. Middle East Underwater Data Centers Market Revenue By Country

17.2.2. Component    

17.2.3. Middle East Underwater Data Centers Market Revenue By Component

17.2.4. Deployment   

17.2.5. Middle East Underwater Data Centers Market Revenue By Deployment   

17.2.6. Tier

17.2.7. Middle East Underwater Data Centers Market Revenue By Tier

17.2.8. End User

17.2.9. Middle East Underwater Data Centers Market Revenue By End User        

17.3.    GCC Countries          

17.4.    Israel

17.5.    Turkey

17.6.    Rest of Middle East   

CHAPTER NO. 18 : AFRICA UNDERWATER DATA CENTERS MARKET – COUNTRY ANALYSIS

18.1.    Africa Underwater Data Centers Market Overview By Country Segment

18.1.1. Africa Underwater Data Centers Market Revenue Share By Region

18.2.    Africa

18.2.1. Africa Underwater Data Centers Market Revenue By Country            

18.2.2. Component    

18.2.3. Africa Underwater Data Centers Market Revenue By Component    

18.2.4. Deployment   

18.2.5. Africa Underwater Data Centers Market Revenue By Deployment

18.2.6. Tier    

18.2.7. Africa Underwater Data Centers Market Revenue By Tier

18.2.8. End User        

18.2.9. Africa Underwater Data Centers Market Revenue By End User

18.3.    South Africa

18.4.    Egypt 

18.5.    Rest of Africa

CHAPTER NO. 19 : COMPANY PROFILES     

19.1.    Microsoft Corporation

 19.1.1.            Company Overview   

 19.1.2.            Product Portfolio       

 19.1.3.            Financial Overview   

 19.1.4.            Recent Developments

 19.1.5.            Growth Strategy        

 19.1.6.            SWOT Analysis         

19.2.    Nautilus Data Technologies

19.3.    Subsea Cloud

19.4.    Google LLC


19.5.    Other Key Players      

Request Free Sample

We prioritize the confidentiality and security of your data. Our promise: your information remains private.

Ready to Transform Data into Decisions?

Request Your Sample Report and Start Your Journey of Informed Choices


Providing the strategic compass for industry titans.

cr-clients-logos

Frequently Asked Questions:

What is the current market size for Underwater Data Center Market, and what is its projected size in 2032?

The Underwater Data Center Market is valued at USD 2,510.2 Million in 2024 and is projected to reach USD 10,543.4 Million by 2032.

At what Compound Annual Growth Rate is the Underwater Data Center Market projected to grow between 2025 and 2032?

The Underwater Data Center Market is expected to grow at a CAGR of 19.79% during the forecast period.

Which Underwater Data Center Market segment held the largest share in 2024?

The hardware segment held the largest share in the Underwater Data Center Market, accounting for 55% of the component category.

What are the primary factors fueling the growth of the Underwater Data Center Market?

Key drivers include rising cloud computing and edge infrastructure demand, energy-efficient cooling systems, and increasing investment from technology leaders.

Who are the leading companies in the Underwater Data Center Market?

Key players in the Underwater Data Center Market include Microsoft Corporation, Google LLC, Nautilus Data Technologies, and Subsea Cloud.

Which region commanded the largest share of the Underwater Data Center Market in 2024?

North America commanded the largest share of the Underwater Data Center Market in 2024, holding 28% of the global market.

About Author

Sushant Phapale

Sushant Phapale

ICT & Automation Expert

Sushant is an expert in ICT, automation, and electronics with a passion for innovation and market trends.

View Profile


Related Reports

Student Information System Market

Student Information System Market size was valued at USD 11,970.93 million in 2024 and is anticipated to reach USD 34,124.14 million by 2032, at a CAGR of 13.99% during the forecast period.

Retail Interactive Kiosk Market

Retail Interactive Kiosk Market size was valued at USD 13,980 million in 2024 and is anticipated to reach USD 26,029.74 million by 2032, at a CAGR of 8.08% during the forecast period.

Mobile Payment Data Protection Market

Mobile Payment Data Protection market size was valued at USD 26,350.83 million in 2024 and is anticipated to reach USD 79,493.1 million by 2032, at a CAGR of 14.8% during the forecast period.

Low-Voltage Cables and Accessories Market

The Low-Voltage Cables and Accessories Market size was valued at USD 122,988 million in 2024 and is anticipated to reach USD 184,496.4 million by 2032, expanding at a CAGR of 5.2% during the forecast period.

Life Insurance Policy Administration System Market

The Life Insurance Policy Administration System market size was valued at USD 6,288 million in 2024 and is anticipated to reach USD 15,347.34 million by 2032, expanding at a CAGR of 11.8% during the forecast period.

Cooling Towers Market

The global demand for Cooling Towers was valued at USD 3,812.50 Million in 2023 and is expected to reach USD 5,914.43 Million in 2032, growing at a CAGR of 5.00% between 2024 and 2032.

Hybrid Microgrid Energy Management Software Market

The Global Hybrid Microgrid Energy Management Software Market size was valued at USD 786.57 million in 2018 to USD 1,478.26 million in 2024 and is anticipated to reach USD 4,063.70 million by 2032, at a CAGR of 12.56% during the forecast period.

UK Premium Fully Integrated Dishwasher Market

The UK Premium Fully Integrated Dishwasher Market size was valued at USD 430.62 million in 2018 to USD 677.41 million in 2024 and is anticipated to reach USD 1,253.47 million by 2032, at a CAGR of 7.45% during the forecast period.

UAE Artificial Intelligence in Retail Market

The UAE AI in Retail Market size was valued at USD 99.10 million in 2018 to USD 212.15 million in 2024. The market is anticipated to reach USD 850.25 million by 2032. The forecast period reflects a CAGR of 17.67%.

Electronic Design Automation Software Market

The Electronic Design Automation Software Market size was valued at USD 13,312 million in 2024 and is anticipated to reach USD 26,544.04 million by 2032, growing at a CAGR of 9.01% during the forecast period.

Electrical Conduit Systems Market

Electrical Conduit Systems Market size was valued at USD 10.98 Billion in 2024 and is anticipated to reach USD 18.45 Billion by 2032, at a CAGR of 6.7% during the forecast period.

Storage Area Network (SAN) Solutions Market

The Global Storage Area Network (SAN) Solutions Market size was valued at USD 18,450.00 million in 2018 to USD 21,623.19 million in 2024 and is anticipated to reach USD 32,708.50 million by 2032, at a CAGR of 5.38% during the forecast period.

Licence Option

The report comes as a view-only PDF document, optimized for individual clients. This version is recommended for personal digital use and does not allow printing. Use restricted to one purchaser only.
$4999

To meet the needs of modern corporate teams, our report comes in two formats: a printable PDF and a data-rich Excel sheet. This package is optimized for internal analysis. Unlimited users allowed within one corporate location (e.g., regional office).
$6999

The report will be delivered in printable PDF format along with the report’s data Excel sheet. This license offers 100 Free Analyst hours where the client can utilize Credence Research Inc. research team. Permitted for unlimited global use by all users within the purchasing corporation, such as all employees of a single company.
$12999

Report delivery within 24 to 48 hours

Europe

North America

Email

Smallform of Sample request
User Review

Thank you for the data! The numbers are exactly what we asked for and what we need to build our business case.

Materials Scientist
(privacy requested)

User Review

The report was an excellent overview of the Industrial Burners market. This report does a great job of breaking everything down into manageable chunks.

Imre Hof
Management Assistant, Bekaert

cr-clients-logos

Request Sample