Market Overview:
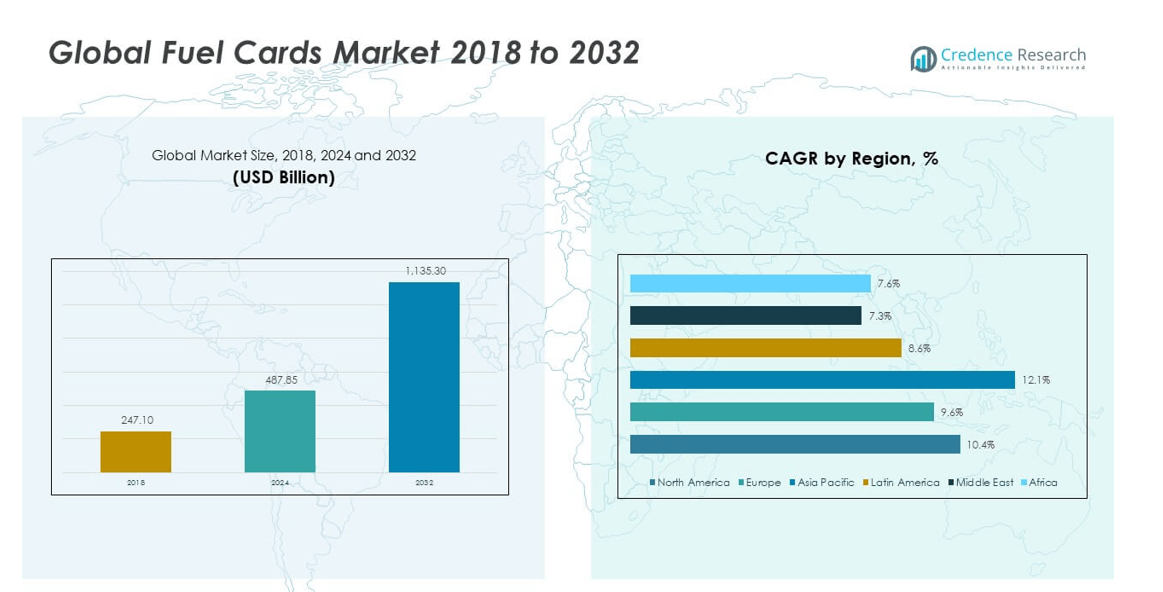
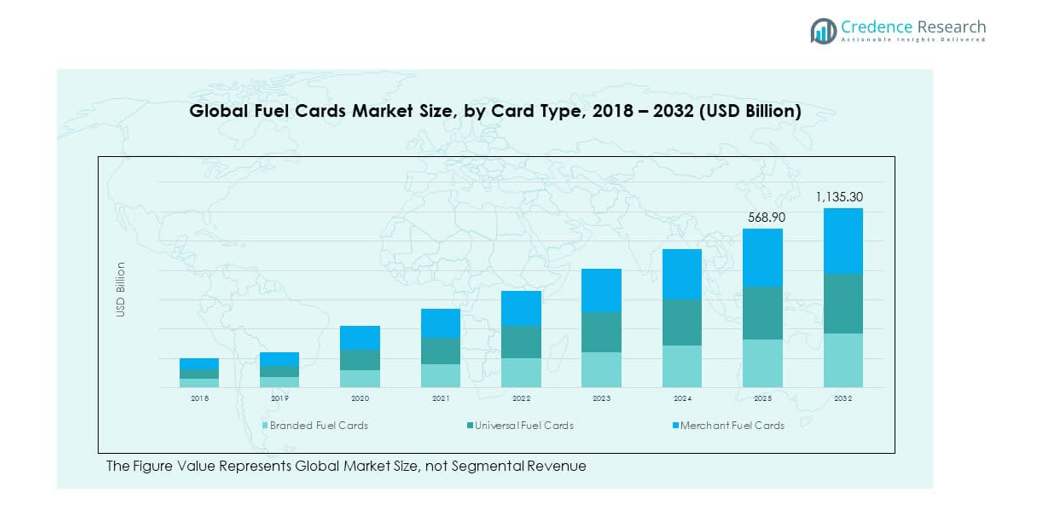
The Global Fuel Cards Market size was valued at USD 247.10 million in 2018 to USD 487.85 million in 2024 and is anticipated to reach USD 1,135.30 million by 2032, at a CAGR of 10.37% during the forecast period.
| REPORT ATTRIBUTE |
DETAILS |
| Historical Period |
2020-2023 |
| Base Year |
2024 |
| Forecast Period |
2025-2032 |
| Fuel Cards Market Size 2024 |
USD 487.85 million |
| Fuel Cards Market, CAGR |
10.37% |
| Fuel Cards Market Size 2032 |
USD 1,135.30 million |
The Global Fuel Cards Market is expanding due to rising fleet operations, cost-efficient fuel management systems, and the increasing demand for cashless payment options. Businesses are adopting these cards to improve expense tracking, prevent fuel fraud, and enhance operational transparency. The integration of advanced analytics and telematics with fuel card platforms helps optimize route efficiency and monitor driver behavior, further driving market growth.
Regionally, North America and Europe dominate the Fuel Cards Market due to strong adoption among corporate and logistics sectors. Asia Pacific is emerging as a fast-growing region, driven by rapid urbanization, expanding commercial vehicle fleets, and government support for digital payments. The Middle East and Latin America are showing steady growth due to increasing fuel consumption and infrastructure investments.
Market Insights:
- The Global Fuel Cards Market was valued at USD 247.10 billion in 2018, reached USD 487.85 billion in 2024, and is projected to reach USD 1,135.30 billion by 2032, expanding at a CAGR of 10.37% during the forecast period.
- North America leads the market with a 43% share, supported by high fleet density, advanced payment infrastructure, and widespread adoption of digital fuel management systems. Europe follows with a 28% share, driven by strict emission policies and strong adoption across logistics sectors.
- The Asia Pacific region ranks third with a 20% share, growing rapidly due to rising vehicle ownership, e-commerce expansion, and adoption of digital fuel cards by small and medium fleet operators.
- Asia Pacific is also the fastest-growing region, backed by urbanization, increasing transport networks, and partnerships between fintech firms and fuel providers that boost payment accessibility.
- Branded Fuel Cards hold around 48% of total market share, driven by strong brand loyalty and network coverage, while Universal Fuel Cards account for 35%, supported by flexibility and wide acceptance across multiple fuel brands.
Access crucial information at unmatched prices!
Request your sample report today & start making informed decisions powered by Credence Research Inc.!
Download Sample
Market Drivers:
Growing Demand for Efficient Fleet Management Solutions
The Global Fuel Cards Market is driven by the rising need for efficient fleet management among logistics and transportation companies. Businesses are adopting fuel cards to monitor fuel usage, control costs, and minimize fraud. These cards provide real-time data on transactions, vehicle routes, and driver activities. It enables better budgeting and enhances accountability across operations. Growing emphasis on operational transparency and cost reduction boosts adoption. Fleet owners rely on digital tools to optimize vehicle routes and reduce idle time. Integration of telematics with fuel card systems further enhances performance tracking and compliance.
- For instance, recent Shell Fleet Solutions surveys in early 2025 found that 62% of U.S.-based fleets use fuel cards predominantly to track expenses and improve data visibility, and 95% of managers credited fuel cards as critical for data-driven operational improvements, including cost management and transaction oversight. Fleet card platforms such as WEX SecureFuel integrate truck telematics and provide instant alerts for unauthorized transactions, with coverage at more than 16,000 truck stops across the United States, and enable real-time location and tank-level checks to reduce fraud and unauthorized spend.
Rising Shift Toward Cashless and Digital Payment Systems
The transition to cashless payments is fueling market expansion, especially among enterprises aiming for seamless expense control. Companies prefer fuel cards for their convenience, security, and simplified reporting features. It supports automated record-keeping, which reduces human errors and improves accounting accuracy. Governments and financial institutions promote digital payment infrastructures, increasing card usage across regions. Rising consumer comfort with digital transactions accelerates this transition. Businesses adopting contactless and mobile-based fuel payment solutions enhance driver efficiency and safety. The widespread use of fuel cards aligns with global digitization efforts. This shift drives sustained demand across corporate fleets and retail fuel networks.
- For instance, Visa reported that during Holy Week 2025, overall payment transactions in Latin America increased by 25%, with contactless payments also growing significantly. Europcar Mobility Group has partnered with NewMotion (now part of the Shell Group), providing access to more than 200,000 smart vehicle charging points across Europe, and offers digital charging cards to all customers renting electric vehicles—demonstrating a digital-first shift in payment and mobility services.
Increasing Need for Expense Tracking and Fraud Prevention
Corporations use fuel cards to strengthen financial transparency and prevent misuse of company funds. The cards allow detailed transaction monitoring, ensuring drivers adhere to assigned fuel budgets. It minimizes unauthorized purchases and improves audit readiness. Real-time alerts and spending controls support financial integrity across fleets. Advanced analytics integrated into card systems provide insights into usage patterns. Companies leverage these insights to refine policies and improve fuel economy. Continuous innovations in card security enhance user confidence and compliance. These capabilities make fuel cards an essential tool in corporate cost control.
Adoption of Data-Driven Insights for Business Optimization
Fuel card systems increasingly serve as analytical tools that support data-based decisions. The Global Fuel Cards Market benefits from advanced analytics that identify spending trends and fuel inefficiencies. Businesses use this data to manage resources better and forecast operational needs. It improves budgeting accuracy and reduces wasteful expenditure. Integration with telematics offers comprehensive visibility into vehicle performance and route efficiency. Predictive analytics help reduce downtime and fuel costs. Such tools encourage smarter, evidence-based business operations. This growing analytical focus supports the market’s long-term growth.
Market Trends:
Integration of AI and IoT in Fuel Card Platforms
The integration of AI and IoT technologies is transforming how businesses use fuel card systems. These tools collect vast data on vehicle behavior, consumption rates, and fuel station usage. It enables predictive maintenance and performance optimization. AI algorithms detect anomalies and prevent fraudulent transactions. IoT sensors enhance route efficiency by syncing with real-time traffic data. Companies gain a detailed operational overview, boosting productivity and sustainability. This smart technology integration improves fleet management standards. Growing digital transformation across industries continues to advance this trend.
- For instance, Edenred launched fleet card solutions in France and Germany, leveraging Spirii’s technology for smart EV charging and real-time expense management, allowing fleet managers to simplify payment tracking and maintenance scheduling. FleetCor fuel card platforms use geo-location matching and telematics integration to flag suspicious transactions, helping fleet operators prevent fraud based on real-time vehicle and driver behavior data.
Expansion of Partnerships Between Fuel Providers and Fintech Firms
The collaboration between fuel suppliers and fintech firms is reshaping market dynamics. Fuel card solutions backed by fintech innovation provide enhanced control and digital integration. It enables customers to access flexible payment options and tailored spending limits. Providers use advanced software to connect loyalty programs, credit systems, and fuel data analytics. These partnerships expand customer reach and improve service personalization. Fintech integration allows real-time fuel pricing updates and dynamic discounting models. The cooperation enhances efficiency across logistics and energy sectors. Such partnerships drive consistent innovation within the Global Fuel Cards Market.
- For instance, Shell Fleet Solutions regularly enhances platforms with integration capabilities for biometric authentication and secure data transmission, while offering wide station network access, with its Shell Card Business Flex being accepted at 95% of U.S. fueling sites and now supporting EV charging at public and residential stations. Edenred Essentials Visa Fleet card, introduced in partnership with Visa, provides enhanced product category controls, supporting a wide range of fleet-related expenses and fraud prevention at any service station accepting Visa.
Adoption of Cloud-Based Fleet Management Platforms
Cloud-based systems are revolutionizing how companies manage and analyze fuel data. The integration of fuel cards with cloud technology improves scalability and remote accessibility. It enables enterprises to oversee multiple fleets through unified dashboards. Real-time data synchronization reduces manual intervention and enhances transparency. Businesses benefit from faster updates, lower IT costs, and improved reporting accuracy. Cloud infrastructure supports API integration, connecting fuel card systems with enterprise resource tools. This trend boosts flexibility for multinational fleet operations. It continues to define the future of digital fuel management.
Focus on Sustainability and Carbon Emission Tracking
Sustainability is becoming a core aspect of fuel card solutions. Companies are introducing green fuel programs and carbon tracking features within their systems. It helps users monitor fuel consumption patterns and offset emissions effectively. Growing global focus on ESG compliance drives adoption of eco-conscious fuel management practices. Businesses seek to align fuel operations with environmental goals and efficiency standards. Integration of renewable energy metrics supports sustainable reporting frameworks. This evolution encourages accountability across supply chains. Sustainability-focused innovation strengthens the competitive edge of fuel card providers.
Market Challenges Analysis:
Data Security and Privacy Concerns in Digital Transactions
The rapid digitization of fuel card systems increases exposure to cybersecurity threats. Companies face risks related to data theft, unauthorized access, and system breaches. It demands continuous investment in encryption, authentication, and fraud detection technologies. Fuel card providers must maintain strict compliance with data protection laws. Any breach can damage brand reputation and erode customer trust. Growing digital integration across networks complicates security management. Firms need to balance convenience with robust safety measures. Managing these risks remains one of the key challenges in the Global Fuel Cards Market.
Operational Limitations and Integration Issues Across Networks
Different payment networks and fuel station infrastructures create interoperability challenges. It restricts seamless usage across diverse regions or service providers. Inconsistent standards delay card acceptance and reduce convenience for users. It forces companies to maintain multiple systems, raising costs and complexity. Integration with older fleet management software often requires expensive customization. Network downtime or technical errors can disrupt operations and reduce efficiency. Businesses demand more standardized systems to ensure reliability and performance. Overcoming these operational barriers is vital for market expansion.
Market Opportunities:
Emergence of Digital Payment Ecosystems in Developing Regions
Emerging economies offer significant growth potential for fuel card adoption. Rapid expansion of transport infrastructure and digital payment platforms supports market entry. It encourages businesses and consumers to move away from cash-based transactions. Governments in these regions promote financial inclusion and electronic payment systems. Fuel providers capitalize on this shift through strategic partnerships and localized solutions. Increasing mobile payment use also enhances accessibility for small fleets. This environment provides new opportunities for scalable fuel card services. Expanding in these regions will accelerate overall market growth.
Integration of Electric Vehicle (EV) Charging and Alternative Fuels
The ongoing transition toward electric and hybrid fleets opens new business avenues. The Global Fuel Cards Market is evolving to include EV charging networks and alternative fuel payments. It supports companies adopting sustainable mobility strategies. Providers integrate features that manage both fuel and energy expenses on one platform. Such multi-fuel compatibility creates convenience for fleet operators. Strategic investments in EV infrastructure strengthen long-term growth prospects. The combination of green energy and digital payments enhances industry resilience. This shift positions fuel card systems as central tools in modern mobility ecosystems.
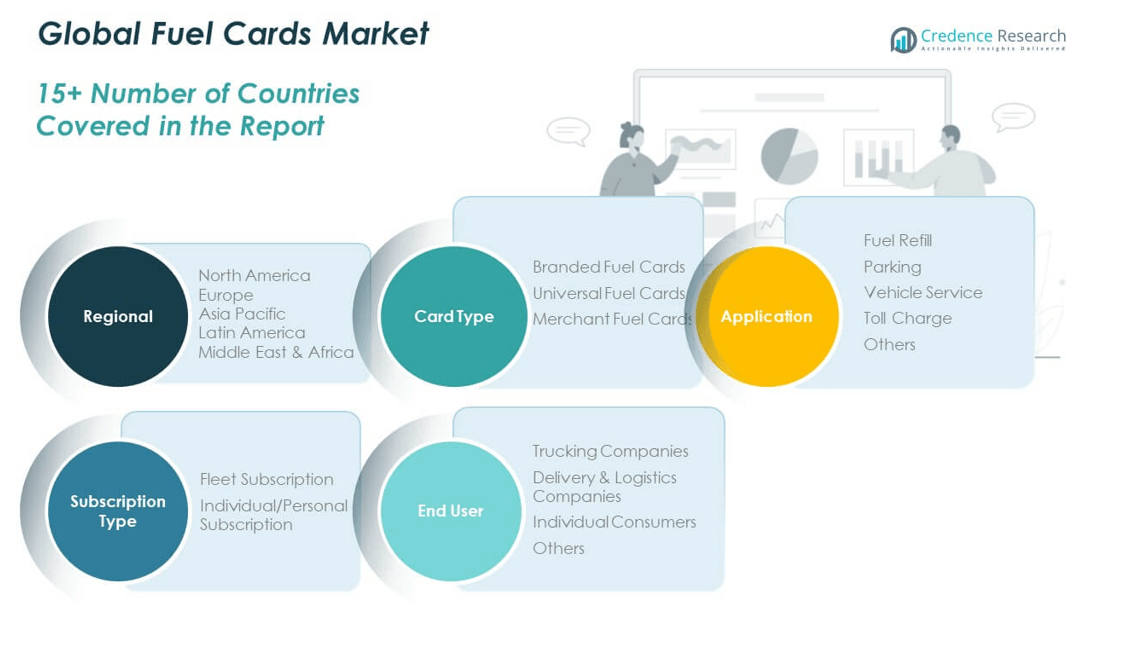
Market Segmentation Analysis:
By Card Type
The Global Fuel Cards Market is segmented into branded, universal, and merchant fuel cards. Branded cards dominate due to their strong network coverage and loyalty benefits offered by fuel retailers. Universal cards gain traction among corporate fleets for flexibility across multiple fuel brands. Merchant cards serve niche markets, supporting small businesses and regional operators. It continues to evolve with added digital payment features and real-time transaction visibility, enhancing overall adoption.
- For instance, BP supports 1.8 million fleet drivers throughout Europe using branded cards that offer fueling and convenience solutions across major logistics routes. WEX’s universal cards in Europe offer customizable mobility budgets and are interoperable with diverse suppliers, while FleetCor provides spending controls and PIN validation options for merchant cards, allowing operators to set limits on specific merchant types and timeframes.
By Application
Key applications include fuel refill, parking, vehicle service, toll charge, and others. Fuel refill remains the largest segment, driven by consistent fleet operations and high vehicle utilization. Toll and parking payments grow rapidly due to integrated payment solutions improving travel efficiency. Vehicle service applications gain momentum from maintenance-linked fuel card programs. It supports seamless financial management for transport and logistics companies.
- For instance, WEX Plus in Europe lets customers pay for tolls, parking, and EV charging, all within one app, with instant reporting and account management tools that allow fleet managers to set individual mobility budgets by category and timeframe. Edenred’s card facilitates toll, maintenance, and roadside assistance expenses as routine card transactions, helping companies improve traceability, compliance, and reporting efficiency.
By Subscription Type
The market is divided into fleet and individual/personal subscriptions. Fleet subscriptions hold a major share, supported by large-scale adoption among logistics and transportation businesses. Individual subscriptions expand with rising personal vehicle ownership and demand for expense tracking. It offers convenience and transparency, making both segments vital for sustained market growth.
By End User
End users include trucking companies, delivery and logistics firms, individual consumers, and others. Trucking companies dominate due to extensive fuel usage and networked fleet operations. Delivery and logistics companies follow with growing demand for real-time fuel expense control. Individual users adopt fuel cards for budgeting and cashless convenience. It strengthens user engagement across all operational levels.
Segmentation:
- By Card Type
- Branded Fuel Cards
- Universal Fuel Cards
- Merchant Fuel Cards
- By Application
- Fuel Refill
- Parking
- Vehicle Service
- Toll Charge
- Others
- By Subscription Type
- Fleet Subscription
- Individual/Personal Subscription
- By End User
- Trucking Companies
- Delivery & Logistics Companies
- Individual Consumers
- Others
- By Region
- North America
- Europe
- Germany
- France
- U.K.
- Italy
- Spain
- Rest of Europe
- Asia Pacific
- China
- Japan
- India
- South Korea
- South-east Asia
- Rest of Asia Pacific
- Latin America
- Brazil
- Argentina
- Rest of Latin America
- Middle East & Africa
- GCC Countries
- South Africa
- Rest of the Middle East and Africa
Regional Analysis:
North America
The North America Global Fuel Cards Market size was valued at USD 108.07 million in 2018 to USD 211.15 million in 2024 and is anticipated to reach USD 492.73 million by 2032, at a CAGR of 10.4% during the forecast period. North America accounted for 43% of the global market share in 2024. The region dominates due to its large fleet industry, high fuel consumption, and advanced payment infrastructure. Strong adoption among logistics, construction, and transportation companies fuels demand. It benefits from early digitization and a well-established commercial vehicle network. Integration of telematics and real-time data solutions enhances fuel efficiency across fleets. The U.S. leads the market, supported by growing e-commerce and delivery networks. Canada and Mexico follow with expanding infrastructure and digital payment penetration. Continuous investment in fuel management technology ensures North America remains the key revenue contributor.
Europe
The Europe Global Fuel Cards Market size was valued at USD 72.27 million in 2018 to USD 137.69 million in 2024 and is anticipated to reach USD 302.25 million by 2032, at a CAGR of 9.6% during the forecast period. Europe captured 28% of the global market share in 2024. The region’s growth is supported by strong regulatory frameworks, emission control policies, and digital payment adoption. Fleet operators in countries like the UK, Germany, and France use fuel cards to improve cost management and sustainability. It benefits from government initiatives promoting electronic transactions and transparent fuel usage. European fuel providers integrate loyalty and emission-tracking programs into their card systems. Rising demand for green mobility and cross-border fleet operations drives steady growth. Expanding electric and hybrid fleet adoption further enhances regional demand. Europe continues to strengthen its position through innovation and policy alignment.
Asia Pacific
The Asia Pacific Global Fuel Cards Market size was valued at USD 46.02 million in 2018 to USD 98.73 million in 2024 and is anticipated to reach USD 261.13 million by 2032, at a CAGR of 12.1% during the forecast period. Asia Pacific held 20% of the global market share in 2024. Rapid urbanization, booming logistics, and expanding e-commerce sectors support market acceleration. China, India, Japan, and Australia lead adoption through large commercial vehicle fleets. It benefits from increased fuel consumption and modernization of transportation systems. Governments encourage digital payment ecosystems and financial transparency across fuel retail networks. Local fuel providers form partnerships with fintech firms to expand reach. The region shows high potential for technological integration, including mobile-based fuel payment solutions. Asia Pacific remains the fastest-growing market, driven by industrial growth and digitization.
Latin America
The Latin America Global Fuel Cards Market size was valued at USD 10.90 million in 2018 to USD 21.24 million in 2024 and is anticipated to reach USD 43.34 million by 2032, at a CAGR of 8.6% during the forecast period. Latin America represented 4% of the global market share in 2024. The region experiences steady growth due to expanding logistics networks and improved fuel distribution systems. Brazil and Mexico dominate adoption due to their strong transport sectors and rising demand for fleet automation. It gains traction through initiatives promoting electronic payments and business efficiency. Local banks and oil companies introduce co-branded fuel cards targeting commercial fleets. Increasing awareness of digital expense management supports wider use. Currency fluctuations and uneven digital infrastructure remain challenges but do not hinder progress. The region’s growing focus on cost efficiency ensures long-term potential.
Middle East
The Middle East Global Fuel Cards Market size was valued at USD 5.55 million in 2018 to USD 9.78 million in 2024 and is anticipated to reach USD 18.21 million by 2032, at a CAGR of 7.3% during the forecast period. The Middle East accounted for 2% of the global market share in 2024. The region benefits from strong oil-based economies and expanding commercial transport activities. It experiences increasing demand from logistics and corporate fleets. Governments are promoting digital transformation and fuel tracking mechanisms. The UAE and Saudi Arabia lead adoption with advanced payment solutions and fleet monitoring systems. It leverages strategic partnerships between fuel distributors and payment technology providers. Growth is further supported by smart city initiatives and sustainability efforts. Middle Eastern markets show strong potential for premium, tech-driven fuel card solutions.
Africa
The Africa Global Fuel Cards Market size was valued at USD 4.30 million in 2018 to USD 9.28 million in 2024 and is anticipated to reach USD 17.63 million by 2032, at a CAGR of 7.6% during the forecast period. Africa captured 3% of the global market share in 2024. The region is in its early adoption phase but shows promising potential. South Africa leads with strong digital payment integration and expanding logistics networks. It benefits from infrastructure growth and government support for financial inclusion. Increasing fuel demand across industrial and transport sectors drives steady expansion. Collaboration between fuel retailers and fintech firms improves market accessibility. Limited awareness and technological readiness remain barriers in several countries. Continued investment in payment infrastructure will strengthen Africa’s role in the global landscape.
Shape Your Report to Specific Countries or Regions & Enjoy 30% Off!
Key Player Analysis:
Competitive Analysis:
The Global Fuel Cards Market is characterized by intense competition among global and regional players focused on expanding service networks and digital capabilities. Leading companies such as BP p.l.c., Exxon Mobil Corporation, FleetCor Technologies, WEX Inc., and U.S. Bancorp dominate through diversified card portfolios and advanced analytics solutions. It emphasizes innovation in contactless payment, telematics integration, and AI-based transaction tracking to enhance customer efficiency. Strategic collaborations with fintech firms and fuel distributors strengthen market positioning. Providers continue to focus on user convenience, fraud prevention, and cross-border usability to maintain competitive advantage.
Recent Developments:
- In October 2025, BP plc successfully started production from the Murlach field in the UK North Sea, marking its sixth major upstream oil and gas project launch this year and demonstrating ongoing momentum in BP’s global expansion of fuel production to meet rising energy demand in the fuel cards market.
- FirstRand Bank Limited entered into a strategic partnership with the International Finance Corporation (IFC) in September 2025 to widen access to finance for small and medium-sized enterprises, thereby supporting the rollout of accessible finance solutions for fuel card and fleet clients globally.
- FleetCor Technologies, Inc. has continued its inorganic growth strategy. While 2025 saw no major headline acquisitions, FleetCor completed its acquisition of a 70% stake in Brazil’s Zapay in March 2024, boosting its vehicle and fuel payment business in Latin America and supporting innovation in its global fleet card solutions.
- S. Bancorp in September 2025 launched a new embedded payroll solution designed for small businesses, improving digital finance and payment experiences for commercial fuel card clients as part of its expansion into capital-light, digitally-driven partnerships. The company also continued to build on its multi-year partnership with State Farm to deliver banking products, including those tailored for fleet operators via a capital-light distribution model.
Report Coverage:
The research report offers an in-depth analysis based on Card Type, Application, Subscription Type, and End User. It details leading market players, providing an overview of their business, product offerings, investments, revenue streams, and key applications. Additionally, the report includes insights into the competitive environment, SWOT analysis, current market trends, as well as the primary drivers and constraints. Furthermore, it discusses various factors that have driven market expansion in recent years. The report also explores market dynamics, regulatory scenarios, and technological advancements that are shaping the industry. It assesses the impact of external factors and global economic changes on market growth. Lastly, it provides strategic recommendations for new entrants and established companies to navigate the complexities of the market.
Future Outlook:
- Digital transformation will remain a major growth driver for fuel card adoption.
- Integration of AI and IoT will enhance fraud detection and transaction monitoring.
- Electric vehicle charging integration will expand the utility of hybrid fuel cards.
- Partnerships between fintechs and oil companies will diversify service portfolios.
- Demand from logistics and transport sectors will continue to dominate usage.
- Sustainability initiatives will push providers to adopt carbon-tracking features.
- Cloud-based platforms will drive transparency and fleet cost optimization.
- Regional expansion into emerging economies will accelerate user base growth.
- Mobile-first solutions will redefine convenience and card accessibility.
- Continuous innovation will reshape competitive dynamics and long-term profitability.


