Market Overview
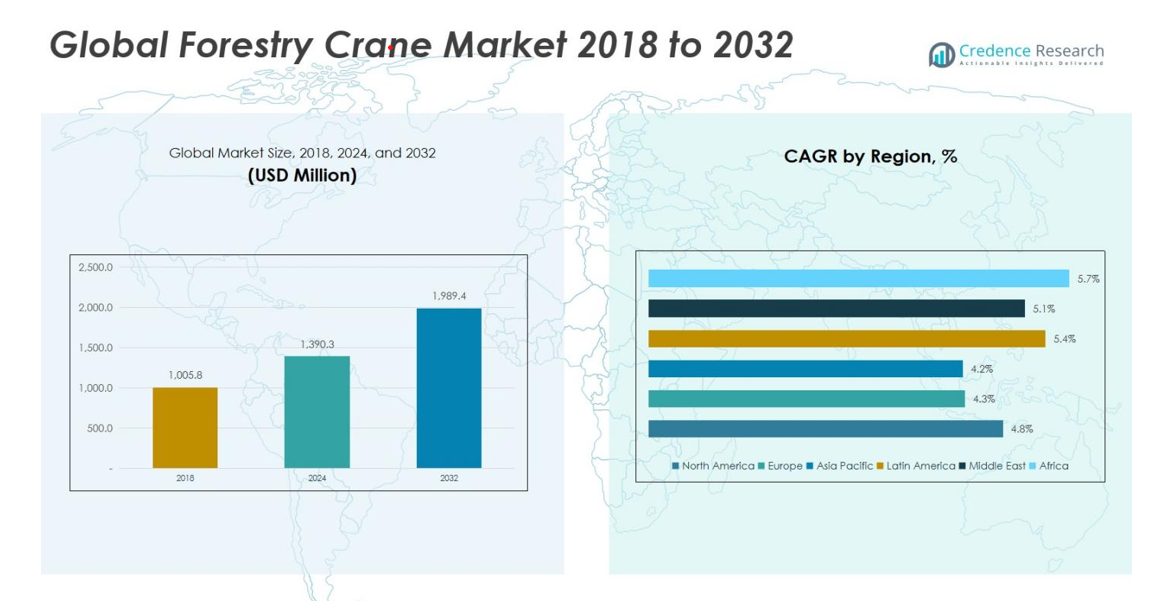
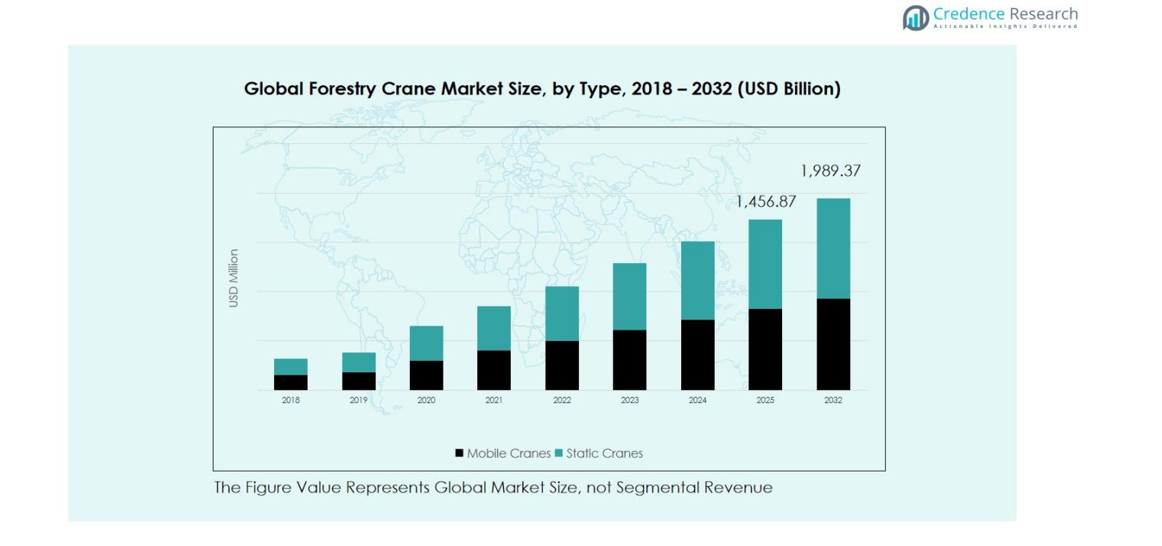
Global Forestry Crane Market size was valued at USD 1,005.8 Million in 2018, rising to USD 1,390.3 Million in 2024, and is anticipated to reach USD 1,989.4 Million by 2032, at a CAGR of 4.55% during the forecast period.
| REPORT ATTRIBUTE |
DETAILS |
| Historical Period |
2020-2023 |
| Base Year |
2024 |
| Forecast Period |
2025-2032 |
| Forestry Crane Market Size 2024 |
USD 1,390.3 Million |
| Forestry Crane Market, CAGR |
4.55% |
| Forestry Crane Market Size 2032 |
USD 1,989.4 Million |
The Global Forestry Crane Market is highly competitive, with leading players including Altec, Cargotec, Bonfiglioli Group, Palfinger Epsilon, Tamtron Group, Bell Equipment, Kesla Ag, Industrias Guerra, and FTG Mowi. These companies focus on product innovation, advanced mobile and static crane designs, automation, and eco-friendly solutions to strengthen market presence. Asia Pacific emerges as the leading region, accounting for approximately 36% of the global market share in 2024, driven by rapid industrialization, expanding commercial forestry, and growing timber exports in China, Japan, India, and Southeast Asia. The combination of rising mechanization, government support for sustainable forestry practices, and adoption of high-capacity, versatile cranes has positioned Asia Pacific as the most significant growth hub, attracting investments from both regional and global players to capture emerging opportunities and enhance operational efficiency in logging and timber transportation operations.
Market Insights
- The Global Forestry Crane Market was valued at USD 1,390.3 million in 2024 and is projected to reach USD 1,989.4 million by 2032, growing at a CAGR of 4.55%.
- Rising mechanization in forestry operations and increasing timber production are driving demand for high-capacity mobile and static cranes, enhancing efficiency and safety in logging and timber transportation.
- Market trends include the adoption of automated and IoT-enabled cranes, multi-purpose modular designs, and a focus on eco-friendly operations to reduce environmental impact and operational costs.
- The market is highly competitive with key players such as Altec, Cargotec, Bonfiglioli Group, Palfinger Epsilon, Tamtron Group, Bell Equipment, Kesla Ag, Industrias Guerra, and FTG Mowi, focusing on innovation, partnerships, and regional expansion.
- Asia Pacific leads the regional market with approximately 36% share, followed by Europe and North America; mobile cranes dominate the type segment with 62% share, while logging operations lead applications at 57%.
Access crucial information at unmatched prices!
Request your sample report today & start making informed decisions powered by Credence Research Inc.!
Download Sample
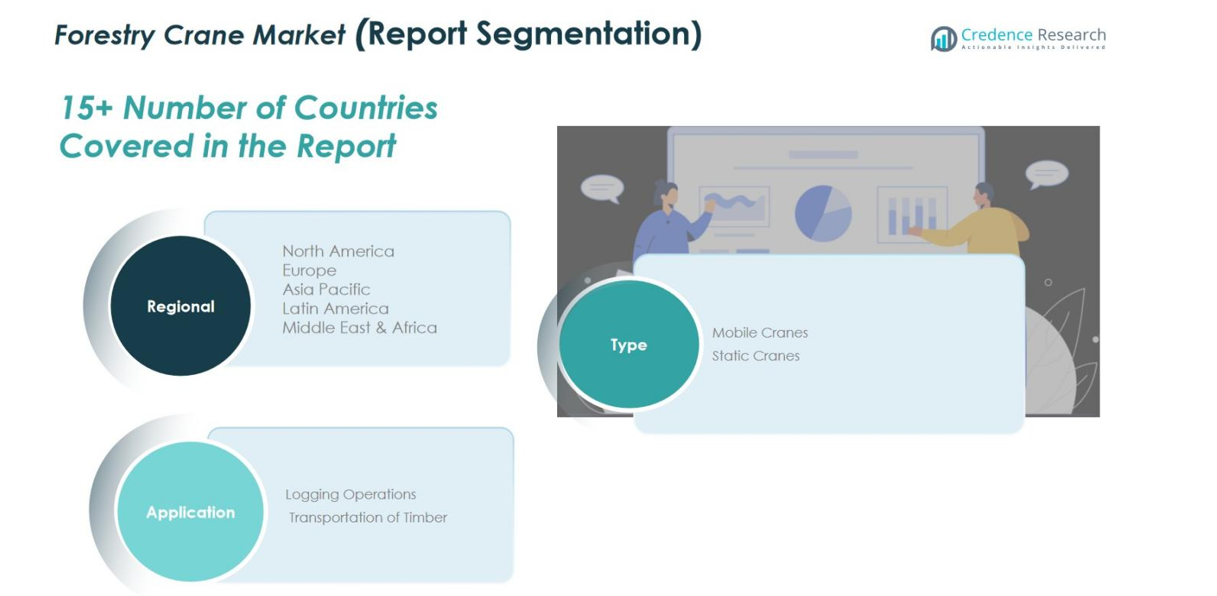
Market Segmentation Analysis:
By Type
The Mobile Cranes segment dominates the forestry crane market with a revenue share of 62%, driven by their flexibility, ease of relocation, and ability to operate across diverse terrains. Increasing mechanization in forestry operations and demand for efficient timber handling solutions are fueling growth. Static Cranes, holding a smaller share of around 38%, are primarily used in fixed logging sites or timber yards. Their adoption is supported by high lifting capacity and durability, but limited mobility restrains wider deployment compared to mobile units.
- For instance, Konecranes’ mobile cranes are designed to handle the unloading, storing, and feeding of logs in pulp mills, operating efficiently in all weather conditions
By Application
Within applications, Logging Operations lead the market with a 57% share, as forestry companies prioritize speed, accuracy, and safety in felling and handling timber. The growing focus on sustainable forestry practices and automation is driving mobile crane adoption in logging activities. Transportation of Timber, accounting for 43% of the market, benefits from rising demand for long-distance timber movement and enhanced load-handling equipment, but its growth is somewhat restrained by terrain limitations and infrastructure dependency.
- For instance, companies like Hiab have developed logging cranes equipped with precision hydraulic systems and operator safety features, facilitating faster and safer timber handling in challenging terrains
Key Growth Drivers
Increasing Demand for Mechanization in Forestry
The growing emphasis on mechanized forestry operations is a primary driver for the Global Forestry Crane Market. Companies are replacing manual labor with advanced cranes to enhance efficiency, safety, and productivity in timber harvesting and handling. Mobile cranes, in particular, are favored for their flexibility across varied terrains. Expanding commercial forestry projects and rising demand for sustainable timber extraction methods are pushing investments in high-capacity cranes, accelerating market growth as operators prioritize equipment that reduces operational downtime and enhances precision in logging and timber transport activities.
- For instance, Komatsu’s 845-1 forwarder offers a 12-metric-ton crane with long reach and excellent lifting power, making it suitable for tough terrain conditions.
Rising Timber Production and Logging Activities
Expanding global timber production is fueling demand for forestry cranes, especially in regions like North America and Europe. Increased logging activities necessitate reliable equipment capable of handling large volumes efficiently. The need for quick deployment and seamless transportation of felled timber boosts the adoption of mobile and static cranes alike. Furthermore, the integration of automated features in modern forestry cranes enhances operational productivity, reduces labor costs, and ensures adherence to environmental standards, strengthening the market’s growth trajectory.
- For instance, Ponsse’s Scale system automates load weighing during both loading and unloading stages, ensuring optimal load handling and simplifying data management. This feature is particularly beneficial in varying weather conditions, maintaining accuracy regardless of temperature
Technological Advancements and Automation
Advances in crane technology, including automated controls, telematics, and remote monitoring, are driving market growth. These innovations enhance precision, safety, and operational efficiency, enabling operators to manage complex logging and timber-handling tasks effectively. Manufacturers are incorporating smart sensors and IoT-enabled systems to optimize load management and predictive maintenance. The adoption of such technology reduces downtime, improves cost efficiency, and attracts forestry companies to upgrade their fleets, making technological advancement a critical growth driver in the global forestry crane landscape.
Key Trends and Opportunities
Trend Toward Sustainable and Eco-Friendly Operations
The market is witnessing a shift toward sustainable forestry practices, creating opportunities for environmentally efficient crane solutions. Operators are increasingly adopting low-emission engines, electric or hybrid cranes, and precision-based handling systems to minimize environmental impact. Sustainable equipment enhances compliance with regulations and aligns with corporate ESG initiatives, making eco-friendly forestry cranes highly attractive. Companies investing in green technologies can capture new markets, reduce operational costs over the long term, and gain competitive advantage, highlighting sustainability as a key growth opportunity.
- For instance, Liebherr’s LTM 1150-5.4E mobile crane features an integrated battery that enables up to four hours of autonomous operation without a power connection. This crane meets “Zero Emissions Construction Sites” standards, combining sustainability with maximum efficiency.
Rising Adoption of Multi-Purpose and Modular Cranes
Forestry operators are increasingly investing in multi-purpose and modular crane systems that can handle diverse tasks, from logging to timber transportation. These adaptable solutions reduce operational costs by replacing multiple specialized machines. The ability to reconfigure cranes for different lifting and handling requirements enhances productivity across varied terrains and logging operations. Growing awareness of cost efficiency and operational flexibility drives demand for modular forestry cranes, presenting a significant opportunity for manufacturers to introduce versatile equipment that meets evolving market requirements.
- For instance, Konecranes’ M-series crane is a compact, modular winch with high-speed gears and powerful motors, designed for heavy-duty use in demanding applications.
Key Challenges
High Initial Investment and Operational Costs
Despite the market’s growth potential, high procurement costs and significant maintenance expenses pose challenges. Advanced forestry cranes, particularly mobile and automated models, require substantial capital investment, limiting adoption among small and mid-sized operators. Additionally, operational costs, including fuel consumption, maintenance, and skilled labor, can deter market penetration in price-sensitive regions. These financial barriers slow down fleet modernization and demand for technologically advanced cranes, creating a hurdle for broader market expansion despite rising demand for efficient forestry equipment.
Limited Skilled Workforce and Training Requirements
The effective operation of modern forestry cranes requires trained operators, creating a challenge for market growth. Limited availability of skilled labor, especially in developing regions, hinders the adoption of automated and advanced crane solutions. Companies must invest in training programs to ensure safe and efficient operation, adding to overall costs. Workforce limitations can lead to underutilization of sophisticated equipment and operational inefficiencies, making talent acquisition and training a critical challenge for manufacturers and forestry operators aiming to maximize the potential of advanced crane technologies.
Regional Analysis
North America
North America’s forestry crane market grew from USD 219.07 million in 2018 to USD 307.10 million in 2024 and is projected to reach USD 447.61 million by 2032, registering a CAGR of 4.8%. Growth is driven by advanced mechanization in forestry, rising demand for mobile cranes, and government initiatives supporting sustainable timber harvesting. The U.S. and Canada dominate the regional landscape due to established forestry operations and increasing investments in high-capacity, automated crane systems, which enhance efficiency and safety in logging and timber transportation operations.
Europe
Europe’s market expanded from USD 268.86 million in 2018 to USD 365.97 million in 2024 and is anticipated to reach USD 512.86 million by 2032, with a CAGR of 4.3%. Growth is supported by increasing timber production, adoption of technologically advanced mobile and static cranes, and strong regulatory frameworks promoting sustainable forestry practices. Germany, France, and the UK are key contributors, leveraging modern logging techniques and automated equipment to improve productivity in both logging operations and timber transportation.
Asia Pacific
Asia Pacific is the largest regional market, with growth from USD 366.42 million in 2018 to USD 497.97 million in 2024, projected to reach USD 696.28 million by 2032 at a CAGR of 4.2%. Rapid industrialization, expansion of commercial forestry, and rising timber exports in China, Japan, India, and Southeast Asia drive demand. The adoption of mobile cranes for logging and timber transportation, along with government support for mechanized and sustainable forestry practices, is accelerating regional market growth.
Latin America
Latin America’s forestry crane market grew from USD 97.26 million in 2018 to USD 141.29 million in 2024 and is projected to reach USD 215.25 million by 2032, achieving a CAGR of 5.4%. Brazil and Argentina dominate due to extensive commercial logging activities and growing timber exports. Increasing investment in mobile and multi-purpose cranes for logging operations, coupled with demand for improved timber transportation infrastructure, supports strong regional growth. Sustainable forestry initiatives further encourage adoption of advanced crane solutions.
Middle East
The Middle East market increased from USD 43.65 million in 2018 to USD 62.31 million in 2024 and is expected to reach USD 92.90 million by 2032 at a CAGR of 5.1%. Growth is driven by rising demand for timber handling solutions, infrastructure expansion, and investment in mobile and static crane technology. GCC countries and Turkey are key markets, adopting mechanized cranes for commercial forestry and timber processing operations while emphasizing operational efficiency and safety.
Africa
Africa’s forestry crane market grew from USD 10.56 million in 2018 to USD 15.67 million in 2024 and is projected to reach USD 24.47 million by 2032, registering a CAGR of 5.7%. Growth is fueled by increasing commercial logging in South Africa and Egypt, rising timber demand, and adoption of mobile cranes for efficient operations. Limited mechanization in the past is gradually improving with government support and investments in modern forestry equipment, creating significant future growth potential.
Market Segmentations:
By Type
- Mobile Cranes
- Static Cranes
By Application
- Logging Operations
- Transportation of Timber
By Region
- North America
- Europe
- Germany
- France
- U.K.
- Italy
- Spain
- Rest of Europe
- Asia Pacific
- China
- Japan
- India
- South Korea
- South-east Asia
- Rest of Asia Pacific
- Latin America
- Brazil
- Argentina
- Rest of Latin America
- Middle East & Africa
- GCC Countries
- South Africa
- Rest of the Middle East and Africa
Competitive Landscape
The competitive landscape of the Global Forestry Crane Market features key players such as Altec, Cargotec, Bonfiglioli Group, Palfinger Epsilon, Tamtron Group, Bell Equipment, Kesla Ag, Industrias Guerra, and FTG Mowi. Market competition is primarily driven by product innovation, technological advancements, and strategic partnerships. Leading companies are focusing on developing high-capacity mobile and static cranes with enhanced automation, safety features, and eco-friendly designs to meet evolving industry requirements. Expansion into emerging markets, after-sales services, and tailored solutions for logging and timber transportation further strengthen their positions. The market is also witnessing mergers, acquisitions, and collaborations to increase regional presence and diversify product portfolios. Continuous investments in R&D, adoption of IoT-enabled crane systems, and emphasis on sustainable operations are shaping competitive dynamics, compelling players to offer efficient, versatile, and cost-effective forestry crane solutions to maintain a competitive edge globally.
Shape Your Report to Specific Countries or Regions & Enjoy 30% Off!
Key Player Analysis
- Altec
- Cargotec
- Bonfiglioli Group
- Palfinger Epsilon
- Tamtron Group
- Bell Equipment
- Kesla Ag
- Industrias Guerra
- FTG Mowi
- Other Key Players
Recent Developments
- In June 2025, Logset launched its new H series cranes, including models H245, H325, and H405, engineered with customer input to prioritize power, speed, and reliability.
- In April 2025, Palfinger unveiled the PK 880 TEC loader crane at bauma 2025 in Munich, combining precision, maximum efficiency, and extensive lifting power, setting new standards in its class.
- In June 2025, Kesla launched the KESLA 2225 and 2228 tree-length cranes at the Forexpo 2025 exhibition in France
Report Coverage
The research report offers an in-depth analysis based on Type, Application and Region. It details leading market players, providing an overview of their business, product offerings, investments, revenue streams, and key applications. Additionally, the report includes insights into the competitive environment, SWOT analysis, current market trends, as well as the primary drivers and constraints. Furthermore, it discusses various factors that have driven market expansion in recent years. The report also explores market dynamics, regulatory scenarios, and technological advancements that are shaping the industry. It assesses the impact of external factors and global economic changes on market growth. Lastly, it provides strategic recommendations for new entrants and established companies to navigate the complexities of the market.
Future Outlook
- The market will witness increasing adoption of mobile and static cranes for efficient timber handling.
- Rising mechanization in forestry operations will drive demand for high-capacity cranes.
- Technological advancements, including automation and IoT integration, will enhance operational efficiency.
- Growing emphasis on sustainable and eco-friendly forestry practices will influence crane design and adoption.
- Multi-purpose and modular cranes will gain popularity due to flexibility and cost efficiency.
- Emerging markets in Asia Pacific, Latin America, and Africa will offer significant growth opportunities.
- Companies will continue investing in R&D to develop safer and more durable crane solutions.
- Increasing timber production and logging activities will sustain steady market expansion.
- Strategic partnerships, acquisitions, and collaborations will strengthen regional presence for key players.
- Focus on reducing operational costs and improving productivity will guide future product innovation.


