Market Overview:
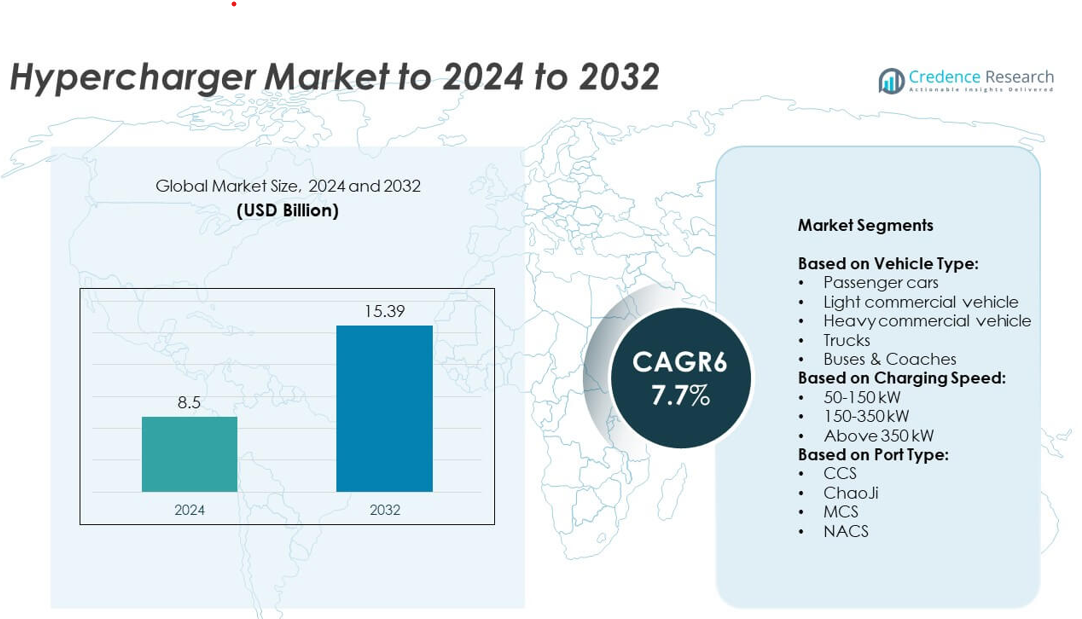
The Hypercharger Market size was valued at USD 8.5 Billion in 2024 and is anticipated to reach USD 15.39 Billion by 2032, at a CAGR of 7.7% during the forecast period.
| REPORT ATTRIBUTE |
DETAILS |
| Historical Period |
2020-2023 |
| Base Year |
2024 |
| Forecast Period |
2025-2032 |
| Hypercharger Market Size 2024 |
USD 8.5 Billion |
| Hypercharger Market, CAGR |
7.7% |
| Hypercharger Market Size 2032 |
USD 15.39 Billion |
The hypercharger market is shaped by leading players including Enel X, Tesla Inc., Tritium, ABB, Blink Charging Co., Alpitronic, Siemens, ChargePoint, EVgo, Delta Electronics, FLO, and Electrify America. These companies focus on advancing ultra-fast charging technologies, forming alliances with automakers, and expanding charging networks to address rising EV adoption across both passenger and commercial segments. Regional performance highlights North America as the market leader, holding 32% share in 2024, supported by strong government incentives and highway corridor projects. Europe followed with 29% share, driven by strict emission regulations and cross-border charging initiatives, while Asia Pacific captured 27%, led by China’s expansive EV infrastructure investments.
Market Insights
- The hypercharger market was valued at USD 8.5 Billion in 2024 and is projected to reach USD 15.39 Billion by 2032, growing at a CAGR of 7.7%.
- Rising adoption of electric vehicles, supported by government incentives and emission-reduction policies, is a key driver for hypercharger installations across passenger cars and commercial fleets.
- Market trends highlight the growing demand for 150–350 kW chargers, holding nearly 50% share in 2024, while chargers above 350 kW are gaining traction for heavy-duty vehicles.
- Competitive landscape is shaped by global players investing in fast-charging corridors, renewable energy integration, and smart grid solutions, with a focus on reducing charging times and enhancing interoperability.
- Regional analysis shows North America leading with 32% share, followed by Europe at 29% and Asia Pacific at 27%, while Latin America and Middle East & Africa together accounted for 12%, reflecting gradual adoption supported by infrastructure expansion.
Access crucial information at unmatched prices!
Request your sample report today & start making informed decisions powered by Credence Research Inc.!
Download Sample
Market Segmentation Analysis:
By Vehicle Type
Passenger cars accounted for the dominant share of the hypercharger market in 2024, holding over 45% of the total market. This leadership stems from rapid adoption of electric passenger vehicles supported by government incentives, expanding charging infrastructure, and increasing consumer demand for fast-charging options. Light commercial vehicles are growing steadily, driven by e-commerce logistics fleets, while heavy commercial vehicles, trucks, and buses are gaining traction due to urban electrification and emission regulations. Fleet operators increasingly prefer hyperchargers to minimize downtime, enhancing the appeal across both passenger and commercial segments.
- For instance, Hyundai Motor Group (including Hyundai and Kia) sold a combined total of 516,441 battery electric vehicles (BEVs) globally in 2023, according to sales data reported in early 2024.
By Charging Speed
The 150–350 kW segment dominated the hypercharger market in 2024 with nearly 50% share. This range offers an optimal balance of speed, cost, and compatibility across multiple EV categories, making it the preferred choice for operators and vehicle manufacturers. Chargers above 350 kW are emerging rapidly, targeting heavy-duty trucks and buses that require ultra-fast charging for long-haul operations. Meanwhile, the 50–150 kW range serves smaller passenger EVs in urban setups. Growing investments in highway charging corridors further strengthen the mid-range segment’s dominance.
- For instance, BP Pulse announced in November 2023 that it had deployed more than 3,000 public rapid and ultra-fast chargers in the UK, including units in the 150–300 kW range to support passenger and fleet vehicles.
By Port Type
CCS (Combined Charging System) held the largest share in 2024, commanding over 55% of the hypercharger market. Its dominance is attributed to widespread adoption across Europe and North America, standardization by leading automakers, and interoperability benefits for both passenger and commercial EVs. ChaoJi is expanding in Asia, particularly in China and Japan, while MCS (Megawatt Charging System) is emerging to serve heavy-duty trucks. NACS is gaining strong momentum in North America, following Tesla’s standardization agreements with several OEMs. CCS remains the dominant segment, backed by regulatory support and broad cross-industry adoption.
Market Overview
Rising EV Adoption and Government Incentives
The rapid increase in electric vehicle adoption is the leading growth driver for the hypercharger market. Governments worldwide are providing subsidies, tax benefits, and infrastructure funding to accelerate EV penetration. Passenger and commercial fleets benefit from favorable policies and zero-emission mandates, fueling demand for fast-charging networks. The rise of urban mobility and growing consumer preference for sustainable transport also support hypercharger installations. This policy-driven push, combined with declining battery costs, makes EVs more accessible, creating strong demand for high-capacity chargers globally.
- For instance, Mercedes-Benz reported sales of 222,600 battery electric vehicles in 2023, a 73% year-on-year increase, directly supporting demand for ultra-fast charging solutions.
Expansion of Charging Infrastructure Networks
The global expansion of public and private charging infrastructure is a major growth driver. Energy companies, charging operators, and automotive OEMs are investing in fast-charging corridors along highways and urban hubs. Partnerships between automakers and charging providers ensure compatibility and wider coverage. Commercial fleets, including logistics and ride-hailing, demand robust charging networks to reduce downtime. The integration of hyperchargers into existing fuel and service stations further accelerates accessibility. This widespread network expansion supports long-distance EV travel, reinforcing the dominance of hyperchargers in the market.
- For instance, Electrify America operated more than 850 charging stations with over 4,000 ultra-fast chargers across the U.S. by the end of 2023, most offering 150–350 kW outputs.
Technological Advancements in Charging Systems
Advancements in power electronics, thermal management, and smart grid integration serve as a key driver. Modern hyperchargers offer higher energy efficiency, dynamic load balancing, and AI-enabled predictive maintenance. Ultra-fast chargers above 350 kW are emerging for heavy-duty vehicles, reducing charging times to under 30 minutes. Integration with renewable energy and storage systems enhances sustainability. Standardization efforts, such as CCS and MCS, improve interoperability across regions. These innovations not only boost performance but also reduce operational costs, making hyperchargers more appealing to consumers and fleet operators.
Key Trends & Opportunities
Integration of Renewable Energy and Smart Grids
The integration of renewable energy with hypercharging stations presents a major trend and opportunity. Solar-powered and wind-supported chargers reduce reliance on traditional grids, lowering operational costs and emissions. Coupling hyperchargers with energy storage solutions enables peak load management and uninterrupted service. Smart grid-enabled systems allow real-time monitoring, dynamic pricing, and demand response. These integrations make hypercharging infrastructure more sustainable, aligning with global decarbonization targets. Growing investments in clean energy infrastructure support this trend, opening long-term opportunities for eco-friendly charging networks.
- For instance, TotalEnergies has pursued a large-scale deployment of electric vehicle charging infrastructure in Europe, winning several contracts in 2023 to expand its network. In October 2023, the company announced it had installed over 1,000 high-power chargers (HPC) across more than 180 service stations in France.
Emergence of Fleet Electrification
Fleet electrification across logistics, public transport, and ride-hailing services creates strong opportunities for hypercharger demand. Operators require reliable, high-speed charging to ensure vehicle uptime and operational efficiency. Governments are pushing electrification of buses, trucks, and delivery fleets under emission-reduction targets, accelerating infrastructure deployment. Dedicated depot charging hubs with hypercharger installations are increasingly adopted to serve large fleets. This trend boosts demand in both urban and intercity applications, creating consistent revenue streams for charging providers. Fleet-focused hypercharging infrastructure will remain a key opportunity segment.
- For instance, Amazon had deployed more than 10,000 custom Rivian electric delivery vans across the U.S. by October 2023.
Key Challenges
High Capital and Installation Costs
One of the main challenges in the hypercharger market is the high upfront cost of equipment and installation. Ultra-fast charging units require significant investment in grid upgrades, land, and power electronics. These costs often limit adoption in developing regions where capital constraints persist. Operators face longer payback periods compared to slower chargers, impacting profitability. Although subsidies and public-private partnerships mitigate expenses, financial barriers remain substantial. The challenge of balancing affordability with advanced technology slows large-scale deployment in price-sensitive markets.
Grid Capacity and Infrastructure Constraints
Limited grid capacity and infrastructure readiness pose another critical challenge. Hyperchargers demand high power loads that strain existing distribution networks, especially in urban centers. Many regions lack the robust grid infrastructure required to support widespread ultra-fast charging. Delays in permits, transformer upgrades, and utility coordination further hinder deployment. Without significant investments in power infrastructure and smart grid solutions, large-scale adoption of hyperchargers faces bottlenecks. This challenge highlights the need for coordinated efforts between utilities, governments, and charging providers to ensure reliable scalability.
Regional Analysis
North America
North America accounted for 32% of the hypercharger market in 2024, driven by strong EV adoption and supportive infrastructure funding. The United States leads with federal and state incentives promoting public charging networks, while Canada advances clean mobility targets. Growing demand for ultra-fast chargers along highways supports long-distance EV travel, particularly for passenger cars and light commercial vehicles. Partnerships between automakers and charging providers strengthen accessibility and interoperability. Fleet electrification in logistics and public transport further accelerates hypercharger installations. The region’s established power infrastructure and policy push ensure continued growth across both urban and intercity corridors.
Europe
Europe captured 29% of the hypercharger market in 2024, supported by strict emission regulations and ambitious EV targets. Countries like Germany, France, and the UK are expanding hypercharging corridors, ensuring cross-border compatibility through CCS adoption. Strong government backing under the European Green Deal drives investments in charging infrastructure. Passenger car adoption dominates, but commercial fleets and buses are rapidly gaining traction under clean transport mandates. Public-private collaborations with utility companies accelerate deployment. Urban electrification projects, along with incentives for fleet operators, further boost demand. Europe remains a leader in standardization and large-scale infrastructure rollouts for sustainable transportation
Asia Pacific
Asia Pacific held 27% of the hypercharger market in 2024, fueled by rapid EV penetration in China, Japan, and South Korea. China remains the largest contributor with expansive charging networks and strong policy support, while Japan and South Korea advance high-power standards such as ChaoJi. Passenger cars dominate the market share, but heavy commercial vehicles and buses drive increasing demand for ultra-fast chargers. Government-led clean mobility programs and local OEM investments in infrastructure strengthen growth. Expanding highway charging corridors and urban smart city initiatives further boost adoption, making Asia Pacific a key hub for hypercharger expansion.
Latin America
Latin America accounted for 7% of the hypercharger market in 2024, with Brazil and Mexico leading infrastructure growth. Government incentives for clean mobility and urban electrification are gradually supporting EV adoption. Passenger vehicles dominate demand, though commercial fleets and public buses are beginning to show interest in fast-charging solutions. Infrastructure limitations and high installation costs present challenges, but growing partnerships with international charging providers support gradual expansion. Private sector investments in highway corridors enhance accessibility. Despite current challenges, increasing policy focus on sustainable transport indicates strong long-term potential for hypercharger deployment in the region.
Middle East and Africa
The Middle East and Africa represented 5% of the hypercharger market in 2024, with growth centered in the UAE, Saudi Arabia, and South Africa. Investments in smart city projects and clean energy initiatives drive charging infrastructure development. Passenger vehicles account for the majority of demand, while luxury EV adoption in Gulf countries supports ultra-fast charging installations. Limited grid capacity and high capital costs slow widespread adoption, particularly in Africa. However, government-backed sustainability programs and partnerships with global charging operators encourage progress. The region’s focus on diversifying energy use and reducing emissions ensures steady future hypercharger growth.
Market Segmentations:
By Vehicle Type:
- Passenger cars
- Light commercial vehicle
- Heavy commercial vehicle
- Trucks
- Buses & Coaches
By Charging Speed:
- 50-150 kW
- 150-350 kW
- Above 350 kW
By Port Type:
By Geography:
- orth America
- Europe
- Germany
- France
- U.K.
- Italy
- Spain
- Rest of Europe
- Asia Pacific
- China
- Japan
- India
- South Korea
- South-east Asia
- Rest of Asia Pacific
- Latin America
- Brazil
- Argentina
- Rest of Latin America
- Middle East & Africa
- GCC Countries
- South Africa
- Rest of the Middle East and Africa
Competitive Landscape
Competitive landscape of the hypercharger market features leading players such as Enel X (Italy), Tesla Inc. (U.S.), Tritium (Australia), ABB (Switzerland), Blink Charging Co. (U.S.), Alpitronic (Italy), Siemens, ChargePoint (U.S.), EVgo (U.S.), Delta Electronics, FLO (Canada), and Electrify America (U.S.). These companies are actively engaged in developing advanced charging technologies, expanding fast-charging corridors, and forming strategic alliances with automakers and energy providers. The market is characterized by continuous investment in high-capacity charging solutions, integration with renewable energy sources, and the deployment of smart grid-enabled systems. Competitive strategies often include public-private partnerships, geographic expansion, and interoperability initiatives to strengthen customer adoption. With rising demand from both passenger and commercial vehicle segments, market participants focus on reducing charging times, lowering installation costs, and ensuring wide accessibility. Innovation in ultra-fast chargers above 350 kW and digital services for fleet management also remain central to enhancing competitiveness in this rapidly evolving sector.
Shape Your Report to Specific Countries or Regions & Enjoy 30% Off!
Key Player Analysis
- Enel X (Italy)
- Tesla Inc. (U.S.)
- Tritium (Australia)
- ABB (Switzerland)
- Blink Charging Co. (U.S.)
- Alpitronic (Italy)
- Siemens
- ChargePoint (U.S.)
- EVgo (U.S.)
- Delta Electronics
- FLO (Canada)
- Electrify America (U.S.)
Recent Developments
- In 2024, Delta Electronics Introduced the UFC 500, a 500 kW ultra-fast DC charger, in March, designed to charge heavy-duty commercial EVs like e-buses and e-trucks.
- In 2024, Siemens Acquired Heliox in January, significantly bolstering its DC fast-charging portfolio with a range of solutions from 40 kW to megawatt charging.
- In 2023, ABB E-mobility Continued to supply its Terra 360 all-in-one charging station, which it had launched in 2021
Report Coverage
The research report offers an in-depth analysis based on Vehicle Type, Charging Speed, Port Type and Geography. It details leading market players, providing an overview of their business, product offerings, investments, revenue streams, and key applications. Additionally, the report includes insights into the competitive environment, SWOT analysis, current market trends, as well as the primary drivers and constraints. Furthermore, it discusses various factors that have driven market expansion in recent years. The report also explores market dynamics, regulatory scenarios, and technological advancements that are shaping the industry. It assesses the impact of external factors and global economic changes on market growth. Lastly, it provides strategic recommendations for new entrants and established companies to navigate the complexities of the market.
Future Outlook
- The hypercharger market will expand with rising global EV adoption across passenger and commercial fleets.
- Government policies and emission targets will continue to drive large-scale infrastructure investments.
- Ultra-fast chargers above 350 kW will gain traction to support heavy-duty vehicles.
- Integration of renewable energy and storage systems will enhance sustainable hypercharging solutions.
- Fleet electrification in logistics and public transport will create consistent demand for depot charging hubs.
- Standardization of charging ports will improve interoperability and accelerate cross-regional adoption.
- Smart grid integration will enable dynamic load balancing and reduce grid strain.
- Public-private partnerships will play a critical role in expanding highway and urban charging networks.
- Emerging markets will adopt hyperchargers gradually as costs decline and infrastructure improves.
- Technological innovation will shorten charging times and improve operational efficiency for hypercharger operators.


