Cloud FinOps Market By Component (Solutions, Services); By Deployment (Public, Private, Hybrid); By Application (Cost Management & Optimization, Resource Allocation & Planning, Billing & Chargeback, Others); By End Use (IT & Telecom, BFSI, Retail, Healthcare, Government) – Growth, Share, Opportunities & Competitive Analysis, 2024 – 2032

Report ID: 160702 | Report Format : Excel, PDF

Market Overview

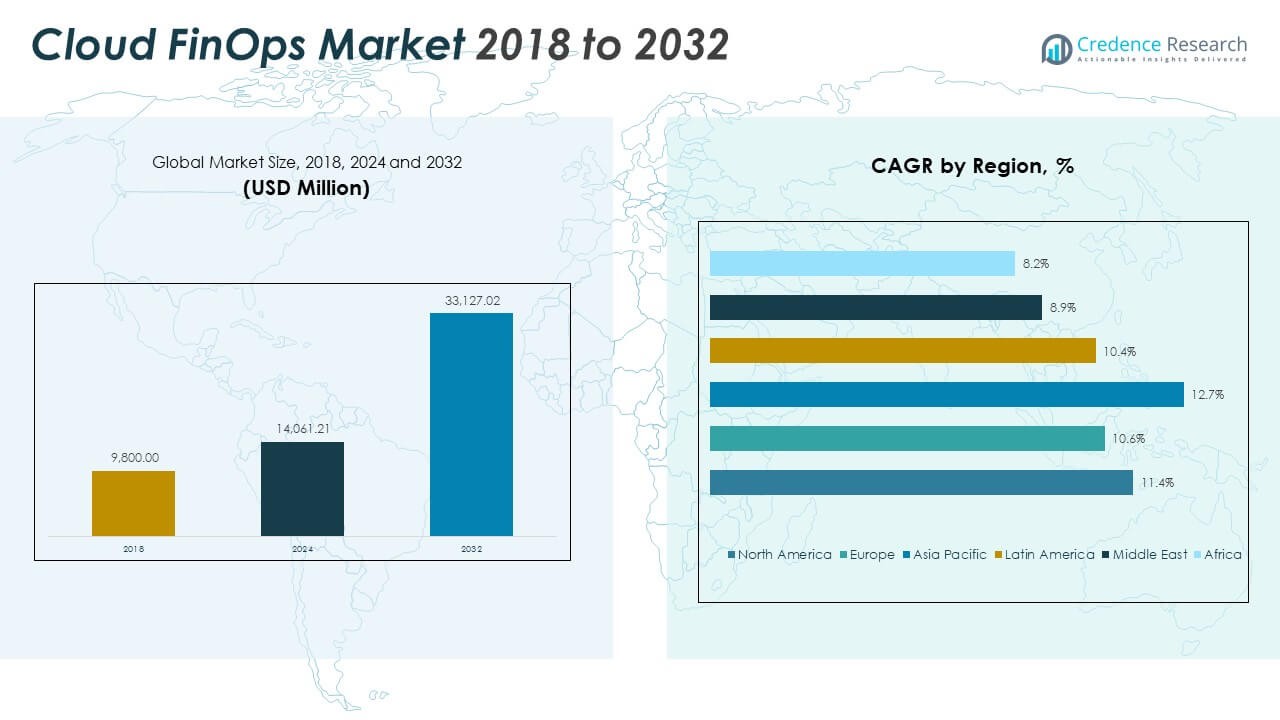
Cloud FinOps Market size was valued USD 12181.82 million in 2024 and is anticipated to reach USD 27671.34 million by 2032, at a CAGR of 10.8% during the forecast period.

REPORT ATTRIBUTE DETAILS
Historical Period 2020-2023
Base Year 2024
Forecast Period 2025-2032
Cloud FinOps Market Size 2024 USD 12181.82 Million
Cloud FinOps Market, CAGR 10.8%
Cloud FinOps Market Size 2032 USD 27671.34 Million


The Cloud FinOps market is led by major technology providers such as AWS, Microsoft, Google, IBM, Oracle, VMware, SAP, ServiceNow, HCL Technologies, and Flexera, offering automated cost monitoring, real-time visibility, and multi-cloud optimization tools. These companies focus on AI-based forecasting, Kubernetes cost tracking, and policy-driven governance to reduce cloud wastage. North America remains the leading region with a 38% market share, supported by high enterprise cloud spending and strong adoption of multi-cloud architectures. Europe and Asia-Pacific follow as digital transformation, hybrid deployments, and compliance-driven cost governance expand the customer base for global and regional FinOps providers.

Access crucial information at unmatched prices!

Request your sample report today & start making informed decisions powered by Credence Research Inc.!

Download Sample

Market Insights

  • The Cloud FinOps market was valued at USD 12,181.82 million in 2024 and is expected to reach USD 27,671.34 million by 2032, growing at a CAGR of 10.8%.
  • Rising multi-cloud adoption and the need for real-time cost visibility drive demand for automated FinOps platforms, especially in North America, which holds a 38% share, followed by Europe at 27% and Asia-Pacific at 22%.
  • Trends include AI-driven cost forecasting, container and Kubernetes cost mapping, and self-service tools for SMEs, enabling predictive budget planning and workload optimization.
  • The competitive landscape is led by AWS, Microsoft, Google, IBM, Oracle, VMware, SAP, ServiceNow, HCL Technologies, and Flexera, focusing on multi-cloud integrations, automation, and managed FinOps services to capture enterprise and SMB segments.
  • Challenges include complex vendor pricing models, lack of unified cost ownership between finance and engineering teams, and governance issues in hybrid and multi-cloud deployments, restraining smooth adoption.

Cloud FinOps Market Size

Market Segmentation Analysis:

By Component

By Component, Solutions hold a dominant 68% share in the Cloud FinOps Market due to widespread adoption of automated cost optimization and real-time visibility platforms. Enterprises increasingly deploy analytics-driven tools to monitor multi-cloud spending, detect idle resources, and forecast budgets with higher precision. AI-based recommendations and intelligent workload allocation enhance efficiency for large IT operations managing complex infrastructure. Services account for the remaining 32% share and continue to expand as organizations seek consulting, training, and managed support to strengthen FinOps maturity, policy governance, and workflow integration.

  • For instance, VMware’s Cloud Health platform helps enterprises optimize cloud spending and enforce governance across AWS, Azure, and Google Cloud with automated budgeting and policy-driven cost controls.

By Deployment

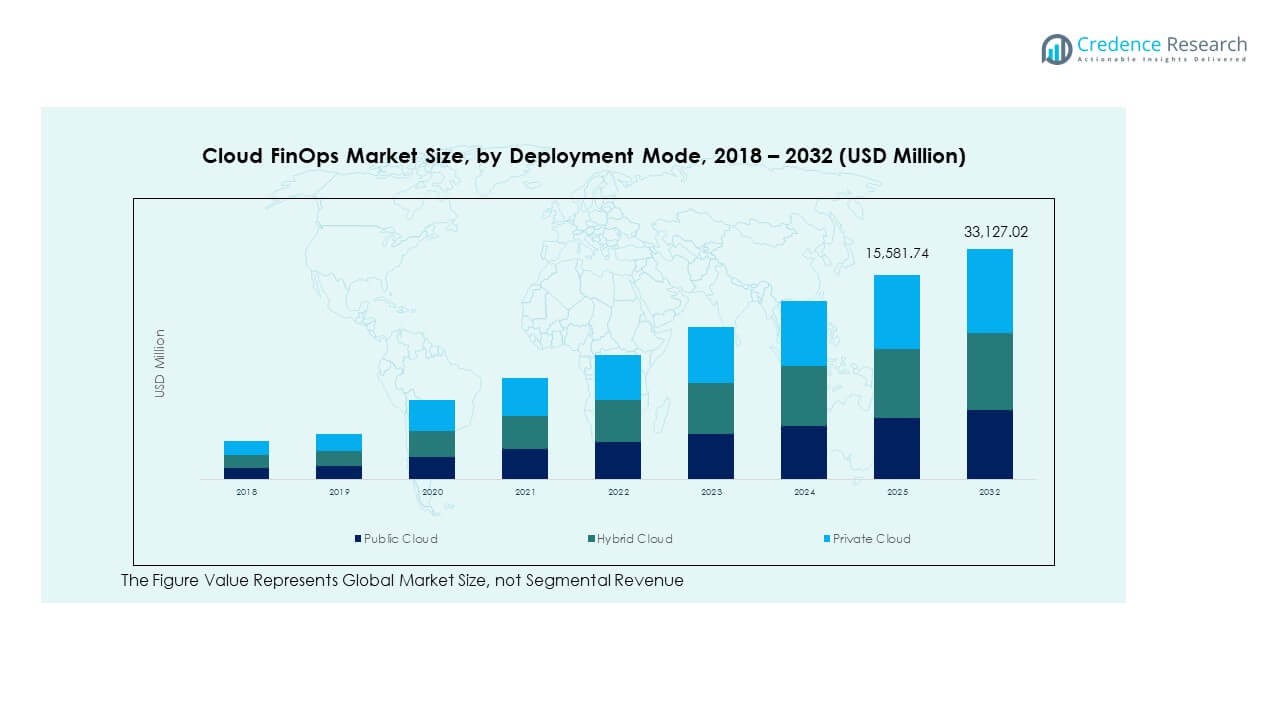
Public cloud deployment holds a dominant 61% share in the Cloud FinOps Market, driven by rapid adoption among enterprises and digital-first businesses. Organizations use FinOps tools to manage usage surges, analyze billing data, and optimize resources across major providers such as AWS, Azure, and Google Cloud. Public platforms offer scalability, flexible pricing, and seamless integration with automation tools. Private and hybrid deployments account for the remaining 39% share, growing steadily as sectors like banking, healthcare, and government emphasize governance, compliance, and secure cost management within controlled environments.

  • For instance, Harness integrates financial intelligence directly into CI/CD pipelines, enabling automated resource scaling and proactive spending control across public cloud environments.

By Organization Size

Large enterprises hold a dominant 67% share in the Cloud FinOps Market, driven by extensive cloud usage, complex workloads, and

multi-cloud adoption. These organizations deploy FinOps platforms to manage thousands of cloud instances, enforce cost accountability, and automate optimization through AI and policy-driven controls. Real-time chargeback and unit economics models enhance financial visibility across departments. Small and medium enterprises account for the remaining 33% share, expanding steadily as they embrace simplified, automated cost management tools to control expenses, reduce waste, and improve budgeting accuracy while scaling operations.

Key Growth Driver

Rising Multi-Cloud Adoption and Cost Visibility Needs

Multi-cloud adoption grows as enterprises use services from AWS, Azure, Google Cloud, and private data centers. This creates large, complex billing records with thousands of cost items across compute, storage, networking, and SaaS workloads. Cloud FinOps platforms help companies track every expense in one window and prevent budget leakage. Real-time monitoring, idle resource detection, and policy-based alerts improve financial control. Finance and engineering teams also gain shared visibility, which reduces disputes and improves cost ownership. As companies scale applications and migrate legacy systems, demand for unified cost transparency continues to rise, making multi-cloud cost governance a major driver for Cloud FinOps growth.

  • For instance, Microsoft Azure’s FinOps alerts automate idle resource detection by continuously scanning environments and sending notifications to administrators, helping enterprises contain cloud costs and prevent budget leakage.

Increasing Shift Toward Automation and Real-Time Optimization

Enterprises seek automated cost control instead of manual cloud billing checks, which are slow and error-prone. Cloud FinOps tools use automation to shut down unused workloads, optimize storage tiers, and pick cost-efficient compute options. FinOps automation also provides instant budget alerts, cost forecasting, and chargeback allocation across teams. Real-time dashboards replace monthly cost reviews, allowing faster action and fewer surprise bills. As workloads scale through AI, analytics, and container platforms like Kubernetes, demand for automated cost optimization rises. This shift from reactive cost review to proactive cost control makes intelligent automation a key growth force in the Cloud FinOps market.

  •  For instance, Azure FinOps alerts automate cost control by shutting down idle resources and sending real-time budget alerts, enabling proactive cloud spending management.

Growing Cloud Migration in Regulated and Traditional Industries

Banks, hospitals, telecom providers, and government agencies move to the cloud for digital transformation, but they face strict compliance and budgeting rules. FinOps solutions help these organizations track every cloud dollar with audit trails, role-based access, and fixed budgeting workflows. Cost governance tools also support internal approvals and controlled spending for sensitive workloads. Accurate chargeback systems help divide cloud bills across departments, improving transparency for stakeholders and leadership. As regulated industries modernize legacy systems and expand cloud-native development, Cloud FinOps becomes essential to avoid wastage, ensure compliance, and maintain financial discipline.

  • For instance, leading telecom providers utilize cloud cost governance tools like AWS Cost Explorer and Azure Cost Management to enforce budget controls, automate alerts, and enhance accountability across departments, which helps manage sensitive workloads effectively in regulated environments.

Key Trends and Opportunities

Gen AI and Predictive Forecasting for Cloud Spend

Cloud FinOps tools now include AI-based forecasting that predicts future usage and cost patterns. AI models study past consumption, seasonal usage spikes, and workload growth to improve budgeting accuracy. Predictive analytics also guide teams on when to switch pricing models, buy reservations, or decommission unused assets. This reduces financial risk for enterprises running large data, AI, and container workloads. Vendors offering AI-powered insights, anomaly detection, and price simulation gain a strong opportunity as companies shift toward smart cost planning instead of simple cost reporting.

  • For instance, Predictive analytics in FinOps tools help organizations optimize cloud budgets by advising when to switch pricing models, purchase reservations, or decommission unused resources, reducing financial risk.

FinOps Adoption in SMBs Through Low-Cost and Self-Service Tools

Small and mid-sized businesses increasingly adopt cloud platforms but often lack dedicated cloud finance teams. Low-cost, easy-to-deploy FinOps tools create a strong opportunity in this segment. Simple dashboards, automated alerts, and guided workflows help small teams control spending without complex IT setups. Many vendors introduce subscription-based pricing and plug-and-play integrations for AWS, Azure, and SaaS billing. As SMB cloud workloads grow through ecommerce, CRM, analytics, and digital services, demand for affordable cost governance tools continues to rise.

  • For instance, Finout, a leading FinOps platform that offers small and midsize businesses an integrated cloud cost management solution, with features like automated financial planning and multi-cloud cost visibility, supporting providers such as AWS, Azure, and GCP.

Key Challenges

Growing Focus on Kubernetes and Container Cost Visibility

Container platforms and Kubernetes clusters add new layers of cloud complexity. Costs get distributed across pods, microservices, and shared nodes, which makes billing hard to track. FinOps tools now focus on container cost mapping, workload efficiency scoring, and rightsizing recommendations. Vendors that integrate with Kubernetes monitoring and service meshes gain strong advantage. As container adoption spreads across DevOps teams, deeper container cost visibility becomes a major FinOps opportunity.

Lack of Unified Cost Ownership Between Finance and Engineering Teams

Many organizations struggle because finance teams manage budgets while engineering controls infrastructure decisions. Without shared responsibility, cloud optimization plans move slowly and cost leaks continue. Some teams focus only on performance, while others focus only on cost, creating conflicts. Successful FinOps requires cultural alignment, real-time transparency, and common KPIs. Many enterprises still work with monthly reports instead of real-time monitoring, which delays cost actions and increases wastage. Adoption slows when internal teams do not cooperate or lack FinOps training.

Complex Billing Structures and Vendor Pricing Models

Public cloud providers offer hundreds of pricing options, discounts, storage tiers, reserved instances, and data transfer charges. Many enterprises struggle to understand these models, which results in surprise bills and hidden charges. Multi-cloud environments add more complexity, as each vendor uses different billing formats. Without accurate tagging, usage mapping, and governance rules, companies fail to see where spending is rising. This complexity slows FinOps adoption, especially for companies without advanced automation or skilled cloud architects.

Regional Analysis

North America

North America holds the dominant share of 38% in the Cloud FinOps market, driven by high cloud spending across technology, banking, e-commerce, and telecom enterprises. Companies in the U.S. and Canada invest heavily in multi-cloud architectures and AI-driven cost optimization, creating strong demand for automated FinOps platforms. Large enterprises use real-time dashboards, budgeting controls, and chargeback models to manage complex billing across AWS, Azure, and Google Cloud. Strong presence of major vendors and mature cloud governance practices further support adoption. Growing deployment of Kubernetes and container-based workloads also strengthens platform requirements for accurate cost visibility and predictive forecasting.

Europe

Europe accounts for 27% of the Cloud FinOps market, supported by cloud modernization and strict regulatory frameworks driving financial accountability. Enterprises in Germany, the U.K., and France deploy FinOps tools to ensure cost transparency, data compliance, and budget audit trails. Hybrid cloud environments and public sector digital transformation contribute to consistent adoption. Companies focus on optimizing cloud contracts, controlling storage waste, and managing multi-region deployments. Increasing demand for localized data centers and sovereign cloud platforms also expands service opportunities. As European enterprises scale AI and analytics workloads, demand for automated governance and real-time cost intelligence continues to rise.

Asia-Pacific

Asia-Pacific holds a 22% share of the Cloud FinOps market, fueled by rapid cloud adoption across India, China, Japan, and Southeast Asia. Enterprises migrate core workloads, e-commerce platforms, and digital banking systems to cloud infrastructure, increasing cost governance needs. SMEs adopt low-cost FinOps tools to monitor usage spikes and prevent budget overruns. The region sees growing multi-cloud and container deployments, especially in IT services and telecom. Rising investment from hyperscale cloud providers and strong digital-first business growth accelerate platform adoption. As multi-cloud billing complexity grows, organizations focus on automation, anomaly detection, and rightsizing recommendations.

Latin America

Latin America accounts for 7% of the Cloud FinOps market, driven by expanding digital transformation in banking, retail, and telecom sectors. Enterprises adopt FinOps solutions to control operational cloud expenses and improve financial reporting. Brazil and Mexico lead adoption, supported by cloud migration initiatives and rising public cloud workloads. Organizations shift from manual cost tracking to automated dashboards and policy-based usage controls. Growing adoption of SaaS and IT modernization accelerates demand, while cost-optimization remains a priority for budget-sensitive enterprises. As cloud maturity increases, the region sees stronger interest in forecasting, chargeback models, and multi-cloud billing visibility.

Middle East & Africa

The Middle East & Africa holds a 6% share of the Cloud FinOps market, supported by increasing cloud spending across government, energy, financial services, and telecom industries. Countries such as the UAE, Saudi Arabia, and South Africa adopt FinOps solutions to manage cloud modernization and optimize public sector digital programs. Enterprises focus on budget compliance, real-time monitoring, and automated cost controls to avoid financial inefficiencies. Growing data center investments and partnerships with global cloud providers support adoption. As multi-cloud and hybrid environments expand, organizations rely on FinOps platforms for accurate cost allocation and financial accountability.

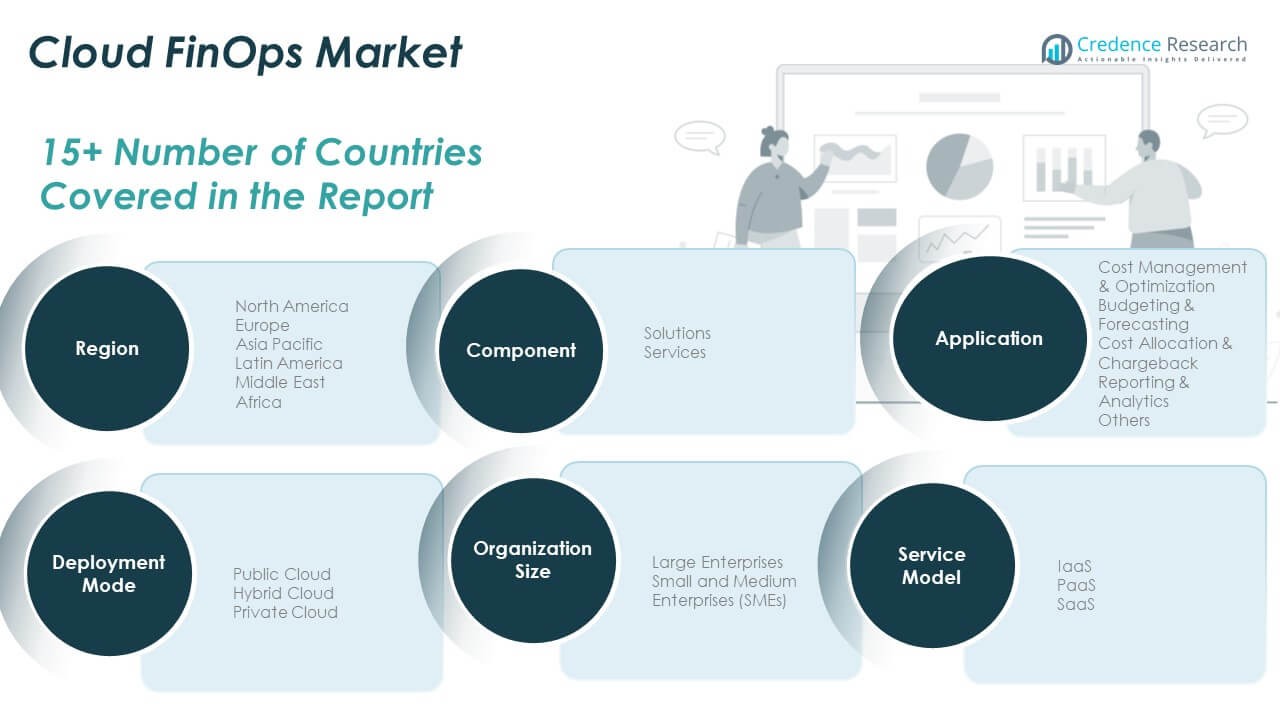
Market Segmentations:

By Component

  • Solutions
  • Services

By Deployment

  • Public
  • Private
  • Hybrid

By Application

  • Cost management & optimization
  • Resource allocation & planning
  • Billing & chargeback
  • Others

By End Use

  • IT & telecom
  • BFSI
  • Retail
  • Healthcare
  • Government

By Geography

  • North America
    • U.S.
    • Canada
    • Mexico
  • Europe
    • Germany
    • France
    • U.K.
    • Italy
    • Spain
    • Rest of Europe
  • Asia Pacific
    • China
    • Japan
    • India
    • South Korea
    • South-east Asia
    • Rest of Asia Pacific
  • Latin America
    • Brazil
    • Argentina
    • Rest of Latin America
  • Middle East & Africa
    • GCC Countries
    • South Africa
    • Rest of the Middle East and Africa

Competitive Landscape

The Cloud FinOps market features strong competition among global cloud providers, FinOps software vendors, and managed service firms delivering real-time cost visibility, automation, and financial governance. Leading players focus on AI-driven analytics, multi-cloud billing integration, and automated policy enforcement to reduce wastage and improve unit economics for enterprises. Vendors enhance dashboards, anomaly detection, and chargeback modules to support finance and engineering collaboration. Partnerships with AWS, Microsoft Azure, and Google Cloud increase product reach and ensure deeper integration with native billing systems. Companies expand offerings for Kubernetes cost mapping, container rightsizing, and forecasting tools as DevOps adoption grows. Service providers deliver consulting, training, and managed FinOps operations for enterprises lacking in-house expertise. Many vendors compete by offering self-service platforms for SMBs and scalable enterprise-grade solutions for large cloud users. Product innovation, strong data security, regional compliance, and flexible pricing models remain key competitive strengths in the market.

Key Player Analysis

  • IBM
  • ServiceNow
  • Oracle
  • Microsoft
  • VMware
  • SAP
  • AWS
  • HCL Technologies
  • Flexera
  • Google

Recent Developments

  • In November 2025, Apptio, an IBM company, unveiled next-generation FinOps solutions under IBM Cloudability and IBM Kubecost, designed for AI workloads. The update added Cloudability Governance integration with HashiCorp Terraform, and IBM Kubecost 3.0, offering automated container right-sizing, GPU monitoring via NVIDIA DCGM exporter, and advanced node group insights.
  • In October 2025, TD SYNNEX (NYSE: SNX) and IBM jointly launched the Global FinOps Practice powered by IBM Cloudability, becoming the first global technology distributor to offer a complete end-to-end FinOps framework.
  • In June 2025, Amazon Web Services introduced expanded FOCUS™ support and new AI-driven capabilities at FinOps X 2025. The update included Cost Optimization Hub integration with Amazon Q Developer and enhanced Aurora I/O Optimized Recommendations through AWS Compute Optimizer, streamlining cost analysis across millions of resources.

Shape Your Report to Specific Countries or Regions & Enjoy 30% Off!

Report Coverage

The research report offers an in-depth analysis based on Component, Deployment, Application, End-Use and Geography. It details leading market players, providing an overview of their business, product offerings, investments, revenue streams, and key applications. Additionally, the report includes insights into the competitive environment, SWOT analysis, current market trends, as well as the primary drivers and constraints. Furthermore, it discusses various factors that have driven market expansion in recent years. The report also explores market dynamics, regulatory scenarios, and technological advancements that are shaping the industry. It assesses the impact of external factors and global economic changes on market growth. Lastly, it provides strategic recommendations for new entrants and established companies to navigate the complexities of the market.

Future Outlook

  1. Adoption of cloud cost automation tools will accelerate across enterprises and SMBs.
  2. Usage of AI‑powered forecasting will become a standard component in FinOps platforms.
  3. Multi‑cloud and hybrid environments will drive increased demand for unified cost visibility solutions.
  4. Container and Kubernetes cost optimization will become a core feature in FinOps offerings.
  5. Finance and engineering teams will collaborate more closely through shared dashboards and governance workflows.
  6. SMBs will access cheaper, self‑service FinOps tools tailored to their needs and budgets.
  7. Regional cloud regulation and data sovereignty will increase demand for localized FinOps services.
  8. Vendors will partner with major cloud providers to offer seamless billing integration and workflow automation.
  9. Chargeback and showback models will expand to include more granular metrics, such as cost per microservice.
  10. Adoption of FinOps will shift from reactive cost control toward proactive financial optimization across the cloud lifecycle.

1. Introduction
1.1. Report Description
1.2. Purpose of the Report
1.3. USP & Key Offerings
1.4. Key Benefits for Stakeholders
1.5. Target Audience
1.6. Report Scope
1.7. Regional Scope

2. Scope and Methodology
2.1. Objectives of the Study
2.2. Stakeholders
2.3. Data Sources
2.3.1. Primary Sources
2.3.2. Secondary Sources
2.4. Market Estimation
2.4.1. Bottom-Up Approach
2.4.2. Top-Down Approach
2.5. Forecasting Methodology

3. Executive Summary

4. Introduction
4.1. Overview
4.2. Key Industry Trends

5. Global Cloud FinOps Market
5.1. Market Overview
5.2. Market Performance
5.3. Impact of COVID-19
5.4. Market Forecast

6. Market Breakup By Component
6.1. Solutions
6.1.1. Market Trends
6.1.2. Market Forecast
6.1.3. Revenue Share
6.1.4. Revenue Growth Opportunity
6.2. Services
6.2.1. Market Trends
6.2.2. Market Forecast
6.2.3. Revenue Share
6.2.4. Revenue Growth Opportunity

7. Market Breakup By Deployment
7.1. Public
7.1.1. Market Trends
7.1.2. Market Forecast
7.1.3. Revenue Share
7.1.4. Revenue Growth Opportunity
7.2. Private
7.2.1. Market Trends
7.2.2. Market Forecast
7.2.3. Revenue Share
7.2.4. Revenue Growth Opportunity
7.3. Hybrid
7.3.1. Market Trends
7.3.2. Market Forecast
7.3.3. Revenue Share
7.3.4. Revenue Growth Opportunity

8. Market Breakup By Application
8.1. Cost Management & Optimization
8.1.1. Market Trends
8.1.2. Market Forecast
8.1.3. Revenue Share
8.1.4. Revenue Growth Opportunity
8.2. Resource Allocation & Planning
8.2.1. Market Trends
8.2.2. Market Forecast
8.2.3. Revenue Share
8.2.4. Revenue Growth Opportunity
8.3. Billing & Chargeback
8.3.1. Market Trends
8.3.2. Market Forecast
8.3.3. Revenue Share
8.3.4. Revenue Growth Opportunity
8.4. Others
8.4.1. Market Trends
8.4.2. Market Forecast
8.4.3. Revenue Share
8.4.4. Revenue Growth Opportunity

9. Market Breakup By End Use
9.1. IT & Telecom
9.1.1. Market Trends
9.1.2. Market Forecast
9.1.3. Revenue Share
9.1.4. Revenue Growth Opportunity
9.2. BFSI
9.2.1. Market Trends
9.2.2. Market Forecast
9.2.3. Revenue Share
9.2.4. Revenue Growth Opportunity
9.3. Retail
9.3.1. Market Trends
9.3.2. Market Forecast
9.3.3. Revenue Share
9.3.4. Revenue Growth Opportunity
9.4. Healthcare
9.4.1. Market Trends
9.4.2. Market Forecast
9.4.3. Revenue Share
9.4.4. Revenue Growth Opportunity
9.5. Government
9.5.1. Market Trends
9.5.2. Market Forecast
9.5.3. Revenue Share
9.5.4. Revenue Growth Opportunity

10. Market Breakup by Region
10.1. North America
10.1.1. United States
10.1.1.1. Market Trends
10.1.1.2. Market Forecast
10.1.2. Canada
10.1.2.1. Market Trends
10.1.2.2. Market Forecast
10.2. Asia-Pacific
10.2.1. China
10.2.2. Japan
10.2.3. India
10.2.4. South Korea
10.2.5. Australia
10.2.6. Indonesia
10.2.7. Others
10.3. Europe
10.3.1. Germany
10.3.2. France
10.3.3. United Kingdom
10.3.4. Italy
10.3.5. Spain
10.3.6. Russia
10.3.7. Others
10.4. Latin America
10.4.1. Brazil
10.4.2. Mexico
10.4.3. Others
10.5. Middle East and Africa
10.5.1. Market Trends
10.5.2. Market Breakup by Country
10.5.3. Market Forecast

11. SWOT Analysis
11.1. Overview
11.2. Strengths
11.3. Weaknesses
11.4. Opportunities
11.5. Threats

12. Value Chain Analysis

13. Porters Five Forces Analysis
13.1. Overview
13.2. Bargaining Power of Buyers
13.3. Bargaining Power of Suppliers
13.4. Degree of Competition
13.5. Threat of New Entrants
13.6. Threat of Substitutes

14. Price Analysis

15. Competitive Landscape
15.1. Market Structure
15.2. Key Players
15.3. Profiles of Key Players
15.3.1. IBM
15.3.1.1. Company Overview
15.3.1.2. Product Portfolio
15.3.1.3. Financials
15.3.1.4. SWOT Analysis
15.3.2. ServiceNow
15.3.2.1. Company Overview
15.3.2.2. Product Portfolio
15.3.2.3. Financials
15.3.2.4. SWOT Analysis
15.3.3. Oracle
15.3.3.1. Company Overview
15.3.3.2. Product Portfolio
15.3.3.3. Financials
15.3.3.4. SWOT Analysis
15.3.4. Microsoft
15.3.4.1. Company Overview
15.3.4.2. Product Portfolio
15.3.4.3. Financials
15.3.4.4. SWOT Analysis
15.3.5. VMware
15.3.5.1. Company Overview
15.3.5.2. Product Portfolio
15.3.5.3. Financials
15.3.5.4. SWOT Analysis
15.3.6. SAP
15.3.6.1. Company Overview
15.3.6.2. Product Portfolio
15.3.6.3. Financials
15.3.6.4. SWOT Analysis
15.3.7. AWS
15.3.7.1. Company Overview
15.3.7.2. Product Portfolio
15.3.7.3. Financials
15.3.7.4. SWOT Analysis
15.3.8. HCL Technologies
15.3.8.1. Company Overview
15.3.8.2. Product Portfolio
15.3.8.3. Financials
15.3.8.4. SWOT Analysis
15.3.9. Flexera
15.3.9.1. Company Overview
15.3.9.2. Product Portfolio
15.3.9.3. Financials
15.3.9.4. SWOT Analysis
15.3.10. Google
15.3.10.1. Company Overview
15.3.10.2. Product Portfolio
15.3.10.3. Financials
15.3.10.4. SWOT Analysis

16. Research Methodology

Request Free Sample

We prioritize the confidentiality and security of your data. Our promise: your information remains private.

Ready to Transform Data into Decisions?

Request Your Sample Report and Start Your Journey of Informed Choices


Providing the strategic compass for industry titans.

cr-clients-logos

Frequently Asked Questions:

What is the current market size for Cloud FinOps market, and what is its projected size in 2032?

The Cloud FinOps market was valued at USD 12,181.82 million in 2024 and is projected to reach USD 27,671.34 million by 2032.

At what Compound Annual Growth Rate is the Cloud FinOps market projected to grow between 2025 and 2032?

The market is expected to grow at a CAGR of 10.8% during the forecast period.

Which Cloud FinOps market segment held the largest share in 2024?

The Solutions segment dominated the market, driven by automated cost optimization and real-time visibility platforms.

What are the primary factors fueling the growth of the Cloud FinOps market?

Growth is fueled by multi-cloud adoption, need for cost visibility, AI-driven automation, container and Kubernetes cost optimization, and cloud migration in regulated industries.

Who are the leading companies in the Cloud FinOps market?

Key players include AWS, Microsoft, Google, IBM, Oracle, VMware, SAP, ServiceNow, HCL Technologies, and Flexera.

Which region commanded the largest share of the Cloud FinOps market in 2024?

North America led with a 38% share, followed by Europe at 27% and Asia-Pacific at 22%.

About Author

Sushant Phapale

Sushant Phapale

ICT & Automation Expert

Sushant is an expert in ICT, automation, and electronics with a passion for innovation and market trends.

View Profile

Related Reports

Cloud Encryption Software Market

Cloud Encryption Software Market size was valued USD 5,260.55 million in 2024 and is anticipated to reach USD 38,864.34 million by 2032, at a CAGR of 28.4% during the forecast period.

Cloud Database and DBaaS Market

Cloud Database And DBaaS Market size was valued at USD 18,136.36 million in 2024 and is anticipated to reach USD 61,540.01 million by 2032, at a CAGR of 16.5% during the forecast period.

Cloud Data Warehouse Market

Cloud Data Warehouse market size was valued USD 28,090.91 million in 2024 and is anticipated to reach USD 101,025.4 million by 2032, at a CAGR of 17.35% during the forecast period.

Cloud Data Center Market

Cloud Data Center Market size was valued USD 26672.73 million in 2024 and is anticipated to reach USD 55939.75 million by 2032, at a CAGR of 9.7% during the forecast period.

Cloud Computing In Oil And Gas Market

Cloud Computing in Oil and Gas Market size was valued at USD 11,363.64 million in 2024 and is anticipated to reach USD 24,182.38 million by 2032, growing at a CAGR of 9.9% during the forecast period.

Smart Signage Market

Smart Signage Market size was valued USD 33.19 billion in 2024 and is anticipated to reach USD 56.43 billion by 2032, at a CAGR of 6.86% during the forecast period.

Chatbots Market

Chatbot market size was valued USD 748.84 million in 2024 and is anticipated to reach USD 3532.96 million by 2032, at a CAGR of 21.4% during the forecast period.

Arborist Management System Market

The Arborist Management System Market size was valued at USD 2345.45 million in 2024 and is anticipated to reach USD 4531.32 million by 2032, at a CAGR of 8.58% during the forecast period.

Armored Cable Market

The Armored Cable Market size was valued at USD 43415.46 million in 2024 and is anticipated to reach USD 74595.84 million by 2032, at a CAGR of 7 % during the forecast period.

Social Trading Platform Market

Social trading platform Market was valued at USD 2.43 billion in 2024 and is anticipated to reach USD 4.43 billion by 2032, growing at a CAGR of 7.8% during the forecast period.

Smart Boxing Gloves Market

Smart Boxing Gloves market was valued at USD 149.05 million in 2024 and is anticipated to reach USD 321.83 million by 2032, growing at a CAGR of 10.1% during the forecast period.

Sand Screen Market

Sand screen Market was valued at USD 607.4 million in 2024 and is anticipated to reach USD 936.42 million by 2032, growing at a CAGR of 5.56 % during the forecast period.

Licence Option

The report comes as a view-only PDF document, optimized for individual clients. This version is recommended for personal digital use and does not allow printing. Use restricted to one purchaser only.
$4999

To meet the needs of modern corporate teams, our report comes in two formats: a printable PDF and a data-rich Excel sheet. This package is optimized for internal analysis. Unlimited users allowed within one corporate location (e.g., regional office).
$6999

The report will be delivered in printable PDF format along with the report’s data Excel sheet. This license offers 100 Free Analyst hours where the client can utilize Credence Research Inc. research team. Permitted for unlimited global use by all users within the purchasing corporation, such as all employees of a single company.
$12999

Report delivery within 24 to 48 hours

Credence Staff 3

WILLIAM, North America

Support Staff at Credence Research

KEITH PHILLIPS, Europe

Lee - CR Sales Staff

LEE VALLANCE, Asia Pacific

Kieran Jameson

KIERAN JAMESON, Australia

Smallform of Sample request
User Review

Thank you for the data! The numbers are exactly what we asked for and what we need to build our business case.

Materials Scientist
(privacy requested)

User Review

The report was an excellent overview of the Industrial Burners market. This report does a great job of breaking everything down into manageable chunks.

Imre Hof
Management Assistant, Bekaert

cr-clients-logos

Request Sample