Market Overview
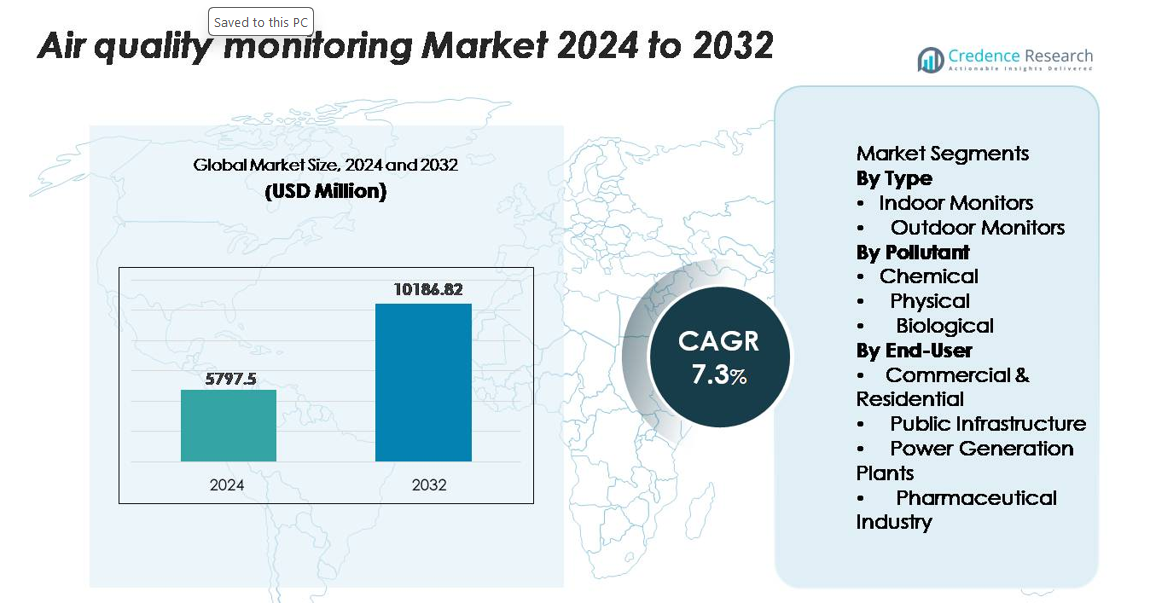
The air quality monitoring equipment market was valued at USD 5,797.5 million in 2024 and is projected to reach USD 10,186.82 million by 2032, expanding at a CAGR of 7.3% over the forecast period (2025–2032).”
| REPORT ATTRIBUTE |
DETAILS |
| Historical Period |
2020-2023 |
| Base Year |
2024 |
| Forecast Period |
2025-2032 |
| Air Quality Monitoring System Market Size 2024 |
USD 5,797.5 million |
| Air Quality Monitoring System Market, CAGR |
7.3% |
| Air Quality Monitoring System Market Size 2032 |
USD 10,186.82 million |
Leading players in the air quality monitoring equipment market include Thermo Fisher Scientific, Honeywell International, Siemens, Teledyne Technologies, Aeroqual, Horiba, and PerkinElmer, each strengthening their position through advanced multi-parameter analyzers, continuous emissions monitoring systems, and integrated IoT sensor platforms. These companies focus on regulatory-grade accuracy, cloud-enabled analytics, and high-resolution particulate measurement technologies to meet rising industrial and urban compliance demands. North America remains the leading region, capturing approximately 34–36% of the global market due to strong EPA-driven enforcement, wildfire monitoring expansion, and heavy investment in high-precision ambient and industrial monitoring networks.
Market Insights
- The air quality monitoring equipment market was valued at USD 5,797.5 million in 2024 and is projected to reach USD 10,186.82 million by 2032, registering a 7.3% CAGR over the forecast period.
- Growing regulatory enforcement on industrial emissions and rising awareness of indoor and outdoor pollution are accelerating adoption, with outdoor monitors holding the largest segment share due to mandatory compliance requirements across cities and industrial hubs.
- Key trends include rapid deployment of IoT-enabled low-cost sensor networks, integration of AI-based analytics, and expansion of smart-city monitoring infrastructure, enhancing real-time environmental intelligence.
- Strong competition emerges from leading players such as Thermo Fisher Scientific, Honeywell, Siemens, and Teledyne, each investing in multi-parameter analyzers, CEMS solutions, and cloud-based data platforms; however, high installation and calibration costs restrain adoption in developing regions.
- Regionally, North America leads with 34–36% share, followed by Europe at 28–30% and Asia-Pacific at 26–28%, reflecting strong regulatory frameworks and expanding pollution monitoring programs.
Access crucial information at unmatched prices!
Request your sample report today & start making informed decisions powered by Credence Research Inc.!
Download Sample
Market Segmentation Analysis:
By Type:
Outdoor monitors hold the dominant market share as they form the backbone of national and regional air surveillance networks. Governments and environmental agencies rely on these systems to track pollutants such as NO₂, O₃, SO₂, CO, and PM across urban, industrial, and roadside locations. Their high-capacity sampling, rugged construction, and ability to integrate with meteorological stations strengthen adoption. Indoor monitors continue expanding due to rising residential health concerns and workplace safety mandates, but outdoor monitors lead the segment because of regulatory enforcement, large-scale public infrastructure deployments, and higher equipment investment.
- For instance, Thermo Fisher’s TEOM 1405 particulate analyzer operates with a flow rate of 3 L/min and measures PM concentrations up to 1,000 µg/m³ with a resolution of 0.1 µg/m³, while Horiba’s APNA-370 NOx analyzer provides a detection limit of 0.5 ppb using chemiluminescence.
By Pollutant:
Chemical pollutant monitoring remains the leading sub-segment, driven by strict national air quality standards targeting nitrogen oxides, sulfur oxides, ozone, carbon monoxide, and volatile organic compounds. These pollutants significantly influence public health and environmental compliance, prompting industries and municipalities to adopt high-precision gas analyzers and continuous emissions monitoring solutions. Physical pollutants—particularly PM2.5 and PM10—are witnessing rapid growth due to increasing global particulate pollution episodes. Biological pollutants maintain a niche role, primarily in hospitals and research settings. Chemical monitoring dominates because it supports regulatory reporting, real-time alerts, and advanced data modeling requirements.
- For instance, Siemens’ ULTRAMAT 23 multi-gas analyzer measures CO, NO, SO₂, and CO₂ simultaneously, with detection limits as low as 2 ppm for CO and 5 ppm for SO₂, while Honeywell’s ML9841 NOx analyzer uses chemiluminescence to achieve a detection capability of 0.4 ppb.
By End-User:
Public infrastructure accounts for the largest share, supported by government-funded expansion of fixed monitoring stations, mobile sensing units, and smart-city air quality grids. Urban authorities deploy advanced analyzers to track pollution hotspots, support emission control strategies, and comply with national air quality frameworks. Commercial and residential adoption is rising with the proliferation of compact indoor sensors, while power generation plants rely on continuous emissions monitoring to meet compliance mandates. The pharmaceutical sector also invests in cleanroom-compatible systems. Public infrastructure leads due to high-budget deployments, long-term monitoring programs, and increasing policy-driven environmental transparency.
Key Growth Drivers
Expansion of Regulatory Frameworks and Compliance Mandates
Global air quality regulations continue to strengthen as governments enforce stricter limits on particulate matter, gaseous pollutants, and industrial emissions. This has accelerated mandatory deployment of continuous emissions monitoring systems across power generation, manufacturing, petrochemicals, construction, and transportation corridors. Urban authorities increasingly require fixed and mobile monitoring stations to comply with revised national air quality standards and reporting protocols. These mandates also extend to environmental audits, permitting procedures, and community air quality disclosure requirements. Industries are investing heavily in precision analyzers, calibrated sensors, and advanced data logging systems to ensure they meet compliance thresholds and avoid penalties. The shift toward real-time public reporting—driven by digital transparency policies—further supports market expansion. As countries adopt updated air pollution acts, emission caps, and cross-sector compliance frameworks, regulatory enforcement remains a primary driver that compels continuous modernization of monitoring infrastructure.
- For instance, Teledyne API’s T640 PM analyzer provides continuous particulate measurement across a 0–1,000 µg/m³ range with a 0.1 µg/m³ resolution, while Thermo Fisher’s 43i SO₂ analyzer delivers a detection limit of 0.5 ppb using pulsed fluorescence technology.
Rising Health Awareness and Indoor Air Quality Prioritization
Increased public and institutional awareness of respiratory health, allergen exposure, and chronic disease risks associated with poor air quality is accelerating demand for advanced monitoring solutions. Homes, commercial buildings, hospitals, and educational institutions are adopting indoor air quality monitors to track VOCs, CO₂ levels, particulate matter, and humidity conditions. The growing emphasis on wellness-certified buildings and ventilation performance verification has further increased adoption of IAQ sensors in HVAC systems. Corporate ESG policies now include air quality metrics as part of employee well-being initiatives, prompting installation of automated sensing networks and filtration-linked monitoring. Smart home penetration and IoT-enabled devices also contribute to widespread consumer adoption. As indoor environments account for a significant proportion of daily exposure, the shift toward continuous indoor monitoring is becoming a central driver of market growth across both residential and commercial segments.
- For instance, the Honeywell R200C2-A CO₂ monitor uses an NDIR CO₂ sensor with a 400–5,000 ppm range and ±50 ppm (plus 5% of reading) accuracy. For multi-pollutant monitoring, a different Honeywell Indoor Air Quality Monitor model, such as the HD200MH1W0, incorporates an advanced laser-based, light-scattering PM2.5 sensor that measures PM 2.5 in a range of 0–1,000 µg/m³ with a 1 µg/m³ resolution.
Smart-City Development and Sensor Network Modernization
Large-scale urban development programs are deploying distributed air quality sensor networks to support pollution mapping, traffic planning, and public health forecasting. Smart-city initiatives integrate low-cost sensors, satellite-linked monitoring, and real-time dashboards that help authorities analyze pollution hotspots and predict environmental risks. These networks leverage IoT, AI-based analytics, and cloud platforms to provide actionable intelligence for policy decisions. Investments in digital infrastructure—such as 5G connectivity and edge-computing nodes—enhance the efficiency of multi-site monitoring systems. Municipalities increasingly utilize mobile monitoring units mounted on public transit, drones, and roadside installations to expand coverage. This transition toward interconnected, data-driven environmental management not only improves urban planning but also drives continuous upgrades of sensor accuracy, data reporting capabilities, and network scalability. As smart-city programs expand globally, adoption of integrated air monitoring systems continues to accelerate.
Key Trends & Opportunities
Rapid Adoption of Low-Cost, IoT-Enabled Sensor Networks
A major trend shaping the market is the rapid expansion of IoT-enabled air quality sensors that offer scalable, cost-effective alternatives to traditional fixed stations. These compact devices provide high-frequency data collection and seamless cloud connectivity, making them ideal for community monitoring programs, industrial zones, and commercial buildings. Their integration with mobile apps and analytics platforms unlocks opportunities for hyperlocal pollution mapping and predictive modeling. Technology advancements—including AI-based calibration, machine learning algorithms, and edge processing—enhance the accuracy and usefulness of low-cost sensors. This trend opens opportunities for device manufacturers, software providers, and data analytics companies to develop competitive, multi-parameter monitoring solutions tailored to urban management, industrial compliance, and consumer markets.
- For instance, Aeroqual’s Series 500 portable monitor supports swappable sensor heads measuring multiple gases, including NO₂, O₃, CO, and VOCs, with each sensor offering defined detection limits—such as the GSE-NO₂ sensor covering a 0–1,000 ppb range with ±10 ppb accuracy, and the GSS-O₃ sensor measuring 0–150 ppb with a 1 ppb resolution.
Growth Opportunities in Emissions Monitoring for Industrial Decarbonization
As industries pursue decarbonization and net-zero goals, continuous emissions monitoring systems (CEMS) are becoming essential for tracking pollutant output and optimizing operational efficiency. Facilities in power generation, cement production, steel manufacturing, and petrochemicals are integrating advanced analyzers capable of measuring NOx, SO₂, CO₂, and particulates in real time. This shift aligns with global carbon markets, ESG reporting, and climate disclosure mandates. The demand for advanced monitoring technologies—such as optical gas imaging, laser absorption spectroscopy, and high-precision gas detectors—is expanding as companies work toward compliance and sustainability commitments. This trend creates significant opportunities for innovative sensor technologies, emissions analytics platforms, and remote monitoring service providers.
- For instance, Siemens’ LDS 6 tunable diode laser analyzer measures gases such as CO, O₂, and NH₃ with response times under 2 seconds and optical paths up to 180 meters, while Teledyne’s Model 7500 extractive CEMS analyzer quantifies SO₂ and NOx with detection limits of 0.2 ppm and 0.4 ppm respectively.
Increasing Integration of AI and Predictive Analytics in Air Quality Management
Artificial intelligence is increasingly being used to enhance data interpretation, reduce measurement errors, and forecast pollution levels. AI-powered models combine sensor data with meteorological inputs to produce high-accuracy predictions for pollution events such as smog formation, industrial leakages, and wildfire smoke dispersion. This supports informed decision-making for public health agencies, industrial operators, and urban planners. AI-driven solutions also optimize sensor deployment, detect anomalies, and automate calibration schedules. The integration of predictive analytics presents opportunities for software developers, environmental data firms, and smart-city integrators to offer advanced, value-added monitoring services beyond traditional hardware sales.
Key Challenges
High Installation and Maintenance Costs of Advanced Monitoring Stations
Despite technological advances, high-precision air monitoring systems remain costly to install, operate, and maintain. Regulatory-grade analyzers require climate-controlled enclosures, frequent calibration, specialized maintenance protocols, and skilled technicians—factors that significantly increase total ownership costs. Developing countries often struggle to deploy and sustain large-scale networks due to budget constraints. Industries also face financial barriers when adopting continuous emissions monitoring systems, especially small and medium enterprises. These cost challenges limit market penetration in resource-constrained regions and slow the replacement cycle for outdated systems. As a result, affordability remains a major challenge that affects expansion of high-accuracy monitoring infrastructure.
Data Accuracy Issues and Calibration Challenges in Low-Cost Sensors
While low-cost air quality sensors are rapidly gaining popularity, they often face accuracy challenges due to environmental interference, sensor drift, humidity effects, and inconsistent calibration protocols. These limitations can produce data discrepancies when compared to regulatory-grade stations, undermining trust among government agencies and industrial users. Maintaining accuracy requires frequent recalibration, firmware updates, and rigorous data validation, which many users overlook. The lack of standardized performance benchmarks further complicates market adoption. As low-cost sensors become more common, ensuring data reliability and establishing global calibration standards emerge as critical challenges that must be addressed to support widespread acceptance.
Regional Analysis
North America
North America holds the largest share of the air quality monitoring equipment market, accounting for around 34–36% of global revenue. Strong regulatory enforcement under the U.S. EPA, increasing wildfire-driven pollution events, and widespread deployment of continuous monitoring stations reinforce its leadership. Federal and state agencies invest heavily in high-precision analyzers and satellite-linked monitoring platforms, while industrial sectors adopt CEMS to meet emission reporting mandates. Canada’s expanding urban air management programs and growing adoption of indoor monitoring in commercial buildings further support regional dominance. Technological advancements and strong funding commitments sustain the region’s long-term growth outlook.
Europe
Europe represents approximately 28–30% of the global market, driven by stringent emission standards under the EU Ambient Air Quality Directive and industrial regulations. Countries such as Germany, the U.K., France, and the Nordic nations maintain dense air monitoring networks that track particulate matter, NOx, and ozone concentrations. The region’s transition toward cleaner urban mobility, low-emission zones, and renewable-powered industrial operations increases the need for advanced sensor systems and continuous emissions monitoring. Rising investments in indoor air quality solutions across educational and healthcare facilities also strengthen adoption. Europe remains a mature but steadily evolving market supported by regulatory compliance and environmental transparency goals.
Asia-Pacific
Asia-Pacific is the fastest-growing region, contributing around 26–28% of global market share. Rapid industrialization, high urban population density, and recurring particulate pollution events drive strong demand for fixed and portable monitoring solutions. China, India, Japan, and South Korea are expanding national monitoring grids, adopting low-cost IoT sensors, and implementing factory-level emissions auditing. Government-led clean air missions and smart-city programs accelerate adoption across industrial hubs and metropolitan areas. Rising awareness of indoor air quality in corporate, retail, and residential spaces further boosts regional growth. APAC’s combination of regulatory tightening and large-scale infrastructure investments positions it as a major long-term growth engine.
Latin America
Latin America holds around 6–7% of the global market, supported by growing air quality initiatives across Mexico, Brazil, Chile, and Colombia. Urban pollution challenges—stemming from traffic congestion, industrial clusters, and biomass burning—have encouraged deployment of roadside and fixed monitoring stations. Governments increasingly collaborate with international environmental agencies to upgrade pollutant reporting systems and expand national monitoring networks. Adoption of indoor air monitoring remains gradual but is rising in commercial buildings and healthcare facilities. Although budget constraints limit high-precision installations, the region benefits from affordable sensor-based solutions and emerging smart-city projects focused on environmental diagnostics.
Middle East & Africa
The Middle East & Africa region accounts for about 4–5% of the global market, with adoption concentrated in the Gulf countries and South Africa. Rising industrial emissions, dust storms, and urban pollution drive investments in ambient air monitoring networks, especially in Saudi Arabia, the UAE, and Qatar. Government diversification initiatives and environmental compliance policies support installation of advanced analyzers in energy, petrochemical, and manufacturing sectors. In Africa, deployment remains limited but is growing through donor-funded programs and low-cost community monitoring projects. Despite infrastructure constraints, increasing environmental awareness and regulatory modernization are creating new opportunities across the region.
Market Segmentations:
By Type
- Indoor Monitors
- Outdoor Monitors
By Pollutant
- Chemical
- Physical
- Biological
By End-User
- Commercial & Residential
- Public Infrastructure
- Power Generation Plants
- Pharmaceutical Industry
By Geography
- North America
- Europe
- Germany
- France
- U.K.
- Italy
- Spain
- Rest of Europe
- Asia Pacific
- China
- Japan
- India
- South Korea
- South-east Asia
- Rest of Asia Pacific
- Latin America
- Brazil
- Argentina
- Rest of Latin America
- Middle East & Africa
- GCC Countries
- South Africa
- Rest of the Middle East and Africa
Competitive Landscape
The competitive landscape of the air quality monitoring equipment market is characterized by a mix of global instrumentation leaders, specialized sensor manufacturers, and emerging IoT-based solution providers. Companies such as Thermo Fisher Scientific, Honeywell International, Siemens, Teledyne Technologies, Horiba, Aeroqual, and PerkinElmer dominate the high-precision segment with advanced analyzers, particulate counters, and continuous emissions monitoring systems designed for regulatory compliance and industrial use. These players compete on technological accuracy, multi-parameter sensing capability, integration with cloud platforms, and long-term service contracts. Meanwhile, newer entrants are gaining traction with low-cost IoT sensors tailored for smart-city deployments and indoor monitoring applications. Strategic collaborations with government agencies, industrial operators, and environmental research bodies strengthen market positioning. Product innovation, such as AI-driven calibration, real-time forecasting tools, and modular sensor networks, continues to define competitive differentiation. Overall, the market remains moderately consolidated, with established players leveraging strong R&D capabilities and global distribution networks to maintain leadership.
Shape Your Report to Specific Countries or Regions & Enjoy 30% Off!
Key Player Analysis
- Siemens AG (Germany)
- Honeywell (U.S.)
- RXI Instruments (U.S.)
- Chemtrols (India)
- Thermo Fisher Scientific (U.S.)
- Horiba, Ltd. (Japan)
- Innovaer Technologies (U.S.)
- 3M Company (U.S.)
- Testo (Germany)
- Emerson Electric (U.S.)
Recent Developments
- In October 2025, company profile information indicated Chemtrols offers solutions for continuous emissions monitoring, ambient air quality monitoring, gas detection and terminal automation.
- In 2022, Honeywell introduced a combined early-warning smoke detection plus advanced IAQ monitoring system, broadening its indoor air quality portfolio.
- In February 2022, Honeywell launched a compact Indoor Air Quality (IAQ) monitor in India, designed to alert building operators of pollutant levels, temperature, and humidity
Report Coverage
The research report offers an in-depth analysis based on Type, Pollutant, End-User and Geography. It details leading market players, providing an overview of their business, product offerings, investments, revenue streams, and key applications. Additionally, the report includes insights into the competitive environment, SWOT analysis, current market trends, as well as the primary drivers and constraints. Furthermore, it discusses various factors that have driven market expansion in recent years. The report also explores market dynamics, regulatory scenarios, and technological advancements that are shaping the industry. It assesses the impact of external factors and global economic changes on market growth. Lastly, it provides strategic recommendations for new entrants and established companies to navigate the complexities of the market.
Future Outlook
- Air quality monitoring equipment adoption will increase as governments strengthen emission standards and expand national monitoring networks.
- Demand for real-time, cloud-connected sensors will grow with the rise of smart-city programs and digital environmental management.
- AI-enabled analytics will enhance predictive pollution modeling and support faster decision-making for public health and industry.
- Industrial sectors will invest more in continuous emissions monitoring to meet tightening compliance and sustainability targets.
- Indoor air quality systems will gain traction as workplaces, schools, and residential buildings prioritize health and ventilation performance.
- Low-cost IoT sensors will expand community-level and hyperlocal monitoring coverage across urban areas.
- Integration of satellite data with ground-based sensors will improve large-scale pollution tracking and forecasting accuracy.
- Portable and wearable air quality devices will see wider adoption among consumers and environmental field teams.
- Cross-industry collaborations will accelerate innovation in multi-pollutant detection technologies.
- Emerging economies will increasingly invest in monitoring infrastructure, driven by urbanization and pollution management priorities.


