Market Overview
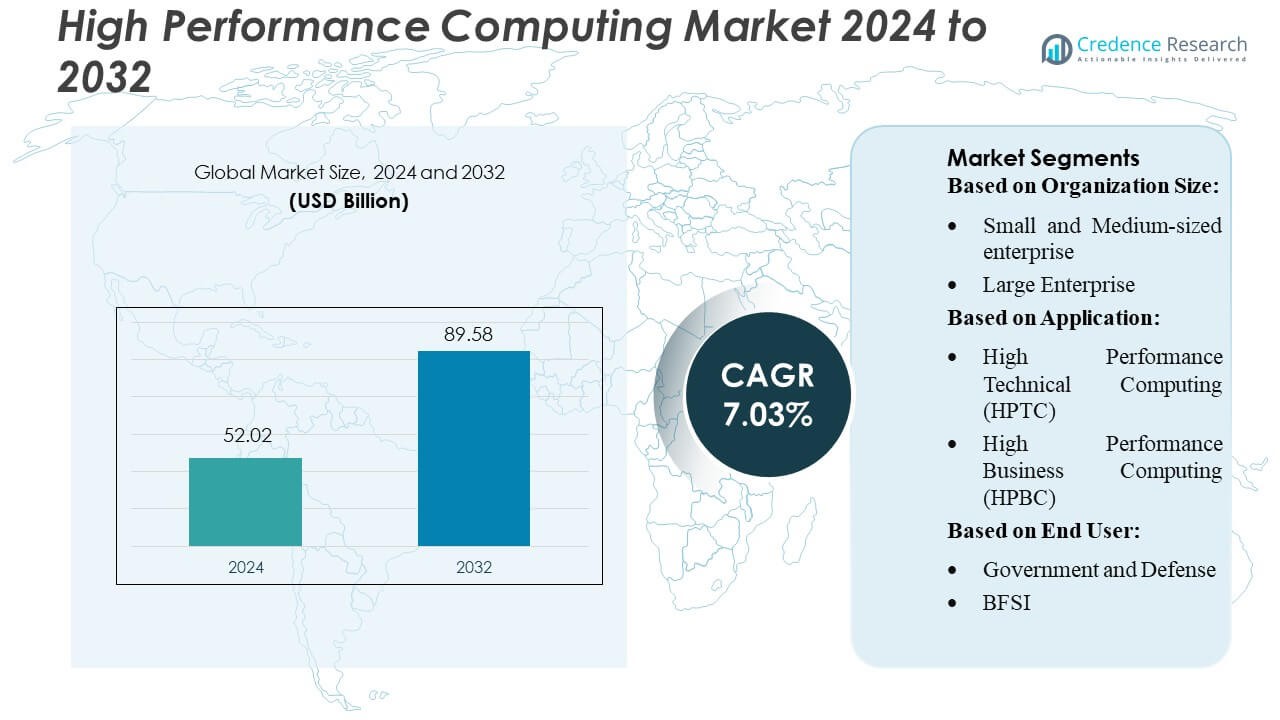
High Performance Computing Market size was valued USD 52.02 billion in 2024 and is anticipated to reach USD 89.58 billion by 2032, at a CAGR of 7.03% during the forecast period.
| REPORT ATTRIBUTE |
DETAILS |
| Historical Period |
2020-2023 |
| Base Year |
2024 |
| Forecast Period |
2025-2032 |
| High Performance Computing Market Size 2024 |
USD 52.02 Billion |
| High Performance Computing Market, CAGR |
7.03% |
| High Performance Computing Market Size 2032 |
USD 89.58 Billion |
The high-performance computing (HPC) market is led by major players such as Dell, IBM, AWS and Microsoft, which provide hardware, infrastructure, and cloud-based HPC solutions. Dell holds roughly 15% of the global HPC market, while IBM accounts for about 13%, reflecting their strong positions in enterprise and research deployments. North America is the leading region in HPC adoption, capturing approximately 34% of the global market share, driven by robust supercomputing infrastructure, enterprise demand, and government investment.
 Market Insights
- The High Performance Computing Market reached USD 52.02 billion in 2024 and is projected to hit USD 89.58 billion by 2032, supported by a steady CAGR of 7.03% across expanding scientific, industrial and commercial workloads.
- Strong market drivers include rising demand for faster processing, scalable systems for AI and simulation, and increasing adoption of cloud-based HPC solutions that lower upfront investment barriers for enterprises.
- Key trends include broader use of hybrid architectures, growing integration of GPUs for accelerated computing and the rapid shift toward HPC-as-a-Service driven by AWS, Microsoft and IBM.
- Competitive dynamics remain intense, with Dell holding about 15% market share and IBM capturing nearly 13%, supported by continuous innovation, high-performance servers and strong enterprise relationships, while restraints include high operating costs and energy requirements.
- Regionally, North America leads with about 34% share, while cloud deployment remains the fastest-growing segment as organizations prioritize flexible, on-demand compute capacity.
Access crucial information at unmatched prices!
Request your sample report today & start making informed decisions powered by Credence Research Inc.!
Download Sample
Market Segmentation Analysis:
By Organization Size
Large enterprises dominate the High-Performance Computing market, holding the major share due to their stronger budgets, large data workloads, and extensive use of simulation, AI, and advanced analytics. They invest in on-premise and hybrid HPC systems to support engineering design, scientific modelling, and cybersecurity. Small and medium-sized enterprises show faster growth, supported by increasing adoption of cloud-based HPC and HPC-as-a-Service, which reduces infrastructure costs and enables access to scalable compute power. The dominant large-enterprise segment benefits mainly from high-performance workloads and growing digital transformation needs.
- For instance, Fujitsu’s PRIMEHPC FX1000 system—built with the same architecture as the Fugaku supercomputer—delivers up to 3.38 petaflops per rack, enabling large enterprises to run highly complex simulations with significantly reduced processing time.
By Application
High-Performance Technical Computing (HPTC) represents the dominant application segment, accounting for the largest market share due to its critical role in scientific research, engineering simulation, climate modelling, and advanced AI workloads. HPTC adoption grows as industries rely on complex modelling, high-speed data processing, and precision design. High-Performance Business Computing (HPBC) continues to expand, driven by rising use of HPC in risk analysis, financial modelling, real-time decision support, and enterprise analytics. The dominance of HPTC is supported by strong demand from research institutions, manufacturing, and energy sectors.
- For instance, Amazon Web Services (AWS) enables HPTC users to deploy HPC clusters using AWS ParallelCluster, and its Elastic Fabric Adapter provides up to 100 Gbps network bandwidth, allowing researchers to run large-scale simulations with significantly reduced latency.
By End-user
Education and Research remains the dominant end-user segment, holding the largest share as universities, laboratories, and government research centers depend heavily on HPC for simulations, genomics, physics modelling, and climate studies. Government and Defense, BFSI, Manufacturing, and Healthcare steadily increase adoption to support national security analytics, risk modelling, digital twin development, and drug discovery. Energy, Media & Entertainment, and Earth Sciences also expand their usage for seismic imaging, rendering, and geoscience modelling. The segment dominance is driven by continuous investment in scientific computation and advanced research activities.
Key Growth Drivers
- Rising Demand for Complex Computational Workloads
High Performance Computing market growth accelerates as enterprises adopt advanced simulations, machine learning, and real-time analytics to manage increasingly complex workloads. Industries such as aerospace, automotive, and financial services deploy HPC clusters to optimize design cycles and risk modeling with higher precision. The rapid scale-up of scientific research programs and genome-level analysis also drives adoption. Organizations invest in HPC to reduce processing time, improve modeling accuracy, and handle unstructured datasets, reinforcing HPC’s role as a strategic digital infrastructure.
- For instance, Intel Corporation’s 4th Gen Intel® Xeon® Scalable processors support up to 60 CPU cores per socket and deliver integrated accelerators capable of processing up to 4.8 teraflops per core in FP64 compute (using AVX-512 instructions), enabling enterprises to run large-scale simulations and AI workloads with significantly higher throughput.
- Expansion of Cloud-Based HPC Deployment
Cloud-based HPC emerges as a strong growth catalyst as organizations seek scalable, cost-efficient compute resources without extensive capital investments. Major cloud providers offer on-demand high-performance compute instances, hybrid architectures, and accelerated storage systems that simplify deployment. This trend enables small and mid-sized enterprises to access HPC capabilities previously limited to large research institutions. Cloud elasticity supports high-performance simulations, AI training workloads, and rapid provisioning, making cloud HPC a preferred model for modernization and reducing infrastructure management complexities.
- For instance, Dell Inc. enables hybrid and cloud-ready HPC through its Dell PowerEdge XE9640 liquid-cooled server, which delivers up to 4 NVIDIA H100 GPUs in a compact, 2U form factor. The four integrated GPUs provide aggregate compute performance capable of theoretically exceeding 40 petaflops of FP8 processing, allowing enterprises to run large-scale cloud-integrated AI and HPC workloads with high efficiency.
- Advancements in Processor and Accelerator Technologies
The development of next-generation processors, GPUs, and specialized accelerators propels HPC performance and efficiency. Vendors introduce heterogeneous architectures that combine CPUs, GPUs, and AI-specific chips to deliver higher throughput for compute-intensive tasks. Breakthroughs in chip packaging, interconnect technologies, and energy-efficient designs improve system density and lower operating costs. These innovations support faster data modeling, real-time analytics, and large-scale simulations, enabling organizations to process massive datasets and address computational bottlenecks more effectively.
Key Trends & Opportunities
1. Growing Adoption of AI-Driven HPC Systems
The convergence of AI and HPC creates significant opportunities as enterprises refine predictive analytics, deep learning, and automation frameworks. AI-optimized HPC systems accelerate training cycles and inference tasks, reducing data-to-decision time across industries. Research institutions deploy AI-HPC platforms to enhance climate modeling, drug discovery, and anomaly detection. Vendors integrate algorithm-aware accelerators and optimized software stacks, allowing organizations to boost system performance and unlock new use cases that depend on rapid, high-accuracy processing.’
- For instance, Eviden’s (formerly Atos) BullSequana XH3000 platform is a highly customizable, open, hybrid exascale supercomputer that supports various configurations of high-core-count CPUs and powerful integrated GPU acceleration.
2. Rising Focus on Energy-Efficient HPC Infrastructure
Energy-efficient HPC design becomes a major trend as organizations address escalating power consumption and sustainability goals. Liquid cooling, chip-level power optimization, and advanced thermal management systems help data centers reduce operational costs. Governments and enterprises invest in green computing initiatives to meet environmental standards, creating demand for low-power processors and eco-optimized data center architectures. This trend fosters innovation in cooling technologies and drives adoption of energy-aware workload orchestration tools for high-density compute environments.
- For instance, IBM Corporation’s Power10 processor integrates 18 billion transistors and features transparent memory encryption while delivering up to 3× improved energy efficiency for AI and HPC workloads compared with its predecessor, enabling sustainable high-performance operations at scale.
3. Expansion of Exascale Computing Initiatives
Exascale computing development presents new market opportunities as countries invest in national-level supercomputing programs to strengthen research competitiveness. Exascale systems enable unprecedented computational capability for climate prediction, materials science, and genomic research. Vendors collaborate with government agencies to develop exascale-ready architectures, advanced interconnects, and scalable memory systems. These initiatives accelerate innovation across the HPC value chain and create opportunities for software optimization, security enhancements, and high-bandwidth storage technologies.
Key Challenges
1. High Capital and Operational Costs
The HPC market faces challenges due to the significant costs associated with system deployment, maintenance, and power consumption. Organizations must invest heavily in advanced processors, accelerators, and high-density cooling systems, creating barriers for cost-sensitive sectors. Operational complexities increase with rising energy requirements and specialized technical expertise. Many enterprises struggle to justify long-term ROI, especially when workloads fluctuate. These financial and infrastructure constraints limit widespread adoption and push organizations toward alternative models such as cloud-based HPC.
2. Growing Complexity in System Integration and Management
Modern HPC environments incorporate heterogeneous architectures, multi-tier storage, and high-speed interconnects, increasing system integration challenges. Organizations require specialized skills to manage parallel processing, optimize workloads, and maintain interoperability across hardware and software layers. Security risks intensify as HPC clusters handle sensitive research and industrial data. Limited availability of skilled HPC administrators slows deployment efficiency and increases operational overhead. This complexity remains a critical barrier for enterprises transitioning to next-generation HPC infrastructures.
Regional Analysis
North America
North America holds around 40–42% of the global HPC market, making it the largest regional contributor. Strong adoption comes from government research labs, advanced universities, and industries such as aerospace, defense, and finance. The region benefits from leading HPC vendors, high cloud adoption, and continuous investment in AI, analytics, and exascale computing programs. Large-scale data centers and robust digital infrastructure support high-end workloads across enterprises. Growing demand for simulation, modeling, and real-time processing continues to strengthen North America’s leadership in the global HPC landscape.
Asia-Pacific
Asia-Pacific accounts for approximately 29–31% of the global HPC market and represents the fastest-growing region. Countries such as China, Japan, India, and South Korea invest heavily in supercomputing initiatives, AI research, and national scientific programs. Rapid industrial expansion and growing demand for cloud HPC accelerate adoption across manufacturing, healthcare, telecom, and government sectors. The region’s increasing focus on high-performance data processing and digital transformation strengthens its global position. Asia-Pacific’s sustained public and private investments continue to narrow the gap with North America.
Europe
Europe represents about 20–22% of the HPC market, supported by strong government funding and an established research ecosystem. Major countries such as Germany, France, and the United Kingdom deploy HPC systems for engineering simulations, climate modeling, automotive design, and energy research. The region places high emphasis on efficient computing and sustainability, encouraging adoption of energy-optimized HPC systems. Europe’s initiatives toward advanced scientific computing and industrial digitalization keep the region competitive and contribute significantly to global HPC development.
Latin America
Latin America holds roughly 5–7% of the global HPC market, with adoption growing steadily despite existing infrastructure limitations. Universities, government agencies, and energy companies drive most HPC usage for research, geological modeling, and environmental studies. While the region still faces funding constraints, increased interest in digital transformation, AI projects, and scientific research is expanding demand for HPC capabilities. Cloud-based HPC is also becoming more attractive due to lower upfront costs. Overall, Latin America shows gradual and consistent growth.
Middle East & Africa
The Middle East & Africa region accounts for around 5–6% of the HPC market, supported by rising investments in government research, oil and gas exploration, and smart-city initiatives. Countries in the Gulf focus on HPC for energy modeling, weather forecasting, and security applications. Growing cloud adoption and national digital strategies encourage broader use of high-performance computing across industries. Although adoption is still emerging compared to major regions, expanding digital infrastructure and increasing interest in advanced analytics support steady market growth.
Market Segmentations:
By Organization Size:
- Small and Medium-sized enterprise
- Large Enterprise
By Application:
- High Performance Technical Computing (HPTC)
- High Performance Business Computing (HPBC)
By End User:
- Government and Defense
- BFSI
By Geography
- North America
- Europe
- Germany
- France
- U.K.
- Italy
- Spain
- Rest of Europe
- Asia Pacific
- China
- Japan
- India
- South Korea
- South-east Asia
- Rest of Asia Pacific
- Latin America
- Brazil
- Argentina
- Rest of Latin America
- Middle East & Africa
- GCC Countries
- South Africa
- Rest of the Middle East and Africa
Competitive Landscape
The High Performance Computing (HPC) market features a highly competitive landscape dominated by major technology providers such as Fujitsu, Amazon Web Services, Inc., Intel Corporation, Dell Inc., Atos SE, IBM Corporation, Cisco Systems, Inc., Inspur, Inc., Advanced Micro Devices, Inc., and Hewlett Packard Enterprise Development LP. The High Performance Computing (HPC) market shows strong competitive intensity as vendors focus on delivering advanced architectures, scalable compute platforms, and energy-efficient systems to support demanding workloads. The landscape is defined by rapid innovation in processors, accelerators, storage, and high-speed interconnects, enabling organizations to manage complex simulations, AI training, and data-intensive analytics with greater speed and precision. Cloud-based HPC services continue expanding, offering flexible consumption models and reducing upfront infrastructure costs for enterprises. Competition also increases through collaborations with research institutions, government agencies, and industrial users to develop exascale-ready solutions. Overall, performance optimization, sustainability, and workload-specific customization shape the core competitive strategies in the HPC market.
Key Player Analysis
- Fujitsu
- Amazon Web Services, Inc.
- Intel Corporation
- Dell Inc.
- Atos SE
- IBM Corporation
- Cisco Systems, Inc.
- Inspur, Inc.
- Advanced Micro Devices, Inc.
- Hewlett Packard Enterprise Development LP
Recent Developments
- In May 2025, NVIDIA Corporation introduced the GeForce RTX 5060, available through leading add-in card partners including ASUS, MSI, GIGABYTE, ZOTAC, and others, as well as in pre-built desktops from system integrators.
- In March 2025, Hewlett-Packard Enterprise Development LP (HPE) and the European Space Agency (ESA) inaugurated the Space HPC facility at ESA’s ESRIN center in Italy. This new high-performance computing facility will boost European space research by accelerating data processing, complex simulations, and AI applications for space exploration and Earth observation.
- In November 2024, Fujitsu and Advanced Micro Devices, Inc signed a memorandum of understanding to establish a strategic partnership focused on developing advanced computing platforms for AI and high-performance computing (HPC).
- In January 2024, IBM and Korea Quantum Computing (KQC) announced a partnership that will expand KQC’s high-performance computing (HPC) capabilities by integrating IBM’s AI and quantum computing services. Through this collaboration, KQC will offer its users access to IBM’s AI platform, including watsonx}, and will continue to provide cloud-based access to IBM’s quantum systems.
Shape Your Report to Specific Countries or Regions & Enjoy 30% Off!
Report Coverage
The research report offers an in-depth analysis based on Organization Size, Application, End-User and Geography. It details leading market players, providing an overview of their business, product offerings, investments, revenue streams, and key applications. Additionally, the report includes insights into the competitive environment, SWOT analysis, current market trends, as well as the primary drivers and constraints. Furthermore, it discusses various factors that have driven market expansion in recent years. The report also explores market dynamics, regulatory scenarios, and technological advancements that are shaping the industry. It assesses the impact of external factors and global economic changes on market growth. Lastly, it provides strategic recommendations for new entrants and established companies to navigate the complexities of the market.
Future Outlook
- The market will expand as enterprises adopt HPC for AI training, data analytics, and complex simulations.
- Cloud-based HPC adoption will increase due to its flexibility, scalability, and lower infrastructure burden.
- Exascale computing initiatives will accelerate advancements in national research and scientific innovation.
- Energy-efficient HPC systems will gain priority as organizations focus on reducing power consumption.
- Demand for heterogeneous architectures integrating CPUs, GPUs, and accelerators will rise.
- HPC use in healthcare, genomics, and drug discovery will grow with higher computational needs.
- Edge-to-HPC integration will strengthen real-time processing for industrial and autonomous systems.
- Security enhancements will become essential as HPC workloads handle sensitive research and enterprise data.
- AI-optimized chips and software stacks will drive next-generation performance improvements.
- Collaboration between government agencies, academia, and industry will support HPC innovation and adoption.


