| REPORT ATTRIBUTE |
DETAILS |
| Historical Period |
2020-2023 |
| Base Year |
2024 |
| Forecast Period |
2025-2032 |
| Iron Supplements Market Size 2024 |
USD 3,356.32 Million |
| Iron Supplements Market, CAGR |
4.16% |
| Iron Supplements Market Size 2032 |
USD 4,760.79 Million |
Market Overview
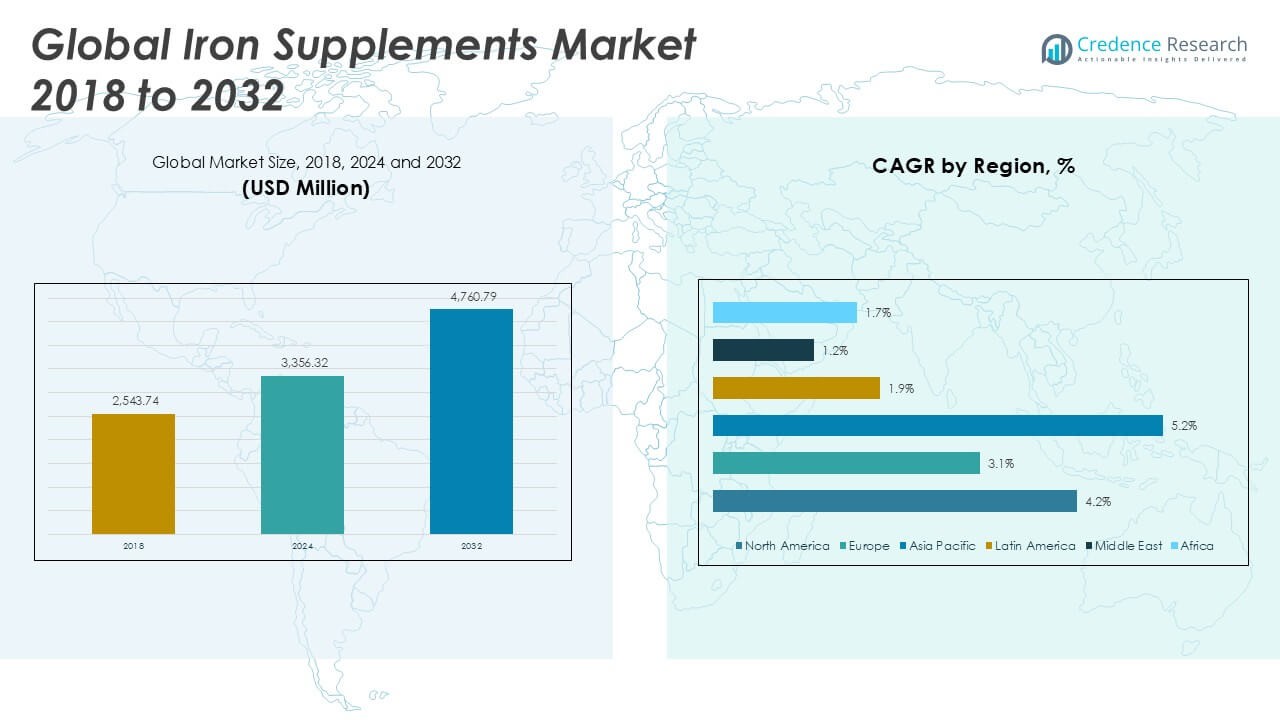
The Iron Supplements Market size was valued at USD 2,543.74 million in 2018, reached USD 3,356.32 million in 2024, and is anticipated to reach USD 4,760.79 million by 2032, at a CAGR of 4.16% during the forecast period.
The Iron Supplements Market is witnessing steady growth driven by the rising prevalence of iron deficiency anemia, increased awareness about nutritional health, and expanding demand from specific consumer groups such as pregnant women and athletes. Governments and health organizations are actively promoting iron supplementation programs to combat widespread anemia, especially in developing regions. The market benefits from ongoing innovation in supplement formulations, including improved bioavailability and taste-masking technologies that enhance user compliance. The trend toward preventive healthcare and growing interest in sports nutrition also fuels demand for iron supplements among health-conscious individuals. However, concerns about side effects and the availability of alternative therapies may restrain market growth. Regional expansion in Asia-Pacific and Latin America is expected due to higher birth rates, dietary patterns, and greater health education efforts. The overall outlook for the iron supplements market remains positive as consumers increasingly prioritize micronutrient intake and preventive healthcare solutions.
The geographical analysis of the Iron Supplements Market highlights significant demand across North America, Europe, and Asia Pacific, with the United States, China, and Germany acting as major growth drivers due to their large populations, advanced healthcare systems, and growing health awareness. Emerging economies in Asia Pacific and Latin America are witnessing rising adoption of iron supplements, supported by government health initiatives and improvements in healthcare infrastructure. Key players such as Amieson, Olly Nutrition, and Nature Made lead the market with diverse product portfolios and strong brand presence. These companies focus on expanding distribution channels and investing in research to offer advanced formulations that cater to specific consumer needs. Strategic partnerships and product innovation remain central to their growth strategies, helping them maintain a competitive edge and address the evolving preferences of health-conscious consumers across various regions.
Access crucial information at unmatched prices!
Request your sample report today & start making informed decisions powered by Credence Research Inc.!
Download Sample
Market Insights
- The Iron Supplements Market reached USD 3,356.32 million in 2024 and is projected to reach USD 4,760.79 million by 2032, registering a CAGR of 4.16%.
- Rising prevalence of iron deficiency anemia and increasing awareness about nutritional health strongly drive market growth worldwide.
- Trends include the development of advanced formulations with improved bioavailability and the popularity of clean-label, plant-based iron supplements.
- Leading players such as Amieson, Olly Nutrition, and Nature Made maintain competitive strength through diverse portfolios, product innovation, and expanded distribution networks.
- Regulatory hurdles, potential side effects, and the availability of alternative therapies act as key restraints that may slow market expansion.
- North America, Europe, and Asia Pacific constitute the largest markets, with North America leading due to robust healthcare infrastructure and proactive anemia management programs.
- Asia Pacific emerges as a rapidly growing region, fueled by large populations, rising health awareness, and government initiatives targeting iron deficiency, while emerging opportunities in Latin America and Africa support long-term market potential.
Market Drivers
Rising Prevalence of Iron Deficiency Anemia Drives Market Demand
The growing incidence of iron deficiency anemia worldwide stands as a primary driver for the Iron Supplements Market. Populations in both developed and developing regions face nutritional gaps that increase the risk of anemia, particularly among women, children, and the elderly. Healthcare organizations and governments emphasize early detection and intervention, supporting the use of iron supplements as an essential preventive and therapeutic measure. Urbanization and lifestyle changes have led to poor dietary patterns, further fueling the need for supplemental iron. It continues to be a critical component in addressing public health challenges associated with micronutrient deficiencies. The persistent burden of anemia ensures sustained demand for iron supplementation products across diverse demographic groups.
- For instance, Shield Therapeutics’ Ferracru® is available in more than 200 hospitals throughout the United Kingdom, providing oral iron therapy for iron deficiency anemia patients.
Increasing Health Awareness and Preventive Healthcare Adoption
Greater awareness of personal health and nutrition encourages consumers to seek preventive solutions, boosting the Iron Supplements Market. Campaigns by health authorities, nutritionists, and wellness influencers raise understanding of iron’s role in maintaining energy, immunity, and cognitive function. This heightened awareness drives proactive supplementation, especially among pregnant women, athletes, and individuals with restricted diets. It promotes the adoption of iron supplements not only for deficiency management but also for overall well-being. Manufacturers leverage educational marketing strategies to inform consumers about the benefits of regular iron intake. The ongoing shift towards preventive care solidifies the market’s growth trajectory.
- For instance, Jamieson Wellness distributed over 1 million educational leaflets on iron supplementation through pharmacies and clinics in North America last year.
Innovation in Product Formulations and Delivery Mechanisms
Continuous innovation in iron supplement formulations strengthens market appeal and accessibility. Companies invest in developing chelated, slow-release, and liquid iron supplements to enhance absorption and reduce gastrointestinal side effects. Efforts focus on improving taste, convenience, and bioavailability, making supplements more attractive for all age groups. The trend towards plant-based and organic supplements aligns with growing consumer preferences for natural ingredients. It enables manufacturers to address varied dietary needs and preferences. Research collaborations help accelerate product development, ensuring the availability of next-generation iron supplements in global markets.
Expansion of Distribution Channels and Digital Access
Widening access to iron supplements through diverse distribution channels supports the market’s upward trajectory. The rise of e-commerce platforms, online pharmacies, and direct-to-consumer sales increases product visibility and availability. Pharmacies and health stores continue to serve as primary retail channels, while digital marketing campaigns engage a wider audience. Strategic partnerships between supplement brands and healthcare providers enhance trust and encourage wider adoption. It also helps manufacturers respond quickly to evolving consumer demands. The integration of technology in sales and marketing broadens the reach of iron supplements, driving robust market growth.
Market Trends
Growing Demand for Plant-Based and Organic Iron Supplements
Consumers increasingly favor plant-based and organic options in the Iron Supplements Market. A rise in vegan and vegetarian lifestyles, along with heightened awareness of clean-label ingredients, shapes purchasing behavior. It leads manufacturers to develop supplements using natural sources such as lentils, spinach, and beetroot extracts. Certification and transparency about ingredient origins build trust and appeal to eco-conscious consumers. The trend encourages companies to reformulate products to exclude synthetic additives and allergens. This shift strengthens market differentiation and supports long-term brand loyalty.
- For instance, Garden of Life offers over 15 unique plant-based iron supplement SKUs within its mykind Organics product line, all certified organic.
Expansion of Digital and E-Commerce Distribution Channels
E-commerce and digital platforms play a transformative role in shaping the Iron Supplements Market. Consumers value the convenience of online purchasing, home delivery, and subscription-based models for regular supplement intake. Direct-to-consumer brands leverage social media and influencer partnerships to engage and educate their audiences. It boosts market reach, especially among tech-savvy and health-conscious populations. Online reviews and transparent labeling contribute to informed purchasing decisions, supporting continued market expansion. Digital strategies enable rapid response to changing consumer preferences and market trends.
- For instance, Olly Nutrition’s website and e-commerce partners handled over 200,000 direct shipments of iron supplements to customers in a single quarter.
Advancements in Supplement Formulations and Delivery Technologies
Innovation remains a key trend, with manufacturers introducing novel formulations that improve absorption and tolerability. Efforts include developing slow-release tablets, liquid suspensions, and microencapsulated powders. The Iron Supplements Market responds to consumer needs for convenience and palatability, launching chewable tablets and flavored gummies. It attracts a broader demographic, especially children and adults with swallowing difficulties. Enhanced formulations reduce common side effects such as gastrointestinal discomfort, driving higher adherence rates. Research-driven product launches maintain a competitive edge in the evolving supplement landscape.
Personalization and Targeted Supplement Solutions
Personalized nutrition gains traction, leading to custom iron supplement solutions tailored to individual health needs. Brands incorporate diagnostic tools and health assessments to recommend optimal dosages and formulations. The Iron Supplements Market benefits from collaborations with healthcare professionals and digital health platforms to provide evidence-based, individualized recommendations. It meets the demand for effective, outcome-oriented supplementation and fosters greater consumer engagement. Advances in nutrigenomics and wearable health technologies further support this trend. Personalization aligns with the broader shift towards holistic, consumer-centric healthcare.
Market Challenges Analysis
Concerns Over Side Effects and Limited Bioavailability
Gastrointestinal side effects and variable bioavailability present significant challenges for the Iron Supplements Market. Consumers often report discomforts such as constipation, nausea, and abdominal pain, which can discourage regular use and reduce adherence to supplementation regimens. The absorption rate of traditional iron salts remains low, leading to inefficient outcomes for some users. It prompts ongoing research into innovative formulations that enhance bioavailability while minimizing adverse reactions. Addressing these issues requires education and clear communication from manufacturers and healthcare professionals. Consumer reluctance due to negative experiences with side effects continues to impact overall market growth.
Regulatory Complexity and Quality Assurance Issues
Navigating diverse regulatory frameworks and ensuring consistent product quality remain hurdles for the Iron Supplements Market. Different countries impose varying standards on ingredient sourcing, labeling, and safety testing, which complicates global distribution strategies. It places pressure on manufacturers to maintain rigorous compliance while keeping pace with evolving regulations. The proliferation of counterfeit and substandard products, especially through online channels, raises concerns over safety and consumer trust. Rigorous quality assurance protocols and transparent supply chains become essential for market credibility. Addressing regulatory and quality challenges supports long-term growth and market stability.
Market Opportunities
Expansion into Emerging Markets and Untapped Demographics
Opportunities for the Iron Supplements Market lie in expanding access within emerging economies and reaching underserved demographic groups. Rapid urbanization and rising healthcare investments in Asia-Pacific, Latin America, and Africa create a favorable environment for market growth. It enables manufacturers to target populations with high prevalence of iron deficiency but limited awareness or access to supplementation. Tailoring product formats and educational initiatives for rural and low-income communities supports broader market penetration. Strategic partnerships with governments and non-governmental organizations facilitate distribution and awareness campaigns. Tapping into these markets strengthens the global footprint and unlocks significant revenue potential.
Product Innovation and Personalized Nutrition Solutions
Advancements in product development and personalized nutrition create new avenues for growth in the Iron Supplements Market. The trend toward tailored health solutions encourages brands to offer customizable iron supplements based on genetic, dietary, or lifestyle factors. It supports the adoption of diagnostic tools and digital health platforms that guide individualized supplementation plans. Manufacturers benefit from investing in novel delivery systems, such as gummies, liquid drops, or plant-based formulations, to address specific consumer preferences and needs. Collaborations with healthcare providers and technology companies drive innovation and credibility. Expanding the product portfolio with differentiated solutions positions brands to capture emerging market segments.
Market Segmentation Analysis:
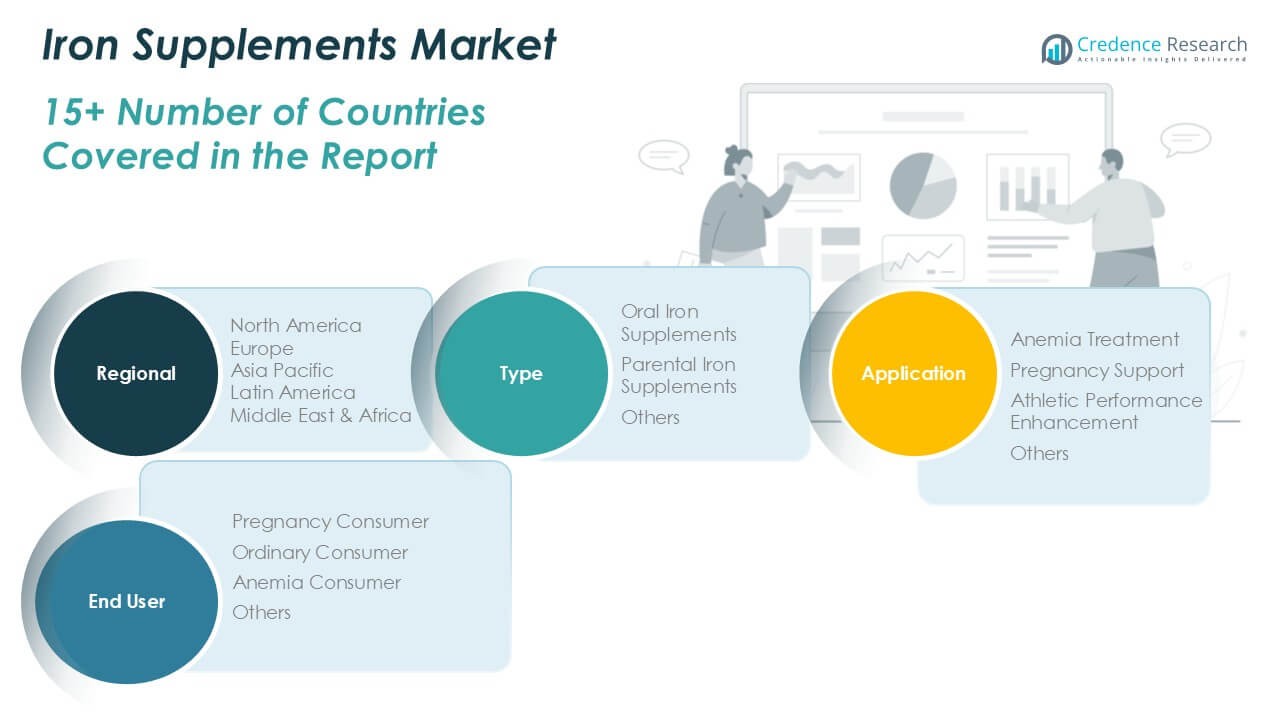
By Type:
Oral iron supplements represent the leading segment, reflecting strong consumer preference due to ease of administration and widespread availability in both prescription and over-the-counter forms. Parenteral iron supplements, which involve intravenous or intramuscular administration, serve individuals who cannot tolerate oral formulations or require rapid correction of iron deficiency. The “others” category encompasses emerging formulations and novel delivery systems targeting niche patient groups or specific clinical requirements.
- For instance, Vifor Pharma’s Ferinject® (ferric carboxymaltose) has become the most widely prescribed intravenous iron therapy in Europe, with more than 18 million patient treatments delivered since its introduction.
By Application:
Anemia treatment forms the core use case, supported by the high prevalence of iron deficiency anemia worldwide. Pregnancy support follows as a significant segment, with expectant mothers relying on iron supplements to prevent complications linked to maternal anemia and fetal development. Athletic performance enhancement constitutes another important application area, as athletes often use iron supplements to maintain optimal hemoglobin levels and improve endurance. The “others” application segment includes uses in chronic diseases, pediatrics, and general wellness.
- For instance, NovaFerrum’s pediatric liquid iron product has been dispensed in over 50,000 bottles for children’s health needs in the past year.
By End-User:
The market addresses distinct consumer groups. Pregnancy consumers make up a major end-user segment, driven by routine iron supplementation recommendations during prenatal care. Ordinary consumers, including individuals adopting iron supplements for general health or preventive purposes, account for steady demand. Anemia consumers represent a dedicated group requiring ongoing supplementation due to diagnosed iron deficiency conditions. The “others” end-user segment consists of children, elderly populations, and those with unique medical needs.
Segments:
Based on Type:
- Oral Iron Supplements
- Parenteral Iron Supplements
- Others
Based on Application:
- Anemia Treatment
- Pregnancy Support
- Athletic Performance Enhancement
- Others
Based on End User:
- Pregnancy Consumer
- Ordinary Consumer
- Anemia Consumer
- Others
Based on the Geography:
- North America
- Europe
- UK
- France
- Germany
- Italy
- Spain
- Russia
- Belgium
- Netherlands
- Austria
- Sweden
- Poland
- Denmark
- Switzerland
- Rest of Europe
- Asia Pacific
- China
- Japan
- South Korea
- India
- Australia
- Thailand
- Indonesia
- Vietnam
- Malaysia
- Philippines
- Taiwan
- Rest of Asia Pacific
- Latin America
- Brazil
- Argentina
- Peru
- Chile
- Colombia
- Rest of Latin America
- Middle East
- UAE
- KSA
- Israel
- Turkey
- Iran
- Rest of Middle East
- Africa
- Egypt
- Nigeria
- Algeria
- Morocco
- Rest of Africa
Regional Analysis
North America Iron Supplements Market
North America Iron Supplements Market grew from USD 1,003.08 million in 2018 to USD 1,308.29 million in 2024 and is projected to reach USD 1,861.46 million by 2032, reflecting a compound annual growth rate (CAGR) of 4.2%. North America is holding a 39% market share. The United States and Canada dominate this region, driven by high consumer awareness, widespread access to healthcare, and established retail channels. Demand for iron supplements benefits from proactive anemia screening and a strong focus on prenatal care. The region sees robust demand from both general wellness consumers and athletes. Product innovation and direct-to-consumer marketing further support market growth.
Europe Iron Supplements Market
Europe Iron Supplements Market grew from USD 536.60 million in 2018 to USD 673.69 million in 2024 and is forecasted to reach USD 879.43 million by 2032, posting a CAGR of 3.1%. Europe is holding a 18% market share. Germany, the United Kingdom, and France lead the region, supported by government health initiatives and rising health consciousness. Demand for iron supplements aligns with preventive healthcare trends and an aging population. Regulatory compliance and high product quality standards shape market competition. The market benefits from the integration of iron supplements into public health programs, especially for women and children.
Asia Pacific Iron Supplements Market
Asia Pacific Iron Supplements Market grew from USD 813.60 million in 2018 to USD 1,127.66 million in 2024 and is expected to reach USD 1,731.12 million by 2032, achieving a CAGR of 5.2%. Asia Pacific is holding a 36% market share. China, India, and Japan anchor regional demand, driven by large population bases and rising cases of iron deficiency anemia. Governments actively promote supplementation through maternal and child health programs. Economic growth and expanding healthcare infrastructure improve product accessibility. The market sees strong uptake among pregnant women and young children, with rising penetration in rural areas.
Latin America Iron Supplements Market
Latin America Iron Supplements Market grew from USD 88.11 million in 2018 to USD 114.28 million in 2024 and is anticipated to reach USD 136.58 million by 2032, registering a CAGR of 1.9%. Latin America is holding a 3% market share. Brazil and Mexico are key markets, influenced by public health campaigns and growing consumer awareness. The region faces challenges from variable healthcare access and affordability issues. Iron supplementation is mainly driven by maternal and pediatric needs. Urbanization and improvements in distribution support moderate market expansion.
Middle East Iron Supplements Market
Middle East Iron Supplements Market grew from USD 55.70 million in 2018 to USD 65.41 million in 2024 and is set to reach USD 73.74 million by 2032, recording a CAGR of 1.2%. The Middle East holds a 2% market share. The United Arab Emirates and Saudi Arabia are prominent markets, with demand influenced by rising awareness and government-led health initiatives. The region addresses iron deficiency through fortified foods and targeted supplementation programs. Healthcare investment and urban growth provide incremental opportunities for suppliers.
Africa Iron Supplements Market
Africa Iron Supplements Market grew from USD 46.65 million in 2018 to USD 66.99 million in 2024 and is forecast to reach USD 78.45 million by 2032, reflecting a CAGR of 1.7%. Africa is holding a 2% market share. South Africa and Egypt are leading contributors, with efforts focused on combating childhood and maternal anemia. Limited healthcare infrastructure presents ongoing challenges, but international aid and NGO interventions support market development. It serves high-need groups, driving steady demand for iron supplements across the continent.
Key Player Analysis
- Amieson
- Pronova Corporation
- Olly Nutrition
- Walgreens
- Mineral BioSciences
- Nature Made
- Ferro Sequels
- NovaFerrum
- Twinlab
- ACGrace
Competitive Analysis
The Iron Supplements Market features strong competition among established and emerging brands, with leading players including Amieson, Olly Nutrition, Nature Made, Walgreens, Mineral BioSciences, Ferro Sequels, NovaFerrum, Twinlab, and ACGrace. These companies compete on the basis of product quality, innovation, distribution reach, and brand reputation. Companies focus on research and development to create supplements with enhanced bioavailability, reduced side effects, and improved taste to meet the evolving needs of diverse consumer groups. Competitive strategies often include expanding distribution networks both online and offline, launching targeted marketing campaigns, and introducing new products that cater to specific demographics such as pregnant women, athletes, and children. Many organizations prioritize strategic partnerships with healthcare providers and retail chains to broaden their reach and ensure consistent availability of products. Investment in branding and consumer education initiatives further supports their efforts to build loyalty and maintain visibility in a crowded marketplace. The drive for continuous innovation and market expansion keeps the competitive landscape dynamic, with leading companies responding swiftly to regulatory changes and shifting consumer health trends.
Recent Developments
- In March 2025, Shield Therapeutics launched ACCRUFeR® in Canada for treating iron deficiency anemia, following Health Canada’s 2024 approval, in partnership with Kye Pharmaceuticals.
- In February 2025, Jamieson Wellness reported strong branded revenue growth (14% in 2024) and continued market share gains, driven by consumer demand for foundational health products, including iron supplements. The company highlighted innovation in natural solutions and expanded its presence in key markets such as China, Canada, and the U.S. Notably, Jamieson launched new GLP-1 support products in Q4 2024 and increased international engagement with its supplement range.
- In April 2023, the announcement was made by Lubrizol Life Science Health, which plans to introduce new vegan sweets that are high in iron content (10 mg each gummy).
Market Concentration & Characteristics
The Iron Supplements Market exhibits moderate concentration, with a mix of global brands and regional players shaping a competitive landscape defined by product diversity and targeted formulations. It offers a wide array of supplement types, including tablets, capsules, liquids, and powders, to address specific consumer needs across various age groups and health conditions. The market displays characteristics such as a strong emphasis on quality assurance, regulatory compliance, and continuous product innovation to improve bioavailability and minimize side effects. Demand is supported by rising health awareness and increased screening for iron deficiency, especially among pregnant women, children, and aging populations. Companies often focus on strategic collaborations with healthcare professionals, pharmacies, and online platforms to broaden their distribution networks. The Iron Supplements Market remains responsive to evolving scientific research and consumer trends, adapting to shifts in dietary habits, lifestyle changes, and growing interest in preventive healthcare worldwide.
Shape Your Report to Specific Countries or Regions & Enjoy 30% Off!
Report Coverage
The research report offers an in-depth analysis based on Type, Application, End-User and Geography. It details leading market players, providing an overview of their business, product offerings, investments, revenue streams, and key applications. Additionally, the report includes insights into the competitive environment, SWOT analysis, current market trends, as well as the primary drivers and constraints. Furthermore, it discusses various factors that have driven market expansion in recent years. The report also explores market dynamics, regulatory scenarios, and technological advancements that are shaping the industry. It assesses the impact of external factors and global economic changes on market growth. Lastly, it provides strategic recommendations for new entrants and established companies to navigate the complexities of the market.
Future Outlook
- The market will see greater emphasis on sustainability, with manufacturers adopting eco-friendly packaging and responsible sourcing of raw materials.
- Digital health tools and mobile applications will increasingly guide consumers in choosing and monitoring iron supplementation regimens.
- Increased investments in clinical research will generate more robust evidence supporting the efficacy and safety of new iron supplement formulations.
- The elderly population will represent a growing segment for iron supplements due to rising incidence of age-related anemia and chronic illnesses.
- Direct-to-consumer brands will continue to disrupt traditional retail models, offering subscription services and personalized product recommendations.
- Strategic marketing campaigns will educate consumers on the benefits of iron supplementation and counter misconceptions about side effects.
- Product lines will diversify, with innovations such as iron-fortified functional foods and beverages gaining popularity.
- Collaborations with public health organizations and governments will expand outreach and awareness programs, particularly in underserved regions.
- Enhanced traceability and transparency in the supply chain will become standard to ensure quality and build consumer confidence.
- The competitive landscape will intensify, driving continuous improvement in product quality, customer service, and consumer engagement across global markets.


