The Germany K-beauty Products Market is set to expand at a 7.40% CAGR, driven by rising interest in hydration-led routines and science-backed ingredients.CHAPTER NO. 1 : INTRODUCTION 33
1.1.1. Report Description 33
Purpose of the Report 33
USP & Key Offerings 33
1.1.2. Key Benefits for Stakeholders 33
1.1.3. Target Audience 34
1.1.4. Report Scope 34
1.1.5. Regional Scope 35
CHAPTER NO. 2 : EXECUTIVE SUMMARY 36
2.1. International Mobile Roaming Services Market Snapshot 36
2.1.1. Global International Mobile Roaming Services Market, 2018 – 2032 (USD Million) 38
CHAPTER NO. 3 : GEOPOLITICAL CRISIS IMPACT ANALYSIS 39
3.1. Russia-Ukraine and Israel-Palestine War Impacts 39
CHAPTER NO. 4 : INTERNATIONAL MOBILE ROAMING SERVICES MARKET – INDUSTRY ANALYSIS 40
4.1. Introduction 40
4.2. Market Drivers 41
4.2.1. Growth in International Travel and Tourism 41
4.2.2. Rising Adoption of Smartphones and High-Speed Mobile Broadband 42
4.3. Market Restraints 43
4.3.1. High Roaming Charges and Price Sensitivity 43
4.4. Market Opportunities 44
4.4.1. Market Opportunity Analysis 44
4.5. Porter’s Five Forces Analysis 45
CHAPTER NO. 5 : ANALYSIS COMPETITIVE LANDSCAPE 46
5.1. Company Market Share Analysis – 2024 46
5.1.1. Global International Mobile Roaming Services Market: Company Market Share, by Volume, 2024 46
5.1.2. Global International Mobile Roaming Services Market: Company Market Share, by Revenue, 2024 47
5.1.3. Global International Mobile Roaming Services Market: Top 6 Company Market Share, by Revenue, 2024 47
5.1.4. Global International Mobile Roaming Services Market: Top 3 Company Market Share, by Revenue, 2024 48
5.2. Global International Mobile Roaming Services Market Company Revenue Market Share, 2024 49
5.3. Company Assessment Metrics, 2024 50
5.3.1. Stars 50
5.3.2. Emerging Leaders 50
5.3.3. Pervasive Players 50
5.3.4. Participants 50
5.4. Start-ups /SMEs Assessment Metrics, 2024 50
5.4.1. Progressive Companies 50
5.4.2. Responsive Companies 50
5.4.3. Dynamic Companies 50
5.4.4. Starting Blocks 50
5.5. Strategic Developments 51
5.5.1. Acquisitions & Mergers 51
New Product Launch 51
Regional Expansion 51
5.6. Key Players Product Matrix 52
CHAPTER NO. 6 : PESTEL & ADJACENT MARKET ANALYSIS 53
6.1. PESTEL 53
6.1.1. Political Factors 53
6.1.2. Economic Factors 53
6.1.3. Social Factors 53
6.1.4. Technological Factors 53
6.1.5. Environmental Factors 53
6.1.6. Legal Factors 53
6.2. Adjacent Market Analysis 53
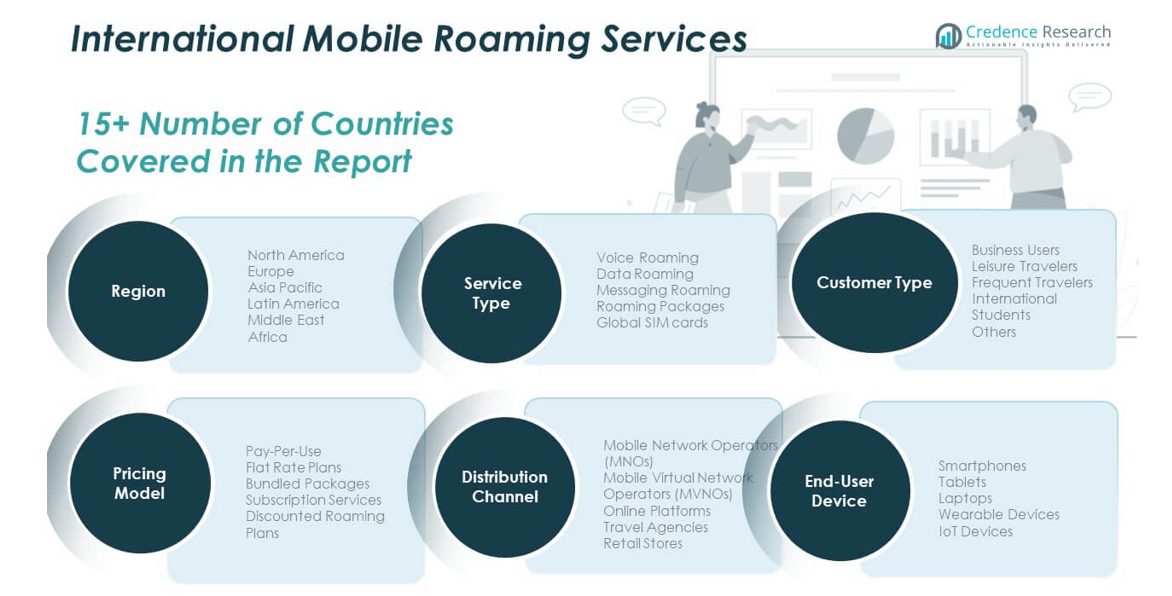
CHAPTER NO. 7 : INTERNATIONAL MOBILE ROAMING SERVICES MARKET – BY SERVICE TYPE SEGMENT ANALYSIS 54
7.1. International Mobile Roaming Services Market Overview, by Service Type Segment 54
7.1.1. International Mobile Roaming Services Market Revenue Share, By Service Type, 2023 & 2032 55
7.1.2. International Mobile Roaming Services Market Attractiveness Analysis, By Service Type 56
7.1.3. Incremental Revenue Growth Opportunity, by Service Type, 2024 – 2032 56
7.1.4. International Mobile Roaming Services Market Revenue, By Service Type, 2018, 2023, 2027 & 2032 57
7.2. Voice Roaming 58
7.2.1. Global Voice Roaming International Mobile Roaming Services Market Revenue, By Region, 2018 – 2023 (USD Million) 59
7.2.2. Global Voice Roaming International Mobile Roaming Services Market Revenue, By Region, 2024 – 2032 (USD Million) 59
7.3. Data Roaming 60
7.3.1. Global Data Roaming International Mobile Roaming Services Market Revenue, By Region, 2018 – 2023 (USD Million) 61
7.3.2. Global Data Roaming International Mobile Roaming Services Market Revenue, By Region, 2024 – 2032 (USD Million) 61
7.4. Messaging Roaming 62
7.4.1. Global Messaging Roaming International Mobile Roaming Services Market Revenue, By Region, 2018 – 2023 (USD Million) 63
7.4.2. Global Messaging Roaming International Mobile Roaming Services Market Revenue, By Region, 2024 – 2032 (USD Million) 63
7.5. Roaming Packages 64
7.5.1. Global Roaming Packages International Mobile Roaming Services Market Revenue, By Region, 2018 – 2023 (USD Million) 65
7.5.2. Global Roaming Packages International Mobile Roaming Services Market Revenue, By Region, 2024 – 2032 (USD Million) 65
7.6. Global SIM cards 66
7.6.1. Global Global SIM cards International Mobile Roaming Services Market Revenue, By Region, 2018 – 2023 (USD Million) 67
7.6.2. Global SIM cards International Mobile Roaming Services Market Revenue, By Region, 2024 – 2032 (USD Million) 67
CHAPTER NO. 8 : INTERNATIONAL MOBILE ROAMING SERVICES MARKET – BY CUSTOMER TYPE SEGMENT ANALYSIS 68
8.1. International Mobile Roaming Services Market Overview, by Customer Type Segment 68
8.1.1. International Mobile Roaming Services Market Revenue Share, By Customer Type, 2023 & 2032 69
8.1.2. International Mobile Roaming Services Market Attractiveness Analysis, By Customer Type 70
8.1.3. Incremental Revenue Growth Opportunity, by Customer Type, 2024 – 2032 70
8.1.4. International Mobile Roaming Services Market Revenue, By Customer Type, 2018, 2023, 2027 & 2032 71
8.2. Business Users 72
8.2.1. Global Business Users International Mobile Roaming Services Market Revenue, By Region, 2018 – 2023 (USD Million) 73
8.2.2. Global Business Users International Mobile Roaming Services Market Revenue, By Region, 2024 – 2032 (USD Million) 73
8.3. Leisure Travelers 74
8.3.1. Global Leisure Travelers International Mobile Roaming Services Market Revenue, By Region, 2018 – 2023 (USD Million) 75
8.3.2. Global Leisure Travelers International Mobile Roaming Services Market Revenue, By Region, 2024 – 2032 (USD Million) 75
8.4. Frequent Travelers 76
8.4.1. Global Frequent Travelers International Mobile Roaming Services Market Revenue, By Region, 2018 – 2023 (USD Million) 77
8.4.2. Global Frequent Travelers International Mobile Roaming Services Market Revenue, By Region, 2024 – 2032 (USD Million) 77
8.5. International Students 78
8.5.1. Global International Students International Mobile Roaming Services Market Revenue, By Region, 2018 – 2023 (USD Million) 79
8.5.2. Global International Students International Mobile Roaming Services Market Revenue, By Region, 2024 – 2032 (USD Million) 79
8.6. Others 80
8.6.1. Global Others International Mobile Roaming Services Market Revenue, By Region, 2018 – 2023 (USD Million) 81
8.6.2. Global Others International Mobile Roaming Services Market Revenue, By Region, 2024 – 2032 (USD Million) 81
CHAPTER NO. 9 : INTERNATIONAL MOBILE ROAMING SERVICES MARKET – BY END-USER DEVICE SEGMENT ANALYSIS 82
9.1. International Mobile Roaming Services Market Overview, by End-user Device Segment 82
9.1.1. International Mobile Roaming Services Market Revenue Share, By End-user, 2023 & 2032 83
9.1.2. International Mobile Roaming Services Market Attractiveness Analysis, By End-user 84
9.1.3. Incremental Revenue Growth Opportunity, by End-user, 2024 – 2032 84
9.1.4. International Mobile Roaming Services Market Revenue, By End-user, 2018, 2023, 2027 & 2032 85
9.2. Smartphones 86
9.2.1. Global Smartphones International Mobile Roaming Services Market Revenue, By Region, 2018 – 2023 (USD Million) 87
9.2.2. Global Smartphones International Mobile Roaming Services Market Revenue, By Region, 2024 – 2032 (USD Million) 87
9.3. Tablets 88
9.3.1. Global Tablets International Mobile Roaming Services Market Revenue, By Region, 2018 – 2023 (USD Million) 89
9.3.2. Global Tablets International Mobile Roaming Services Market Revenue, By Region, 2024 – 2032 (USD Million) 89
9.4. Laptops 90
9.4.1. Global Laptops International Mobile Roaming Services Market Revenue, By Region, 2018 – 2023 (USD Million) 91
9.4.2. Global Laptops International Mobile Roaming Services Market Revenue, By Region, 2024 – 2032 (USD Million) 91
9.5. Wearable Devices 92
9.5.1. Global Wearable Devices International Mobile Roaming Services Market Revenue, By Region, 2018 – 2023 (USD Million) 93
9.5.2. Global Wearable Devices International Mobile Roaming Services Market Revenue, By Region, 2024 – 2032 (USD Million) 93
9.6. IoT Devices 94
9.6.1. Global IoT Devices International Mobile Roaming Services Market Revenue, By Region, 2018 – 2023 (USD Million) 95
9.6.2. Global IoT Devices International Mobile Roaming Services Market Revenue, By Region, 2024 – 2032 (USD Million) 95
CHAPTER NO. 10 : INTERNATIONAL MOBILE ROAMING SERVICES MARKET – BY PRICING MODEL SEGMENT ANALYSIS 96
10.1. International Mobile Roaming Services Market Overview, by Pricing Model Segment 96
10.1.1. International Mobile Roaming Services Market Revenue Share, By Pricing Model, 2023 & 2032 97
10.1.2. International Mobile Roaming Services Market Attractiveness Analysis, By Pricing Model 98
10.1.3. Incremental Revenue Growth Opportunity, by Pricing Model, 2024 – 2032 98
10.1.4. International Mobile Roaming Services Market Revenue, By Pricing Model, 2018, 2023, 2027 & 2032 99
10.2. Pay-Per-Use 100
10.2.1. Global Pay-Per-Use International Mobile Roaming Services Market Revenue, By Region, 2018 – 2023 (USD Million) 101
10.2.2. Global Pay-Per-Use International Mobile Roaming Services Market Revenue, By Region, 2024 – 2032 (USD Million) 101
10.3. Flat Rate Plans 102
10.3.1. Global Flat Rate Plans International Mobile Roaming Services Market Revenue, By Region, 2018 – 2023 (USD Million) 103
10.3.2. Global Flat Rate Plans International Mobile Roaming Services Market Revenue, By Region, 2024 – 2032 (USD Million) 103
10.4. Bundled Packages 104
10.4.1. Global Bundled Packages International Mobile Roaming Services Market Revenue, By Region, 2018 – 2023 (USD Million) 105
10.4.2. Global Bundled Packages International Mobile Roaming Services Market Revenue, By Region, 2024 – 2032 (USD Million) 105
10.5. Subscription Services 106
10.5.1. Global Subscription Services International Mobile Roaming Services Market Revenue, By Region, 2018 – 2023 (USD Million) 107
10.5.2. Global Subscription Services International Mobile Roaming Services Market Revenue, By Region, 2024 – 2032 (USD Million) 107
10.6. Discounted Roaming Plans 108
10.6.1. Global Discounted Roaming Plans International Mobile Roaming Services Market Revenue, By Region, 2018 – 2023 (USD Million) 109
10.6.2. Global Discounted Roaming Plans International Mobile Roaming Services Market Revenue, By Region, 2024 – 2032 (USD Million) 109
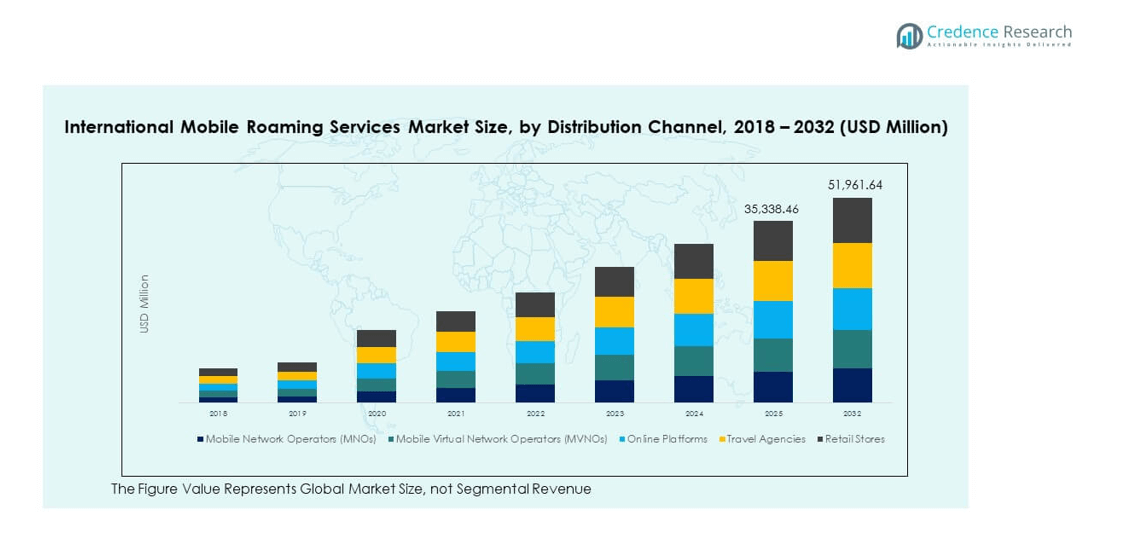
CHAPTER NO. 11 : INTERNATIONAL MOBILE ROAMING SERVICES MARKET – BY DISTRIBUTION CHANNEL SEGMENT ANALYSIS 110
11.1. International Mobile Roaming Services Market Overview, by Distribution Channel Segment 110
11.1.1. International Mobile Roaming Services Market Revenue Share, By Distribution Channel, 2023 & 2032 111
11.1.2. International Mobile Roaming Services Market Attractiveness Analysis, By Distribution Channel 112
11.1.3. Incremental Revenue Growth Opportunity, by Distribution Channel, 2024 – 2032 112
11.1.4. International Mobile Roaming Services Market Revenue, By Distribution Channel, 2018, 2023, 2027 & 2032 113
11.2. Mobile Network Operators (MNOs) 114
11.2.1. Global Mobile Network Operators (MNOs) International Mobile Roaming Services Market Revenue, By Region, 2018 – 2023 (USD Million) 115
11.2.2. Global Mobile Network Operators (MNOs) International Mobile Roaming Services Market Revenue, By Region, 2024 – 2032 (USD Million) 115
11.3. Mobile Virtual Network Operators (MVNOs) 116
11.3.1. Global Mobile Virtual Network Operators (MVNOs) International Mobile Roaming Services Market Revenue, By Region, 2018 – 2023 (USD Million) 117
11.3.2. Global Mobile Virtual Network Operators (MVNOs) International Mobile Roaming Services Market Revenue, By Region, 2024 – 2032 (USD Million) 117
11.4. Online Platforms 118
11.4.1. Global Online Platforms International Mobile Roaming Services Market Revenue, By Region, 2018 – 2023 (USD Million) 119
11.4.2. Global Online Platforms International Mobile Roaming Services Market Revenue, By Region, 2024 – 2032 (USD Million) 119
11.5. Travel Agencies 120
11.5.1. Global Travel Agencies International Mobile Roaming Services Market Revenue, By Region, 2018 – 2023 (USD Million) 121
11.5.2. Global Travel Agencies International Mobile Roaming Services Market Revenue, By Region, 2024 – 2032 (USD Million) 121
11.6. Retail Stores 122
11.6.1. Global Retail Stores International Mobile Roaming Services Market Revenue, By Region, 2018 – 2023 (USD Million) 123
11.6.2. Global Retail Stores International Mobile Roaming Services Market Revenue, By Region, 2024 – 2032 (USD Million) 123
CHAPTER NO. 12 : INTERNATIONAL MOBILE ROAMING SERVICES MARKET – REGIONAL ANALYSIS 124
12.1. International Mobile Roaming Services Market Overview, by Regional Segments 124
12.2. Region 125
12.2.1. Global International Mobile Roaming Services Market Revenue Share, By Region, 2023 & 2032 125
12.2.2. International Mobile Roaming Services Market Attractiveness Analysis, By Region 126
12.2.3. Incremental Revenue Growth Opportunity, by Region, 2024 – 2032 126
12.2.4. International Mobile Roaming Services Market Revenue, By Region, 2018, 2023, 2027 & 2032 127
12.2.5. Global International Mobile Roaming Services Market Revenue, By Region, 2018 – 2023 (USD Million) 128
12.2.6. Global International Mobile Roaming Services Market Revenue, By Region, 2024 – 2032 (USD Million) 128
12.3. Service Type 129
12.3.1. Global International Mobile Roaming Services Market Revenue, By Service Type, 2018 – 2023 (USD Million) 129
12.4. Global International Mobile Roaming Services Market Revenue, By Service Type, 2024 – 2032 (USD Million) 129
12.5. Customer Type 130
12.5.1. Global International Mobile Roaming Services Market Revenue, By Customer Type, 2018 – 2023 (USD Million) 130
12.5.2. Global International Mobile Roaming Services Market Revenue, By Customer Type, 2024 – 2032 (USD Million) 130
12.6. End-user 131
12.6.1. Global International Mobile Roaming Services Market Revenue, By End-user, 2018 – 2023 (USD Million) 131
12.6.2. Global International Mobile Roaming Services Market Revenue, By End-user, 2024 – 2032 (USD Million) 131
12.7. Pricing Model 132
12.7.1. Global International Mobile Roaming Services Market Revenue, By Pricing Model, 2018 – 2023 (USD Million) 132
12.7.2. Global International Mobile Roaming Services Market Revenue, By Pricing Model, 2024 – 2032 (USD Million) 132
12.8. Distribution Channel 133
12.8.1. Global International Mobile Roaming Services Market Revenue, By Distribution Channel, 2018 – 2023 (USD Million) 133
12.8.2. Global International Mobile Roaming Services Market Revenue, By Distribution Channel, 2024 – 2032 (USD Million) 133
CHAPTER NO. 13 : INTERNATIONAL MOBILE ROAMING SERVICES MARKET – NORTH AMERICA 135
13.1. North America 135
13.1.1. Key Highlights 135
13.1.2. North America International Mobile Roaming Services Market Revenue, By Country, 2018 – 2023 (USD Million) 136
13.1.3. North America International Mobile Roaming Services Market Revenue, By Service Type, 2018 – 2023 (USD Million) 137
13.1.4. North America International Mobile Roaming Services Market Revenue, By Customer Type, 2018 – 2023 (USD Million) 138
13.1.5. North America International Mobile Roaming Services Market Revenue, By End-user, 2018 – 2023 (USD Million) 139
13.1.6. North America International Mobile Roaming Services Market Revenue, By Pricing Model, 2018 – 2023 (USD Million) 140
13.1.7. North America International Mobile Roaming Services Market Revenue, By Distribution Channel, 2018 – 2023 (USD Million) 141
13.2. U.S. 142
13.3. Canada 142
13.4. Mexico 142
CHAPTER NO. 14 : INTERNATIONAL MOBILE ROAMING SERVICES MARKET – EUROPE 143
14.1. Europe 143
14.1.1. Key Highlights 143
14.1.2. Europe International Mobile Roaming Services Market Revenue, By Country, 2018 – 2023 (USD Million) 144
14.1.3. Europe International Mobile Roaming Services Market Revenue, By Service Type, 2018 – 2023 (USD Million) 145
14.1.4. Europe International Mobile Roaming Services Market Revenue, By Customer Type, 2018 – 2023 (USD Million) 146
14.1.5. Europe International Mobile Roaming Services Market Revenue, By End-user, 2018 – 2023 (USD Million) 147
14.1.6. Europe International Mobile Roaming Services Market Revenue, By Pricing Model, 2018 – 2023 (USD Million) 148
14.1.7. Europe International Mobile Roaming Services Market Revenue, By Distribution Channel, 2018 – 2023 (USD Million) 149
14.2. UK 150
14.3. France 150
14.4. Germany 150
14.5. Italy 150
14.6. Spain 150
14.7. Russia 150
14.8. Belgium 150
14.9. Netherland 150
14.10. Austria 150
14.11. Sweden 150
14.12. Poland 150
14.13. Denmark 150
14.14. Switzerland 150
14.15. Rest of Europe 150
CHAPTER NO. 15 : INTERNATIONAL MOBILE ROAMING SERVICES MARKET – ASIA PACIFIC 151
15.1. Asia Pacific 151
15.1.1. Key Highlights 151
15.1.2. Asia Pacific International Mobile Roaming Services Market Revenue, By Country, 2018 – 2023 (USD Million) 152
15.1.3. Asia Pacific International Mobile Roaming Services Market Revenue, By Service Type, 2018 – 2023 (USD Million) 153
15.1.4. Asia Pacific International Mobile Roaming Services Market Revenue, By Customer Type, 2018 – 2023 (USD Million) 154
15.1.5. Asia Pacific International Mobile Roaming Services Market Revenue, By End-user, 2018 – 2023 (USD Million) 155
15.1.6. Asia Pacific International Mobile Roaming Services Market Revenue, By Pricing Model, 2018 – 2023 (USD Million) 156
15.1.7. Asia Pacific International Mobile Roaming Services Market Revenue, By Distribution Channel, 2018 – 2023 (USD Million) 157
15.2. China 158
15.3. Japan 158
15.4. South Korea 158
15.5. India 158
15.6. Australia 158
15.7. Thailand 158
15.8. Indonesia 158
15.9. Vietnam 158
15.10. Malaysia 158
15.11. Philippines 158
15.12. Taiwan 158
15.13. Rest of Asia Pacific 158
CHAPTER NO. 16 : INTERNATIONAL MOBILE ROAMING SERVICES MARKET – LATIN AMERICA 159
16.1. Latin America 159
16.1.1. Key Highlights 159
16.1.2. Latin America International Mobile Roaming Services Market Revenue, By Country, 2018 – 2023 (USD Million) 160
16.1.3. Latin America International Mobile Roaming Services Market Revenue, By Service Type, 2018 – 2023 (USD Million) 161
16.1.4. Latin America International Mobile Roaming Services Market Revenue, By Customer Type, 2018 – 2023 (USD Million) 162
16.1.5. Latin America International Mobile Roaming Services Market Revenue, By End-user, 2018 – 2023 (USD Million) 163
16.1.6. Latin America International Mobile Roaming Services Market Revenue, By Pricing Model, 2018 – 2023 (USD Million) 164
16.1.7. Latin America International Mobile Roaming Services Market Revenue, By Distribution Channel, 2018 – 2023 (USD Million) 165
16.2. Brazil 166
16.3. Argentina 166
16.4. Peru 166
16.5. Chile 166
16.6. Colombia 166
16.7. Rest of Latin America 166
CHAPTER NO. 17 : INTERNATIONAL MOBILE ROAMING SERVICES MARKET – MIDDLE EAST 167
17.1. Middle East 167
17.1.1. Key Highlights 167
17.1.2. Middle East International Mobile Roaming Services Market Revenue, By Country, 2018 – 2023 (USD Million) 168
17.1.3. Middle East International Mobile Roaming Services Market Revenue, By Service Type, 2018 – 2023 (USD Million) 169
17.1.4. Middle East International Mobile Roaming Services Market Revenue, By Customer Type, 2018 – 2023 (USD Million) 170
17.1.5. Middle East International Mobile Roaming Services Market Revenue, By End-user, 2018 – 2023 (USD Million) 171
17.1.6. Middle East International Mobile Roaming Services Market Revenue, By Pricing Model, 2018 – 2023 (USD Million) 172
17.1.7. Middle East International Mobile Roaming Services Market Revenue, By Distribution Channel, 2018 – 2023 (USD Million) 173
17.2. UAE 174
17.3. KSA 174
17.4. Israel 174
17.5. Turkey 174
17.6. Iran 174
17.7. Rest of Middle East 174
CHAPTER NO. 18 : INTERNATIONAL MOBILE ROAMING SERVICES MARKET – AFRICA 175
18.1. Africa 175
18.1.1. Key Highlights 175
18.1.2. Africa International Mobile Roaming Services Market Revenue, By Country, 2018 – 2023 (USD Million) 176
18.1.3. Africa International Mobile Roaming Services Market Revenue, By Service Type, 2018 – 2023 (USD Million) 177
18.1.4. Africa International Mobile Roaming Services Market Revenue, By Customer Type, 2018 – 2023 (USD Million) 178
18.1.5. Africa International Mobile Roaming Services Market Revenue, By End-user, 2018 – 2023 (USD Million) 179
18.1.6. Africa International Mobile Roaming Services Market Revenue, By Pricing Model, 2018 – 2023 (USD Million) 180
18.1.7. Africa International Mobile Roaming Services Market Revenue, By Distribution Channel, 2018 – 2023 (USD Million) 181
18.2. Egypt 182
18.3. Nigeria 182
18.4. Algeria 182
18.5. Morocco 182
18.6. Rest of Africa 182
CHAPTER NO. 19 : COMPANY PROFILES 183
19.1. Cellusys 183
19.1.1. Company Overview 183
19.1.2. Product Portfolio 183
19.1.3. Swot Analysis 183
19.1.4. Business Strategy 184
19.1.5. Financial Overview 184
19.2. Comfone 185
19.3. BICS 185
19.4. Orange 185
19.5. Roamability 185
19.6. TOMIA 185
19.7. Syniverse 185
19.8. TNS 185
19.9. Telefonica Global Solutions 185
19.10. Vodafone 185
19.11. iBasis 185
19.12. Tango Telecom 185
19.13. Company 13 185
19.14. Company 14 185
List of Figures
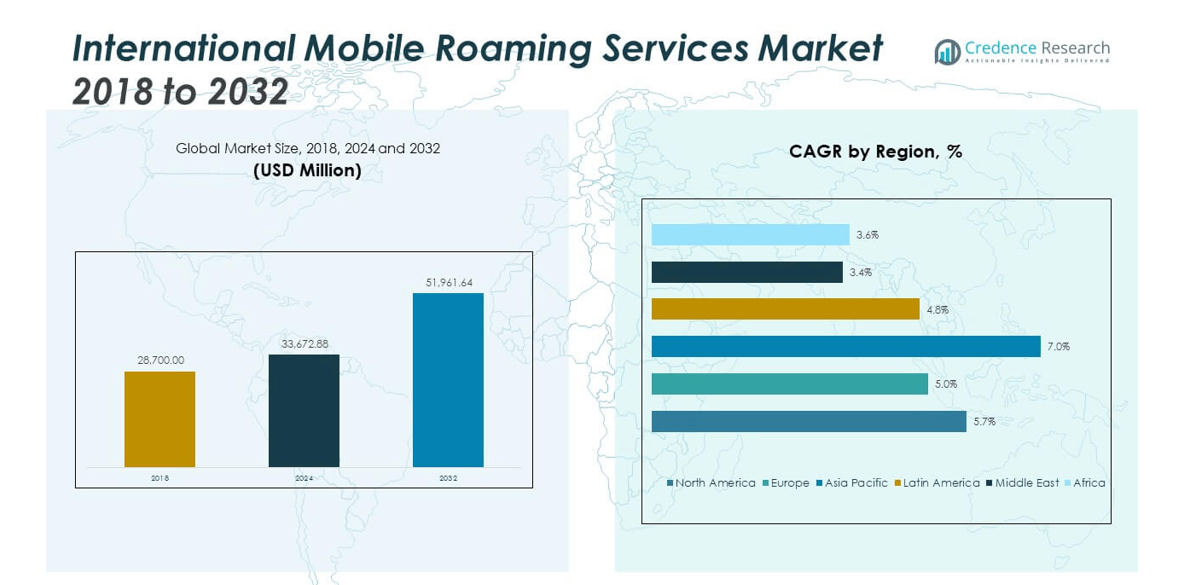
FIG NO. 1. Global International Mobile Roaming Services Market Revenue, 2018 – 2032 (USD Million) 38
FIG NO. 2. Porter’s Five Forces Analysis for Global International Mobile Roaming Services Market 45
FIG NO. 3. Company Share Analysis, 2024 46
FIG NO. 4. Company Share Analysis, 2024 47
FIG NO. 5. Company Share Analysis, 2024 47
FIG NO. 6. Company Share Analysis, 2024 48
FIG NO. 7. International Mobile Roaming Services Market – Company Revenue Market Share, 2024 49
FIG NO. 8. International Mobile Roaming Services Market Revenue Share, By Service Type, 2023 & 2032 55
FIG NO. 9. Market Attractiveness Analysis, By Service Type 56
FIG NO. 10. Incremental Revenue Growth Opportunity by Service Type, 2024 – 2032 56
FIG NO. 11. International Mobile Roaming Services Market Revenue, By Service Type, 2018, 2023, 2027 & 2032 57
FIG NO. 12. Global International Mobile Roaming Services Market for Voice Roaming, Revenue (USD Million) 2018 – 2032 58
FIG NO. 13. Global International Mobile Roaming Services Market for Data Roaming, Revenue (USD Million) 2018 – 2032 60
FIG NO. 14. Global International Mobile Roaming Services Market for Messaging Roaming, Revenue (USD Million) 2018 – 2032 62
FIG NO. 15. Global International Mobile Roaming Services Market for Roaming Packages, Revenue (USD Million) 2018 – 2032 64
FIG NO. 16. Global International Mobile Roaming Services Market for Global SIM cards, Revenue (USD Million) 2018 – 2032 66
FIG NO. 17. International Mobile Roaming Services Market Revenue Share, By Customer Type, 2023 & 2032 69
FIG NO. 18. Market Attractiveness Analysis, By Customer Type 70
FIG NO. 19. Incremental Revenue Growth Opportunity by Customer Type, 2024 – 2032 70
FIG NO. 20. International Mobile Roaming Services Market Revenue, By Customer Type, 2018, 2023, 2027 & 2032 71
FIG NO. 21. Global International Mobile Roaming Services Market for Business Users, Revenue (USD Million) 2018 – 2032 72
FIG NO. 22. Global International Mobile Roaming Services Market for Leisure Travelers, Revenue (USD Million) 2018 – 2032 74
FIG NO. 23. Global International Mobile Roaming Services Market for Frequent Travelers, Revenue (USD Million) 2018 – 2032 76
FIG NO. 24. Global International Mobile Roaming Services Market for International Students, Revenue (USD Million) 2018 – 2032 78
FIG NO. 25. Global International Mobile Roaming Services Market for Others, Revenue (USD Million) 2018 – 2032 80
FIG NO. 26. International Mobile Roaming Services Market Revenue Share, By End-user, 2023 & 2032 83
FIG NO. 27. Market Attractiveness Analysis, By End-user 84
FIG NO. 28. Incremental Revenue Growth Opportunity by End-user, 2024 – 2032 84
FIG NO. 29. International Mobile Roaming Services Market Revenue, By End-user, 2018, 2023, 2027 & 2032 85
FIG NO. 30. Global International Mobile Roaming Services Market for Smartphones, Revenue (USD Million) 2018 – 2032 86
FIG NO. 31. Global International Mobile Roaming Services Market for Tablets, Revenue (USD Million) 2018 – 2032 88
FIG NO. 32. Global International Mobile Roaming Services Market for Laptops, Revenue (USD Million) 2018 – 2032 90
FIG NO. 33. Global International Mobile Roaming Services Market for Wearable Devices, Revenue (USD Million) 2018 – 2032 92
FIG NO. 34. Global International Mobile Roaming Services Market for IoT Devices, Revenue (USD Million) 2018 – 2032 94
FIG NO. 35. International Mobile Roaming Services Market Revenue Share, By Pricing Model, 2023 & 2032 97
FIG NO. 36. Market Attractiveness Analysis, By Pricing Model 98
FIG NO. 37. Incremental Revenue Growth Opportunity by Pricing Model, 2024 – 2032 98
FIG NO. 38. International Mobile Roaming Services Market Revenue, By Pricing Model, 2018, 2023, 2027 & 2032 99
FIG NO. 39. Global International Mobile Roaming Services Market for Pay-Per-Use, Revenue (USD Million) 2018 – 2032 100
FIG NO. 40. Global International Mobile Roaming Services Market for Flat Rate Plans, Revenue (USD Million) 2018 – 2032 102
FIG NO. 41. Global International Mobile Roaming Services Market for Bundled Packages, Revenue (USD Million) 2018 – 2032 104
FIG NO. 42. Global International Mobile Roaming Services Market for Subscription Services, Revenue (USD Million) 2018 – 2032 106
FIG NO. 43. Global International Mobile Roaming Services Market for Discounted Roaming Plans, Revenue (USD Million) 2018 – 2032 108
FIG NO. 44. International Mobile Roaming Services Market Revenue Share, By Distribution Channel, 2023 & 2032 111
FIG NO. 45. Market Attractiveness Analysis, By Distribution Channel 112
FIG NO. 46. Incremental Revenue Growth Opportunity by Distribution Channel, 2024 – 2032 112
FIG NO. 47. International Mobile Roaming Services Market Revenue, By Distribution Channel, 2018, 2023, 2027 & 2032 113
FIG NO. 48. Global International Mobile Roaming Services Market for Mobile Network Operators (MNOs), Revenue (USD Million) 2018 – 2032 114
FIG NO. 49. Global International Mobile Roaming Services Market for Mobile Virtual Network Operators (MVNOs), Revenue (USD Million) 2018 – 2032 116
FIG NO. 50. Global International Mobile Roaming Services Market for Online Platforms, Revenue (USD Million) 2018 – 2032 118
FIG NO. 51. Global International Mobile Roaming Services Market for Travel Agencies, Revenue (USD Million) 2018 – 2032 120
FIG NO. 52. Global International Mobile Roaming Services Market for Retail Stores, Revenue (USD Million) 2018 – 2032 122
FIG NO. 53. Global International Mobile Roaming Services Market Revenue Share, By Region, 2023 & 2032 125
FIG NO. 54. Market Attractiveness Analysis, By Region 126
FIG NO. 55. Incremental Revenue Growth Opportunity by Region, 2024 – 2032 126
FIG NO. 56. International Mobile Roaming Services Market Revenue, By Region, 2018, 2023, 2027 & 2032 127
FIG NO. 57. North America International Mobile Roaming Services Market Revenue, 2018 – 2032 (USD Million) 135
FIG NO. 58. Europe International Mobile Roaming Services Market Revenue, 2018 – 2032 (USD Million) 143
FIG NO. 59. Asia Pacific International Mobile Roaming Services Market Revenue, 2018 – 2032 (USD Million) 151
FIG NO. 60. Latin America International Mobile Roaming Services Market Revenue, 2018 – 2032 (USD Million) 159
FIG NO. 61. Middle East International Mobile Roaming Services Market Revenue, 2018 – 2032 (USD Million) 167
FIG NO. 62. Africa International Mobile Roaming Services Market Revenue, 2018 – 2032 (USD Million) 175
List of Tables
TABLE NO. 1. : Global International Mobile Roaming Services Market: Snapshot 36
TABLE NO. 2. : Drivers for the International Mobile Roaming Services Market: Impact Analysis 41
TABLE NO. 3. : Restraints for the International Mobile Roaming Services Market: Impact Analysis 43
TABLE NO. 4. : Global Voice Roaming International Mobile Roaming Services Market Revenue, By Region, 2018 – 2023 (USD Million) 59
TABLE NO. 5. : Global Voice Roaming International Mobile Roaming Services Market Revenue, By Region, 2024 – 2032 (USD Million) 59
TABLE NO. 6. : Global Data Roaming International Mobile Roaming Services Market Revenue, By Region, 2018 – 2023 (USD Million) 61
TABLE NO. 7. : Global Data Roaming International Mobile Roaming Services Market Revenue, By Region, 2024 – 2032 (USD Million) 61
TABLE NO. 8. : Global Messaging Roaming International Mobile Roaming Services Market Revenue, By Region, 2018 – 2023 (USD Million) 63
TABLE NO. 9. : Global Messaging Roaming International Mobile Roaming Services Market Revenue, By Region, 2024 – 2032 (USD Million) 63
TABLE NO. 10. : Global Roaming Packages International Mobile Roaming Services Market Revenue, By Region, 2018 – 2023 (USD Million) 65
TABLE NO. 11. : Global Roaming Packages International Mobile Roaming Services Market Revenue, By Region, 2024 – 2032 (USD Million) 65
TABLE NO. 12. : Global Global SIM cards International Mobile Roaming Services Market Revenue, By Region, 2018 – 2023 (USD Million) 67
TABLE NO. 13. : Global Global SIM cards International Mobile Roaming Services Market Revenue, By Region, 2024 – 2032 (USD Million) 67
TABLE NO. 14. : Global Business Users International Mobile Roaming Services Market Revenue, By Region, 2018 – 2023 (USD Million) 73
TABLE NO. 15. : Global Business Users International Mobile Roaming Services Market Revenue, By Region, 2024 – 2032 (USD Million) 73
TABLE NO. 16. : Global Leisure Travelers International Mobile Roaming Services Market Revenue, By Region, 2018 – 2023 (USD Million) 75
TABLE NO. 17. : Global Leisure Travelers International Mobile Roaming Services Market Revenue, By Region, 2024 – 2032 (USD Million) 75
TABLE NO. 18. : Global Frequent Travelers International Mobile Roaming Services Market Revenue, By Region, 2018 – 2023 (USD Million) 77
TABLE NO. 19. : Global Frequent Travelers International Mobile Roaming Services Market Revenue, By Region, 2024 – 2032 (USD Million) 77
TABLE NO. 20. : Global International Students International Mobile Roaming Services Market Revenue, By Region, 2018 – 2023 (USD Million) 79
TABLE NO. 21. : Global International Students International Mobile Roaming Services Market Revenue, By Region, 2024 – 2032 (USD Million) 79
TABLE NO. 22. : Global Others International Mobile Roaming Services Market Revenue, By Region, 2018 – 2023 (USD Million) 81
TABLE NO. 23. : Global Others International Mobile Roaming Services Market Revenue, By Region, 2024 – 2032 (USD Million) 81
TABLE NO. 24. : Global Smartphones International Mobile Roaming Services Market Revenue, By Region, 2018 – 2023 (USD Million) 87
TABLE NO. 25. : Global Smartphones International Mobile Roaming Services Market Revenue, By Region, 2024 – 2032 (USD Million) 87
TABLE NO. 26. : Global Tablets International Mobile Roaming Services Market Revenue, By Region, 2018 – 2023 (USD Million) 89
TABLE NO. 27. : Global Tablets International Mobile Roaming Services Market Revenue, By Region, 2024 – 2032 (USD Million) 89
TABLE NO. 28. : Global Laptops International Mobile Roaming Services Market Revenue, By Region, 2018 – 2023 (USD Million) 91
TABLE NO. 29. : Global Laptops International Mobile Roaming Services Market Revenue, By Region, 2024 – 2032 (USD Million) 91
TABLE NO. 30. : Global Wearable Devices International Mobile Roaming Services Market Revenue, By Region, 2018 – 2023 (USD Million) 93
TABLE NO. 31. : Global Wearable Devices International Mobile Roaming Services Market Revenue, By Region, 2024 – 2032 (USD Million) 93
TABLE NO. 32. : Global IoT Devices International Mobile Roaming Services Market Revenue, By Region, 2018 – 2023 (USD Million) 95
TABLE NO. 33. : Global IoT Devices International Mobile Roaming Services Market Revenue, By Region, 2024 – 2032 (USD Million) 95
TABLE NO. 34. : Global Pay-Per-Use International Mobile Roaming Services Market Revenue, By Region, 2018 – 2023 (USD Million) 101
TABLE NO. 35. : Global Pay-Per-Use International Mobile Roaming Services Market Revenue, By Region, 2024 – 2032 (USD Million) 101
TABLE NO. 36. : Global Flat Rate Plans International Mobile Roaming Services Market Revenue, By Region, 2018 – 2023 (USD Million) 103
TABLE NO. 37. : Global Flat Rate Plans International Mobile Roaming Services Market Revenue, By Region, 2024 – 2032 (USD Million) 103
TABLE NO. 38. : Global Bundled Packages International Mobile Roaming Services Market Revenue, By Region, 2018 – 2023 (USD Million) 105
TABLE NO. 39. : Global Bundled Packages International Mobile Roaming Services Market Revenue, By Region, 2024 – 2032 (USD Million) 105
TABLE NO. 40. : Global Subscription Services International Mobile Roaming Services Market Revenue, By Region, 2018 – 2023 (USD Million) 107
TABLE NO. 41. : Global Subscription Services International Mobile Roaming Services Market Revenue, By Region, 2024 – 2032 (USD Million) 107
TABLE NO. 42. : Global Discounted Roaming Plans International Mobile Roaming Services Market Revenue, By Region, 2018 – 2023 (USD Million) 109
TABLE NO. 43. : Global Discounted Roaming Plans International Mobile Roaming Services Market Revenue, By Region, 2024 – 2032 (USD Million) 109
TABLE NO. 44. : Global Mobile Network Operators (MNOs) International Mobile Roaming Services Market Revenue, By Region, 2018 – 2023 (USD Million) 115
TABLE NO. 45. : Global Mobile Network Operators (MNOs) International Mobile Roaming Services Market Revenue, By Region, 2024 – 2032 (USD Million) 115
TABLE NO. 46. : Global Mobile Virtual Network Operators (MVNOs) International Mobile Roaming Services Market Revenue, By Region, 2018 – 2023 (USD Million) 117
TABLE NO. 47. : Global Mobile Virtual Network Operators (MVNOs) International Mobile Roaming Services Market Revenue, By Region, 2024 – 2032 (USD Million) 117
TABLE NO. 48. : Global Online Platforms International Mobile Roaming Services Market Revenue, By Region, 2018 – 2023 (USD Million) 119
TABLE NO. 49. : Global Online Platforms International Mobile Roaming Services Market Revenue, By Region, 2024 – 2032 (USD Million) 119
TABLE NO. 50. : Global Travel Agencies International Mobile Roaming Services Market Revenue, By Region, 2018 – 2023 (USD Million) 121
TABLE NO. 51. : Global Travel Agencies International Mobile Roaming Services Market Revenue, By Region, 2024 – 2032 (USD Million) 121
TABLE NO. 52. : Global Retail Stores International Mobile Roaming Services Market Revenue, By Region, 2018 – 2023 (USD Million) 123
TABLE NO. 53. : Global Retail Stores International Mobile Roaming Services Market Revenue, By Region, 2024 – 2032 (USD Million) 123
TABLE NO. 54. : Global International Mobile Roaming Services Market Revenue, By Region, 2018 – 2023 (USD Million) 128
TABLE NO. 55. : Global International Mobile Roaming Services Market Revenue, By Region, 2024 – 2032 (USD Million) 128
TABLE NO. 56. : Global International Mobile Roaming Services Market Revenue, By Service Type, 2018 – 2023 (USD Million) 129
TABLE NO. 57. : Global International Mobile Roaming Services Market Revenue, By Service Type, 2024 – 2032 (USD Million) 129
TABLE NO. 58. : Global International Mobile Roaming Services Market Revenue, By Customer Type, 2018 – 2023 (USD Million) 130
TABLE NO. 59. : Global International Mobile Roaming Services Market Revenue, By Customer Type, 2024 – 2032 (USD Million) 130
TABLE NO. 60. : Global International Mobile Roaming Services Market Revenue, By End-user, 2018 – 2023 (USD Million) 131
TABLE NO. 61. : Global International Mobile Roaming Services Market Revenue, By End-user, 2024 – 2032 (USD Million) 131
TABLE NO. 62. : Global International Mobile Roaming Services Market Revenue, By Pricing Model, 2018 – 2023 (USD Million) 132
TABLE NO. 63. : Global International Mobile Roaming Services Market Revenue, By Pricing Model, 2024 – 2032 (USD Million) 132
TABLE NO. 64. : Global International Mobile Roaming Services Market Revenue, By Distribution Channel, 2018 – 2023 (USD Million) 133
TABLE NO. 65. : Global International Mobile Roaming Services Market Revenue, By Distribution Channel, 2024 – 2032 (USD Million) 133
TABLE NO. 66. : North America International Mobile Roaming Services Market Revenue, By Country, 2018 – 2023 (USD Million) 136
TABLE NO. 67. : North America International Mobile Roaming Services Market Revenue, By Country, 2024 – 2032 (USD Million) 136
TABLE NO. 68. : North America International Mobile Roaming Services Market Revenue, By Service Type, 2018 – 2023 (USD Million) 137
TABLE NO. 69. : North America International Mobile Roaming Services Market Revenue, By Service Type, 2024 – 2032 (USD Million) 137
TABLE NO. 70. : North America International Mobile Roaming Services Market Revenue, By Customer Type, 2018 – 2023 (USD Million) 138
TABLE NO. 71. : North America International Mobile Roaming Services Market Revenue, By Customer Type, 2024 – 2032 (USD Million) 138
TABLE NO. 72. : North America International Mobile Roaming Services Market Revenue, By End-user, 2018 – 2023 (USD Million) 139
TABLE NO. 73. : North America International Mobile Roaming Services Market Revenue, By End-user, 2024 – 2032 (USD Million) 139
TABLE NO. 74. : North America International Mobile Roaming Services Market Revenue, By Pricing Model, 2018 – 2023 (USD Million) 140
TABLE NO. 75. : North America International Mobile Roaming Services Market Revenue, By Pricing Model, 2024 – 2032 (USD Million) 140
TABLE NO. 76. : North America International Mobile Roaming Services Market Revenue, By Distribution Channel, 2018 – 2023 (USD Million) 141
TABLE NO. 77. : North America International Mobile Roaming Services Market Revenue, By Distribution Channel, 2024 – 2032 (USD Million) 141
TABLE NO. 78. : Europe International Mobile Roaming Services Market Revenue, By Country, 2018 – 2023 (USD Million) 144
TABLE NO. 79. : Europe International Mobile Roaming Services Market Revenue, By Country, 2024 – 2032 (USD Million) 144
TABLE NO. 80. : Europe International Mobile Roaming Services Market Revenue, By Service Type, 2018 – 2023 (USD Million) 145
TABLE NO. 81. : Europe International Mobile Roaming Services Market Revenue, By Service Type, 2024 – 2032 (USD Million) 145
TABLE NO. 82. : Europe International Mobile Roaming Services Market Revenue, By Customer Type, 2018 – 2023 (USD Million) 146
TABLE NO. 83. : Europe International Mobile Roaming Services Market Revenue, By Customer Type, 2024 – 2032 (USD Million) 146
TABLE NO. 84. : Europe International Mobile Roaming Services Market Revenue, By End-user, 2018 – 2023 (USD Million) 147
TABLE NO. 85. : Europe International Mobile Roaming Services Market Revenue, By End-user, 2024 – 2032 (USD Million) 147
TABLE NO. 86. : Europe International Mobile Roaming Services Market Revenue, By Pricing Model, 2018 – 2023 (USD Million) 148
TABLE NO. 87. : Europe International Mobile Roaming Services Market Revenue, By Pricing Model, 2024 – 2032 (USD Million) 148
TABLE NO. 88. : Europe International Mobile Roaming Services Market Revenue, By Distribution Channel, 2018 – 2023 (USD Million) 149
TABLE NO. 89. : Europe International Mobile Roaming Services Market Revenue, By Distribution Channel, 2024 – 2032 (USD Million) 149
TABLE NO. 90. : Asia Pacific International Mobile Roaming Services Market Revenue, By Country, 2018 – 2023 (USD Million) 152
TABLE NO. 91. : Asia Pacific International Mobile Roaming Services Market Revenue, By Country, 2024 – 2032 (USD Million) 152
TABLE NO. 92. : Asia Pacific International Mobile Roaming Services Market Revenue, By Service Type, 2018 – 2023 (USD Million) 153
TABLE NO. 93. : Asia Pacific International Mobile Roaming Services Market Revenue, By Service Type, 2024 – 2032 (USD Million) 153
TABLE NO. 94. : Asia Pacific International Mobile Roaming Services Market Revenue, By Customer Type, 2018 – 2023 (USD Million) 154
TABLE NO. 95. : Asia Pacific International Mobile Roaming Services Market Revenue, By Customer Type, 2024 – 2032 (USD Million) 154
TABLE NO. 96. : Asia Pacific International Mobile Roaming Services Market Revenue, By End-user, 2018 – 2023 (USD Million) 155
TABLE NO. 97. : Asia Pacific International Mobile Roaming Services Market Revenue, By End-user, 2024 – 2032 (USD Million) 155
TABLE NO. 98. : Asia Pacific International Mobile Roaming Services Market Revenue, By Pricing Model, 2018 – 2023 (USD Million) 156
TABLE NO. 99. : Asia Pacific International Mobile Roaming Services Market Revenue, By Pricing Model, 2024 – 2032 (USD Million) 156
TABLE NO. 100. : Asia Pacific International Mobile Roaming Services Market Revenue, By Distribution Channel, 2018 – 2023 (USD Million) 157
TABLE NO. 101. : Asia Pacific International Mobile Roaming Services Market Revenue, By Distribution Channel, 2024 – 2032 (USD Million) 157
TABLE NO. 102. : Latin America International Mobile Roaming Services Market Revenue, By Country, 2018 – 2023 (USD Million) 160
TABLE NO. 103. : Latin America International Mobile Roaming Services Market Revenue, By Country, 2024 – 2032 (USD Million) 160
TABLE NO. 104. : Latin America International Mobile Roaming Services Market Revenue, By Service Type, 2018 – 2023 (USD Million) 161
TABLE NO. 105. : Latin America International Mobile Roaming Services Market Revenue, By Service Type, 2024 – 2032 (USD Million) 161
TABLE NO. 106. : Latin America International Mobile Roaming Services Market Revenue, By Customer Type, 2018 – 2023 (USD Million) 162
TABLE NO. 107. : Latin America International Mobile Roaming Services Market Revenue, By Customer Type, 2024 – 2032 (USD Million) 162
TABLE NO. 108. : Latin America International Mobile Roaming Services Market Revenue, By End-user, 2018 – 2023 (USD Million) 163
TABLE NO. 109. : Latin America International Mobile Roaming Services Market Revenue, By End-user, 2024 – 2032 (USD Million) 163
TABLE NO. 110. : Latin America International Mobile Roaming Services Market Revenue, By Pricing Model, 2018 – 2023 (USD Million) 164
TABLE NO. 111. : Latin America International Mobile Roaming Services Market Revenue, By Pricing Model, 2024 – 2032 (USD Million) 164
TABLE NO. 112. : Latin America International Mobile Roaming Services Market Revenue, By Distribution Channel, 2018 – 2023 (USD Million) 165
TABLE NO. 113. : Latin America International Mobile Roaming Services Market Revenue, By Distribution Channel, 2024 – 2032 (USD Million) 165
TABLE NO. 114. : Middle East International Mobile Roaming Services Market Revenue, By Country, 2018 – 2023 (USD Million) 168
TABLE NO. 115. : Middle East International Mobile Roaming Services Market Revenue, By Country, 2024 – 2032 (USD Million) 168
TABLE NO. 116. : Middle East International Mobile Roaming Services Market Revenue, By Service Type, 2018 – 2023 (USD Million) 169
TABLE NO. 117. : Middle East International Mobile Roaming Services Market Revenue, By Service Type, 2024 – 2032 (USD Million) 169
TABLE NO. 118. : Middle East International Mobile Roaming Services Market Revenue, By Customer Type, 2018 – 2023 (USD Million) 170
TABLE NO. 119. : Middle East International Mobile Roaming Services Market Revenue, By Customer Type, 2024 – 2032 (USD Million) 170
TABLE NO. 120. : Middle East International Mobile Roaming Services Market Revenue, By End-user, 2018 – 2023 (USD Million) 171
TABLE NO. 121. : Middle East International Mobile Roaming Services Market Revenue, By End-user, 2024 – 2032 (USD Million) 171
TABLE NO. 122. : Middle East International Mobile Roaming Services Market Revenue, By Pricing Model, 2018 – 2023 (USD Million) 172
TABLE NO. 123. : Middle East International Mobile Roaming Services Market Revenue, By Pricing Model, 2024 – 2032 (USD Million) 172
TABLE NO. 124. : Middle East International Mobile Roaming Services Market Revenue, By Distribution Channel, 2018 – 2023 (USD Million) 173
TABLE NO. 125. : Middle East International Mobile Roaming Services Market Revenue, By Distribution Channel, 2024 – 2032 (USD Million) 173
TABLE NO. 126. : Africa International Mobile Roaming Services Market Revenue, By Country, 2018 – 2023 (USD Million) 176
TABLE NO. 127. : Africa International Mobile Roaming Services Market Revenue, By Country, 2024 – 2032 (USD Million) 176
TABLE NO. 128. : Africa International Mobile Roaming Services Market Revenue, By Service Type, 2018 – 2023 (USD Million) 177
TABLE NO. 129. : Africa International Mobile Roaming Services Market Revenue, By Service Type, 2024 – 2032 (USD Million) 177
TABLE NO. 130. : Africa International Mobile Roaming Services Market Revenue, By Customer Type, 2018 – 2023 (USD Million) 178
TABLE NO. 131. : Africa International Mobile Roaming Services Market Revenue, By Customer Type, 2024 – 2032 (USD Million) 178
TABLE NO. 132. : Africa International Mobile Roaming Services Market Revenue, By End-user, 2018 – 2023 (USD Million) 179
TABLE NO. 133. : Africa International Mobile Roaming Services Market Revenue, By End-user, 2024 – 2032 (USD Million) 179
TABLE NO. 134. : Africa International Mobile Roaming Services Market Revenue, By Pricing Model, 2018 – 2023 (USD Million) 180
TABLE NO. 135. : Africa International Mobile Roaming Services Market Revenue, By Pricing Model, 2024 – 2032 (USD Million) 180
TABLE NO. 136. : Africa International Mobile Roaming Services Market Revenue, By Distribution Channel, 2018 – 2023 (USD Million) 181
TABLE NO. 137. : Africa International Mobile Roaming Services Market Revenue, By Distribution Channel, 2024 – 2032 (USD Million) 181